


Important preliminary remarks
Since Intel no longer realizes the contact between Die and Heatspreader by metallic solder at Skylake-X and Kaby Lake-X, but also avoids cheaper TIM (Thermal Interface Material), we have also looked at the measurements for the power consumption, as well as moved on a very narrow ridge during the later overclocking.
In order to be able to carry out meaningful measurement series at all, we therefore consciously rely on our Alphacool Ice Age Chiller 2000 (industrial compressor cooler), on whose application and the achieved results we will go into even more detail in the course of the following tests. To want. With air cooling or even a normal all-in-one compact water cooling, the Intel Core i9-7900X in particular is hardly any not to be able to cope at all.

Without wanting to anticipate the results: we also provided our motherboard with a fan, as we were able to detect current flows with up to 230 amperes, especially in the overclocking measurement series. That's why we have cooled both the voltage converters and the area around the base, because we only have one motherboard for these tests and therefore only one test.
We have determined the power consumption directly on the motherboard after the voltage converters (and thus on the CPU), whose losses must of course also be taken into account by the end customer in the estimation of the required power supply power. However, since these values are very model dependent on the respective motherboard (up to 30 watts and more), we deliberately used only the pure power consumption values of the CPU. The results come from the appropriate sensors. as well as the shunts and corresponding voltage measuring points on the motherboard.
Power consumption at normal clock and various workloads
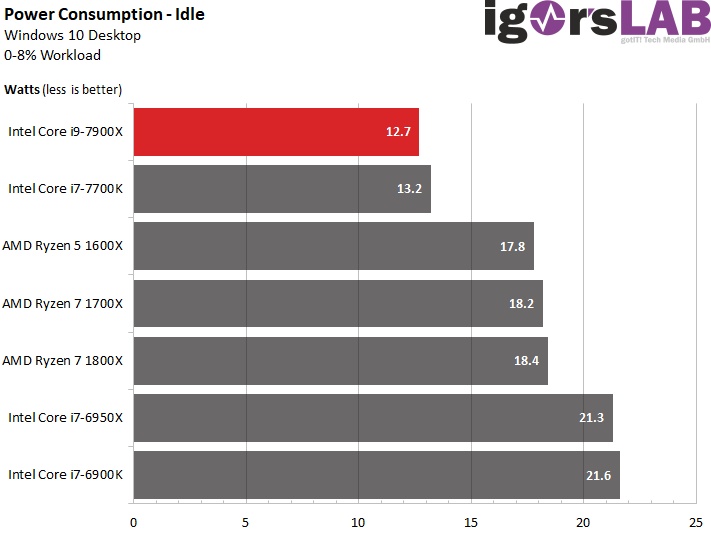
First, let's compare the Intel Core i9-7900X with the other relevant CPUs, before going into the details and possible overclocking and its consequences in the form of power consumption. We determined the results with our motherboard Out-Of-The-Box, because a significant voltage reduction brought nothing except stability problems.
In the idle, the Core i9-7900X is significantly lower than its predecessors and well below what the current Ryzen CPUs absorb in terms of performance. However, we only reached these values after a BIOS update fixed various problems with the P-States on the motherboard.
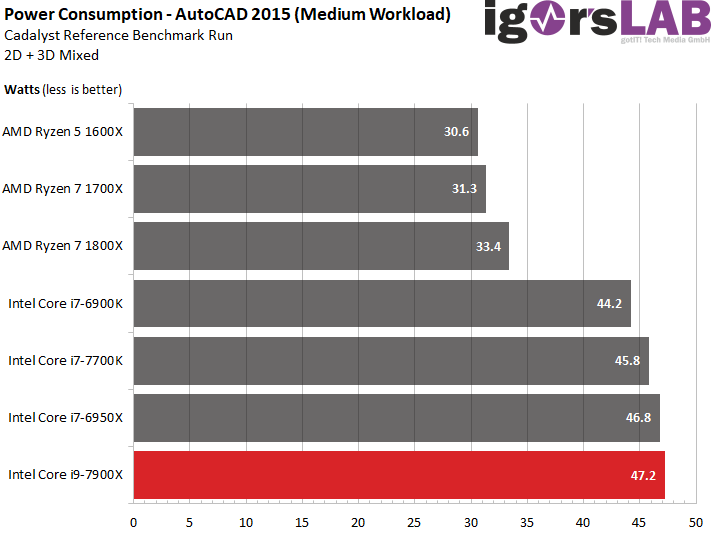
Even when working very relaxed with AutoCAD 2015, where never all cores are really used, the Core i9-7900X is behind all other CPUs, which is certainly due to the higher clock than the direct predecessor model Core i7-6950X. If you put this into perspective with the performance gained, the Core i9-7900X is in a much better position. The negligible one percent difference in power consumption is now offset by an astonishing 29% more performance in 2D performance and a whopping 39% in 3D performance, both of which benefit from the significantly higher clock speed of Turbo Boost 3.0. !
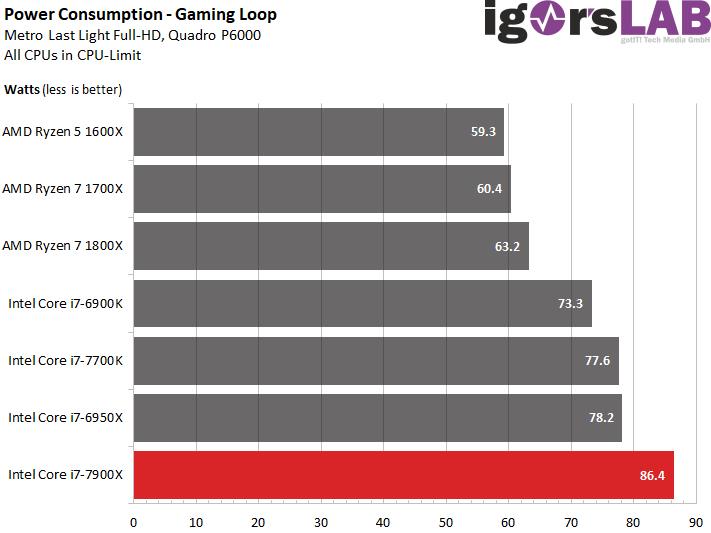
However, the great increase in the use of only one or two cores is quickly put into perspective when more than three cores are used. Sure, the Core i9-7900X can clearly set itself off from the Core i7-6950X, but unfortunately this also continues in terms of power consumption. Now there are approx. 17% performance gain compared to a more than 10 percent higher power consumption.
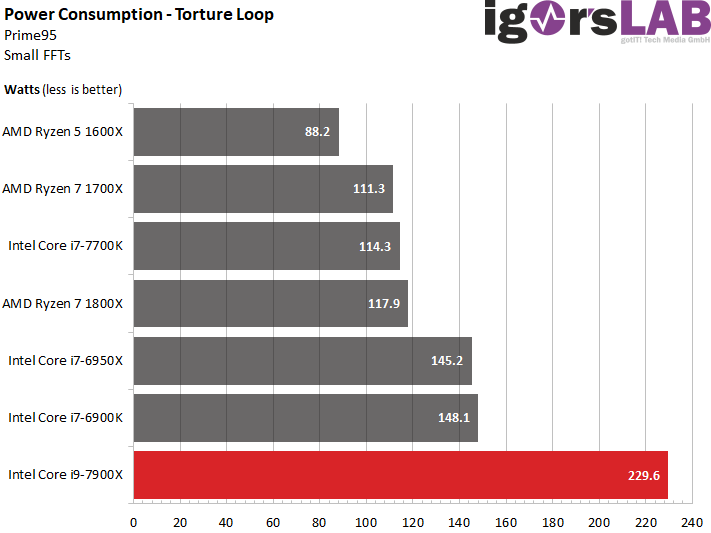
But woe betide if you really use all the cores! With Both Prime95 and Luxrender, we have determined absolute peak power consumption values on all cores for the Core i9-7900X. While the Core i9-7900X achieves a remarkable 48% more performance in the render score (luxrender, console), it also absorbs 58% more electrical power! This is almost the famous blue crowbar.
Overclocking and stability
We have just found that the ratio of performance to power consumption shifts sharply into negative terms as core utilization increases. This, in turn, we now have to take this into account in the following overclocking tests, because conventional cooling methods will hardly be found beyond the 200 watt limit.
Really prime-stable and without temperature limit, the CPU could only be overclocked up to 4.4 GHz really long-term. Pre-recorded overclocking results of up to 5 GHz with all cores should therefore be provided with a very thick question mark. We were able to start Windows at 5.1 GHz, but real applications led to either a BSOD or even a motherboard emergency shutdown.
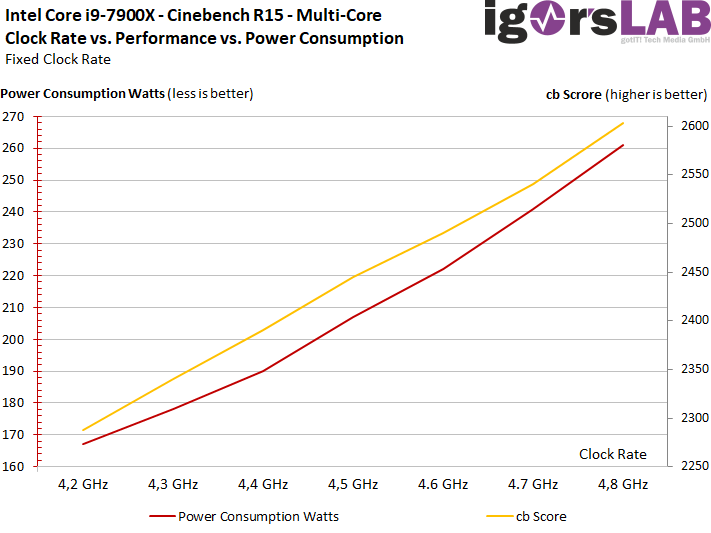
However, the Core i9-7900X could be safely overclocked up to 4.8 GHz, at least with Cinebench R15 (multi-core and single-core), which of course should also be due to the cooling solution used. Realistically, an all-in-one solution is more likely to be 4.5 GHz, as long as you don't shoot the system into the sky with a power virus. Let's look at the comparison curves for Cinebench R15 when operating all cores:
The system ran stable in 10 runs with 1.4 volt S/Vcore and the CPU absorbed an average of 261 watts of power. However, individual peaks were already up to 293 watts depending on the load, which comes very close to the limit value. A test carried out at 4.8 GHz with 20 instances of a shading all-year-round calculation for a complex photovoltaic roof system including yield calculation made the power consumption up to 335 watts fast. When Prime95 was started without AVX limitation, the motherboard then switched off. The last still logged value was indisputable 364 watts.
If you look at the curves of power consumption and performance over the individual clock levels, you can see that the power consumption increases a little faster with the increasing clock than the almost linearly scaling performance, but not as extreme as Fears. If you also compare the single-core performance with the required electrical power, then the course looks quite similar.
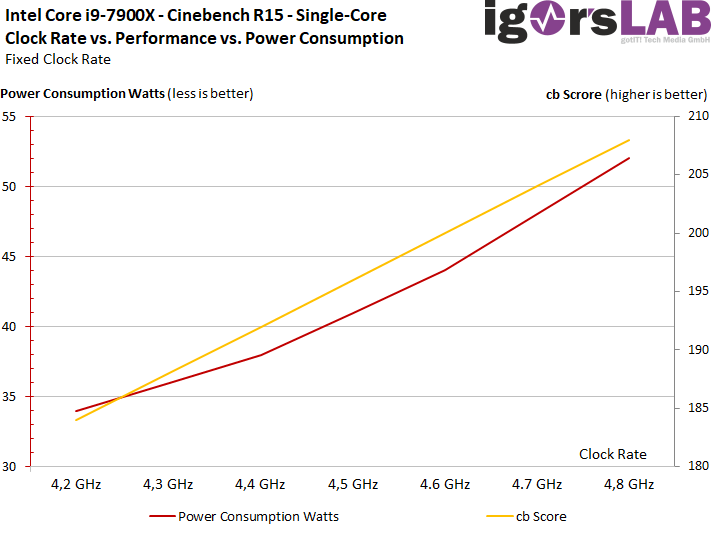
The slightly more pronounced curve is due to the relatively high value at lower clock frequencies, where the proportion of "basic noise" (other system load) is significantly higher.
But how can you really assess the overclocking reserves of the Core i9-7900X? We will have to pick up this interim conclusion for the next chapter, because we have to pay the service again. As a result, a possible overclocking is more than ever the quality of the cooling solution used.
- 1 - Einführung und Übersicht
- 2 - Intels Fabric - Mesh statt Ringbus
- 3 - Cache und Latenzen, IPC, AVX und Kryptographie
- 4 - Chipsatz, Testsystem und -methoden
- 5 - Problemanalyse mit Civilization VI und VRMark
- 6 - AotS Escalation, Battlefield 1, Deus Ex: Mankind
- 7 - GTA V, Hitman, Shadow of Mordor
- 8 - Project Cars, Rise of the Tomb Raider, The Division
- 9 - Workstation und HPC
- 10 - Leistungsaufnahme und Übertaktung
- 11 - Temperaturverläufe und thermische Probleme
- 12 - Zusammenfassung und Fazit


Kommentieren