


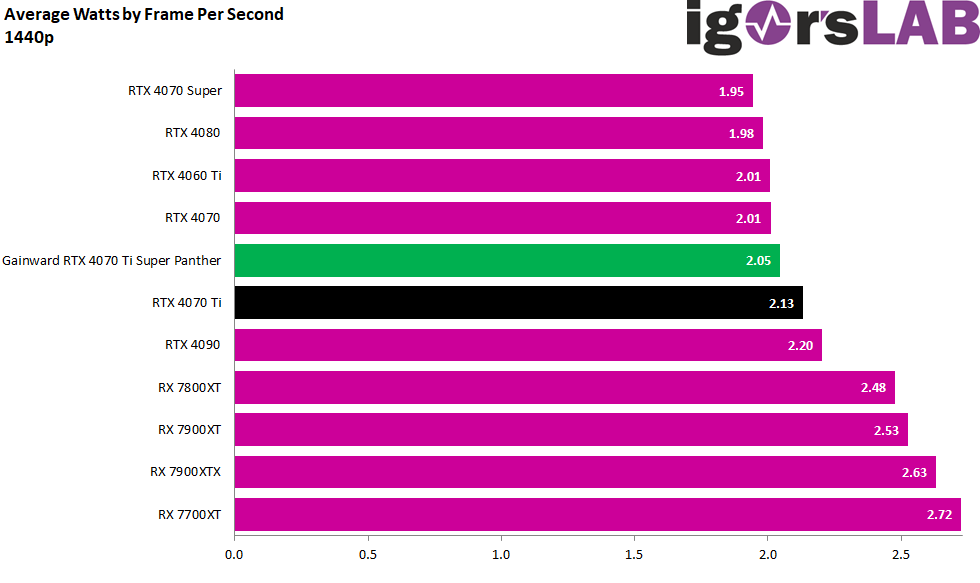
Sum of all games
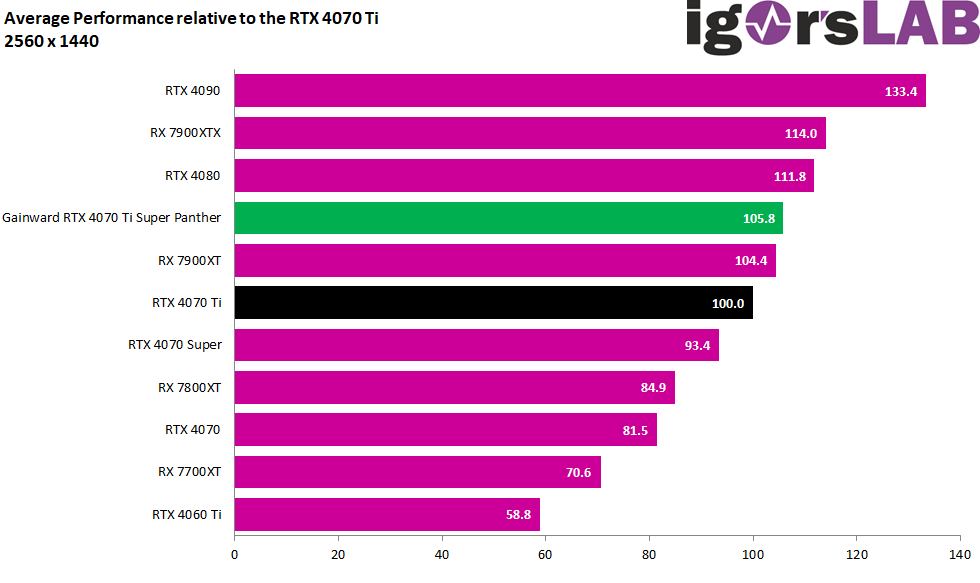
I have normalized the FPS and percentiles again and formed a geometric mean (Geomean) because this is simply more accurate from a statistical point of view and is also used in the industry. We again compare the two RTX 4070 Ti and RTX 4070 Ti Super as MSRP cards with the rest.
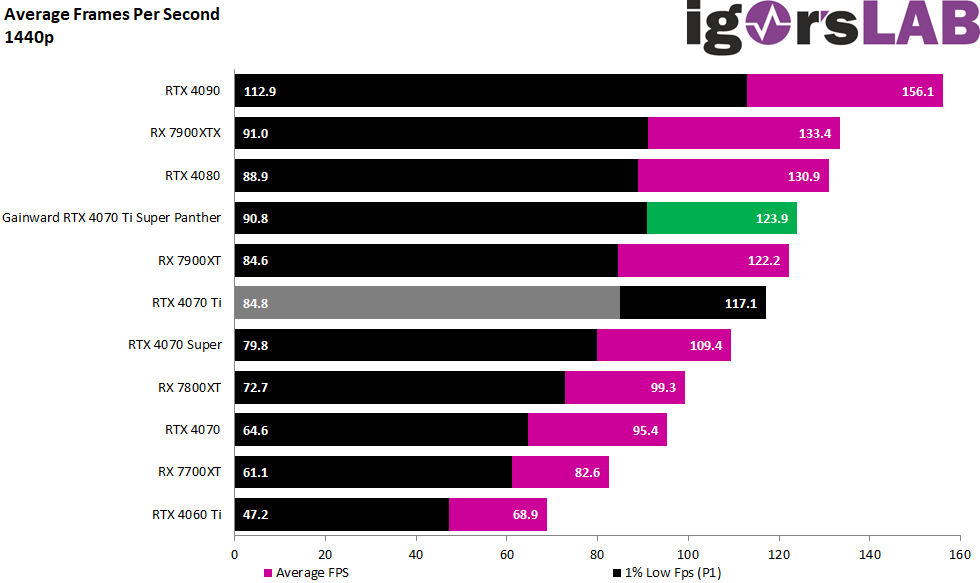
The RTX 4070 Ti Super takes around 5.8 percent off the non-Super and is in the range of what could be expected for QHD. The Radeon RX 7900XT also beats the RTX 4070 Ti Super in the mix of rendering and raster graphics by one percentage point, which once again confirms the purpose of the Super card. However, it is 6 percentage points behind the RTX 4080 FE in QHD.
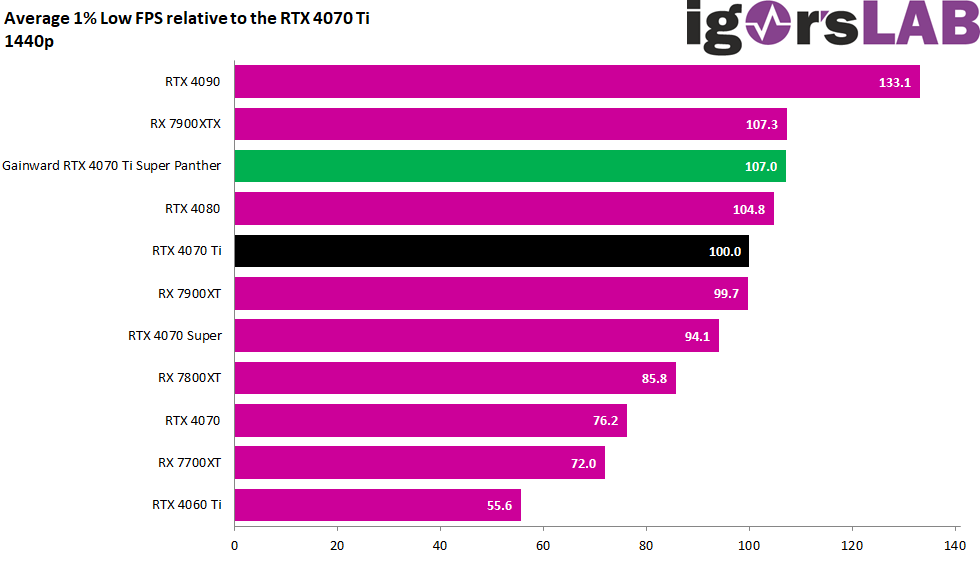
In P1, i.e. the min FPS, the card with the more shader cache is suddenly much more clearly ahead, as the CPU is no longer limiting either. In the P1, it even beats the RTX 4080 FE, although you have to look at the percentile curves again here, which quickly put this into perspective.
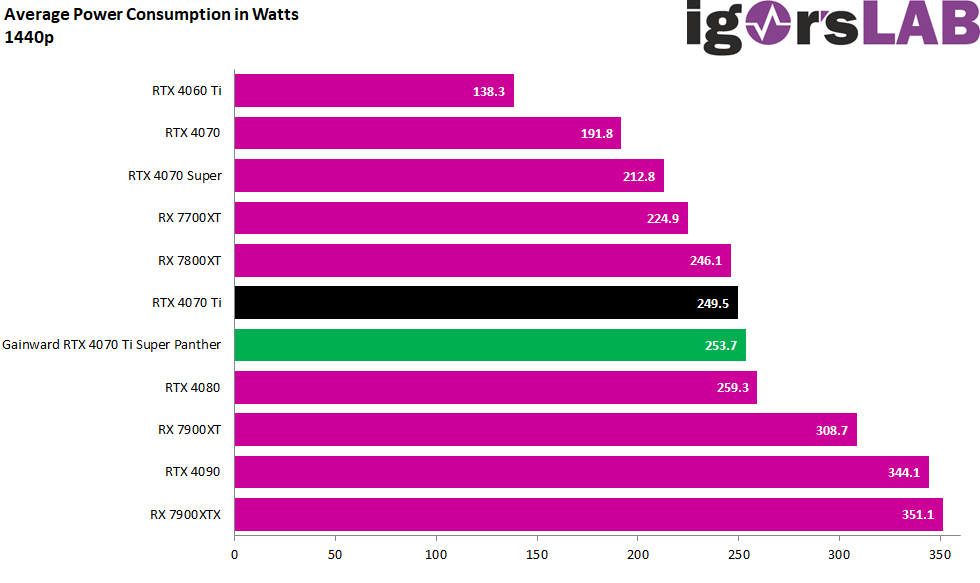
The power consumption, which is very pleasant in relation to the performance, continues seamlessly here, also in terms of height. Because 4.2 watts more is nothing that would immediately drive you to ruin. On the contrary, as the efficiency increases.

- 1 - Introduction, technical data and technology
- 2 - Test system and measuring equipment
- 3 - Teardown: PCB, components and cooler
- 4 - Teardown: Material analysis
- 5 - Gaming Performance FHD (1920 x 1080)
- 6 - Gaming-Performance WQHD (2560 x 1440)
- 7 - Gaming Performance Ultra-HD (3840 x 2160)
- 8 - Details: Power consumption and load distribution
- 9 - Load peaks, cutting and power supply recommendation
- 10 - Temperatures, clock rates and infrared analysis including pad mod
- 11 - Fan curves and noise
- 12 - Summary and conclusion


48 Antworten
Kommentar
Lade neue Kommentare
Mitglied
1
Veteran
Mitglied
Neuling
Urgestein
Urgestein
1
Mitglied
1
Mitglied
Urgestein
Mitglied
Veteran
Urgestein
Mitglied
Urgestein
Veteran
Alle Kommentare lesen unter igor´sLAB Community →