


Important preliminary remark on all graphics card tests
We are doing the same with benchmarks as in the previous launch test. In the end, there are only 10 specially selected games, but I have chosen these again from over 20 titles and the preliminary tests with several cards as examples, because the result was almost exactly the same in the end. The weighting between the titles with pure raster graphics completely without DXR and with DXR or DirectX12 features was done in a ratio of 6:4, whereby the titles and the implementation are very different.
DXR is being implemented in more and more games and almost all current engines now support it. From this point of view, it would be just as unfair to do without it completely as to only use such titles with DXR. As every user has different preferences and some prefer to do without DXR completely (why is that?), I am once again accommodating all target groups, but have tightened the reins a little. DLSS up to version 3.5 and FSR2/FSR3 including frame generation from both providers are now also included.
Sum of all games
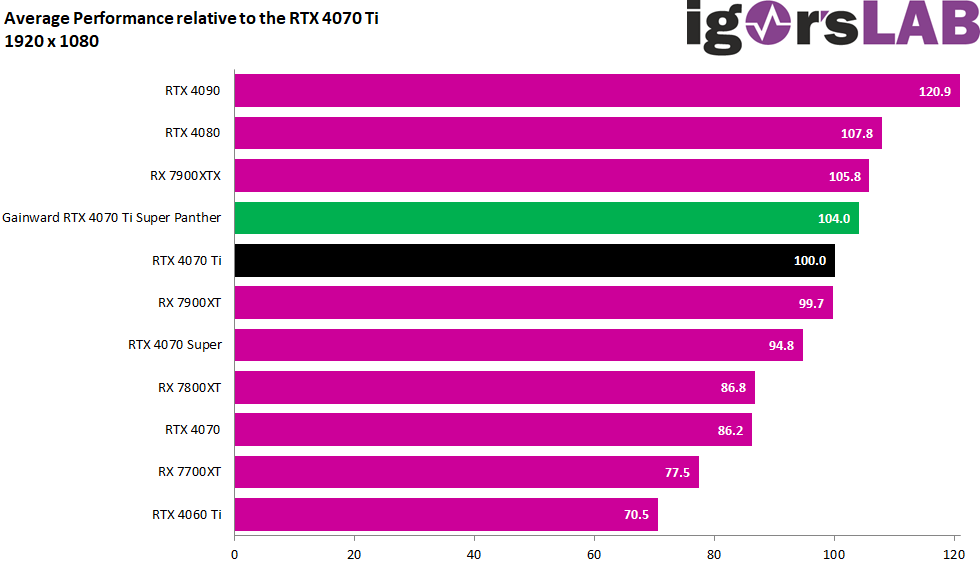
First, I’ll show you the normalized results of all games, because that’s what most people are most interested in. The details will of course follow in the usual detail. I have normalized the FPS and percentiles and formed a geometric mean (geomean) because this is simply more accurate from a statistical point of view and is also used in the industry.
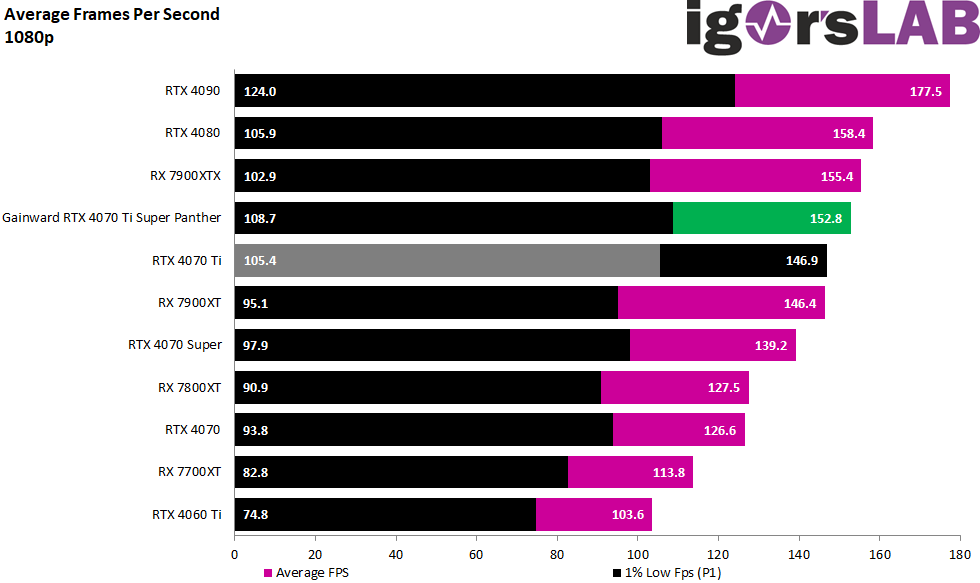
The approximately 4 percentage points advantage of the Super card over the RTX 4070 Ti Non-Super would certainly have been significantly higher if the overclocked CPU had not already partially limited it. The Non-Super is on a par with the Radeon RX 7900XT, which makes NVIDIA’s upgrade more than just plausible. You are more expensive, so you have to be faster. Thanks to the CPU bottle neck, the RTX 4070 Ti Super is also only 1.8 percentage points behind the RX 7900XTX.
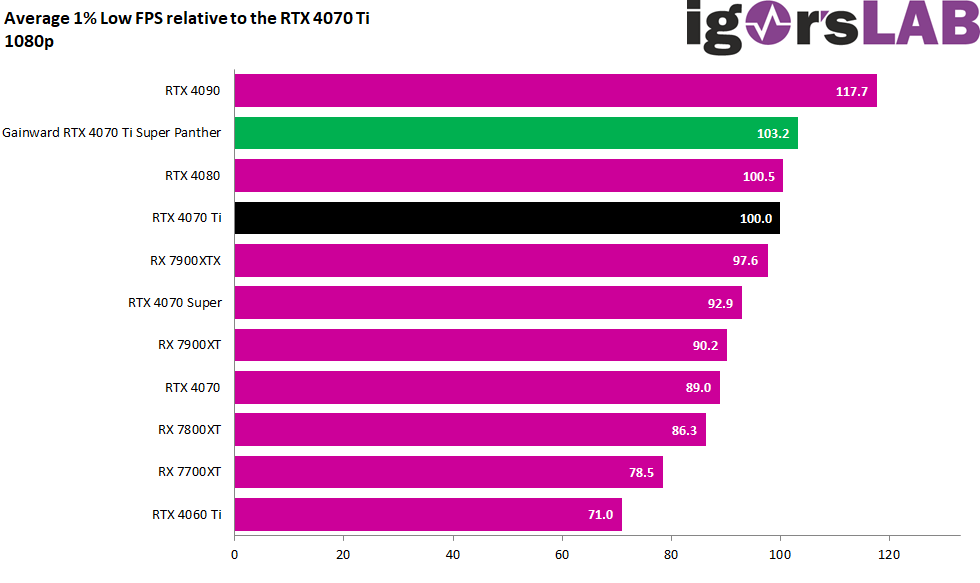
In the P1, i.e. the Min FPS, the two variants as Super and Non-Super are much closer together. Here, too, the CPU limit is still clearly noticeable and I strongly recommend looking at the complete percentile curve below. This is much more informative.
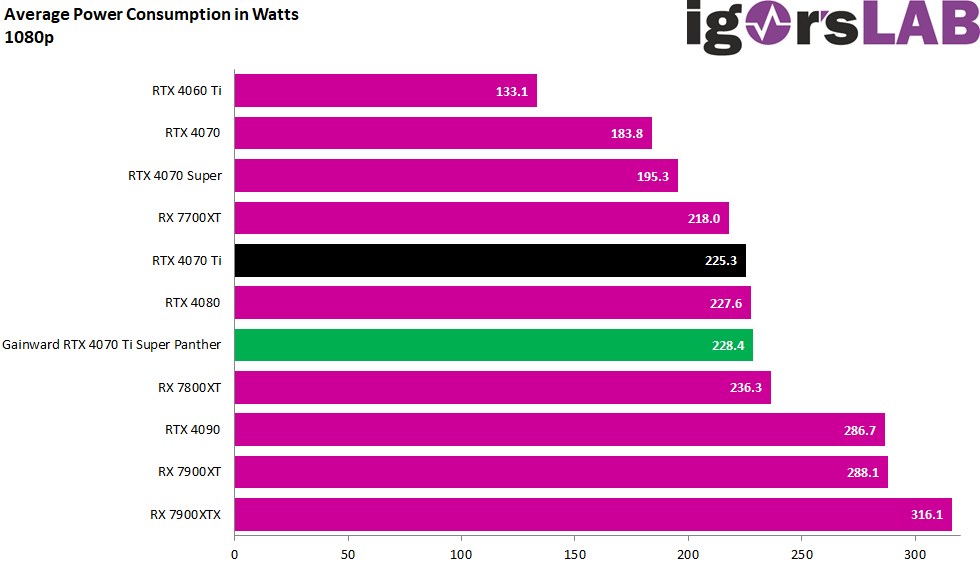
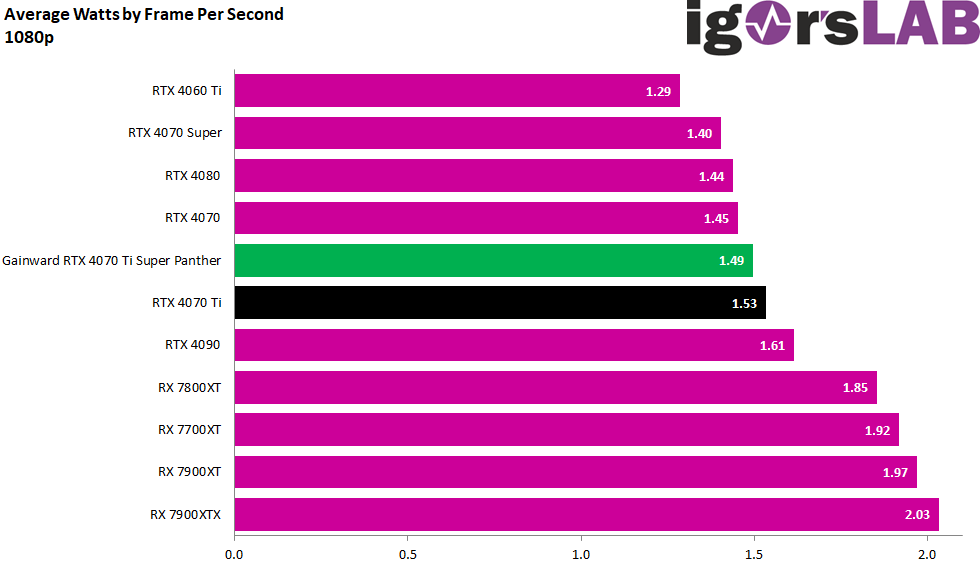
The power consumption is as expected, but the 2.1 watts compared to a non-super is not a disaster if you look at the equivalent value in FPS. On the contrary, the efficiency has even increased slightly.

- 1 - Introduction, technical data and technology
- 2 - Test system and measuring equipment
- 3 - Teardown: PCB, components and cooler
- 4 - Teardown: Material analysis
- 5 - Gaming Performance FHD (1920 x 1080)
- 6 - Gaming-Performance WQHD (2560 x 1440)
- 7 - Gaming Performance Ultra-HD (3840 x 2160)
- 8 - Details: Power consumption and load distribution
- 9 - Load peaks, cutting and power supply recommendation
- 10 - Temperatures, clock rates and infrared analysis including pad mod
- 11 - Fan curves and noise
- 12 - Summary and conclusion


48 Antworten
Kommentar
Lade neue Kommentare
Mitglied
1
Veteran
Mitglied
Neuling
Urgestein
Urgestein
1
Mitglied
1
Mitglied
Urgestein
Mitglied
Veteran
Urgestein
Mitglied
Urgestein
Veteran
Alle Kommentare lesen unter igor´sLAB Community →