


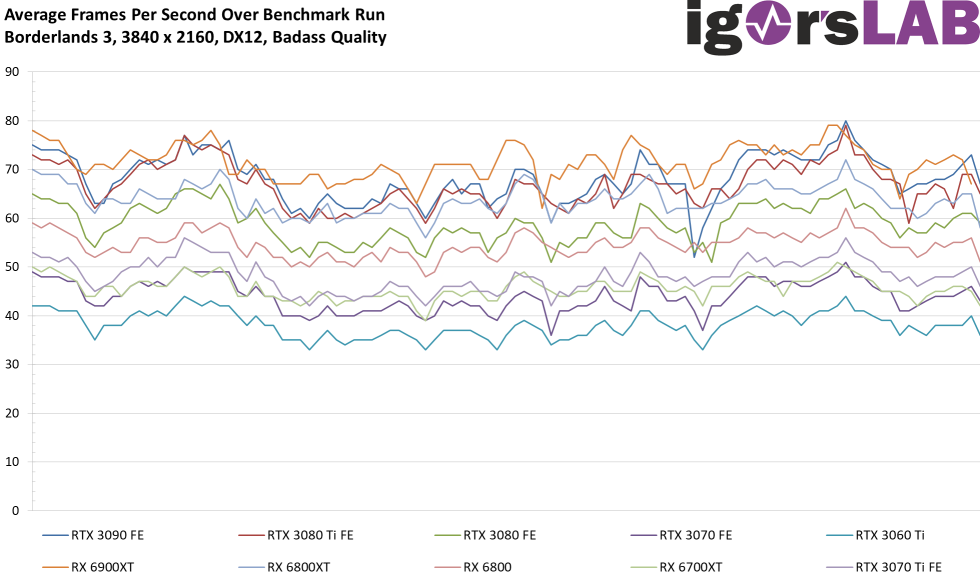
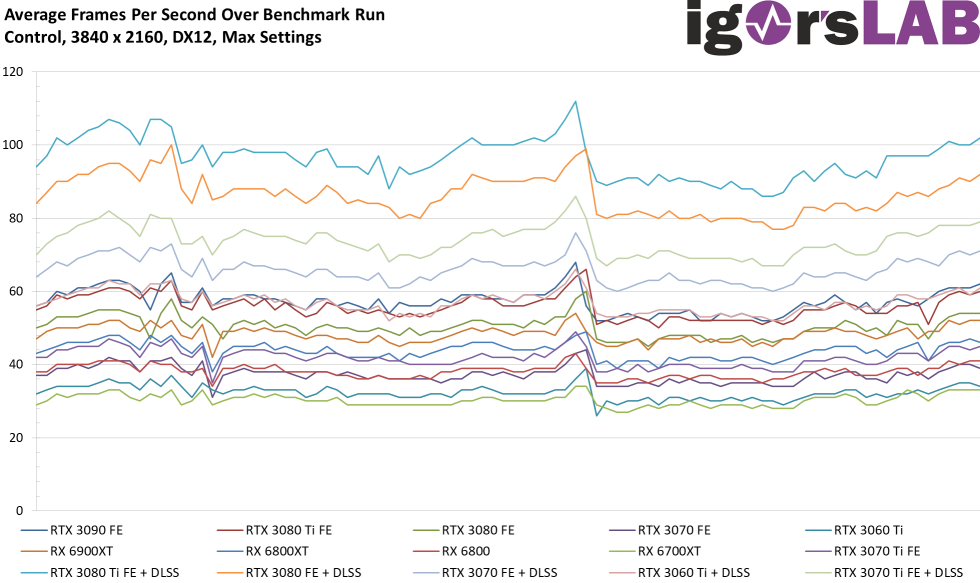
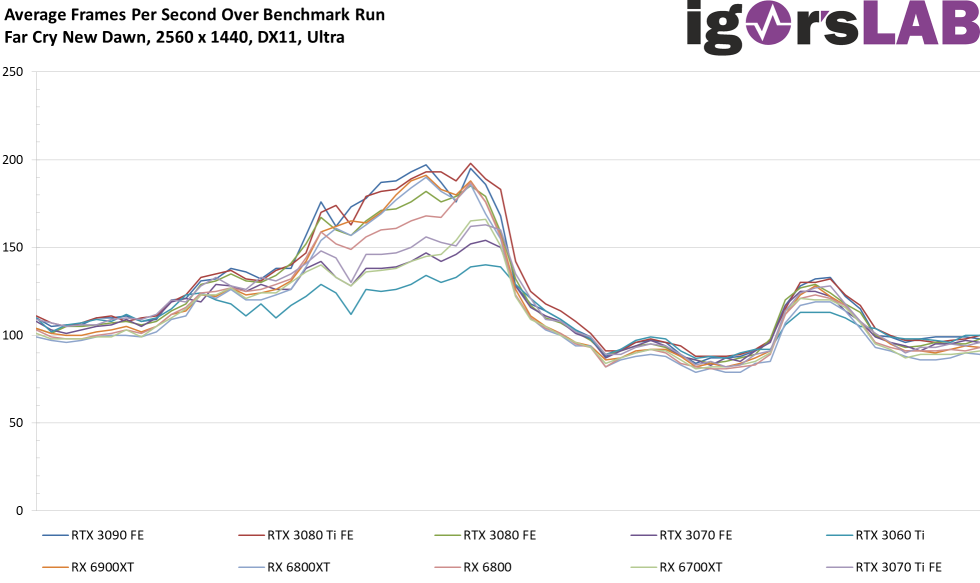
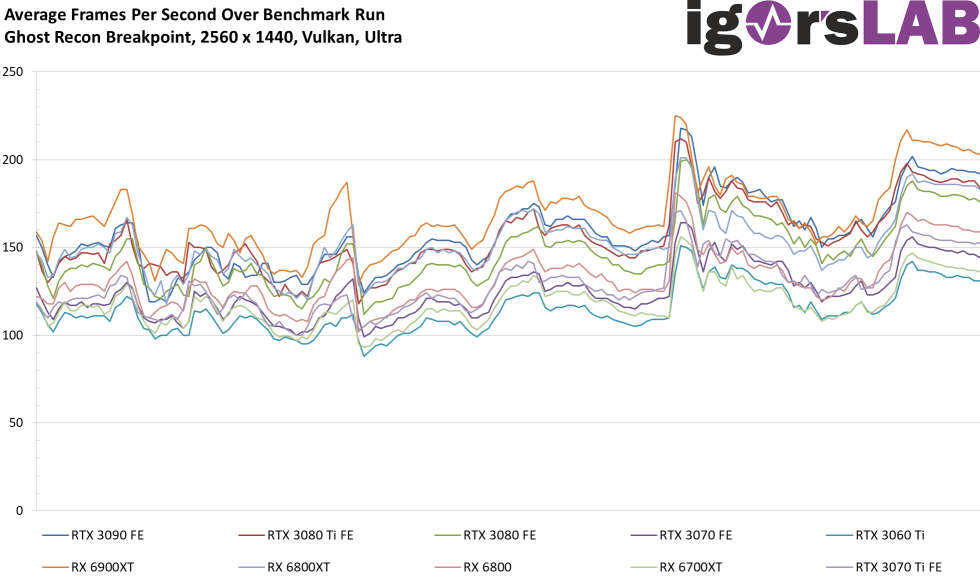
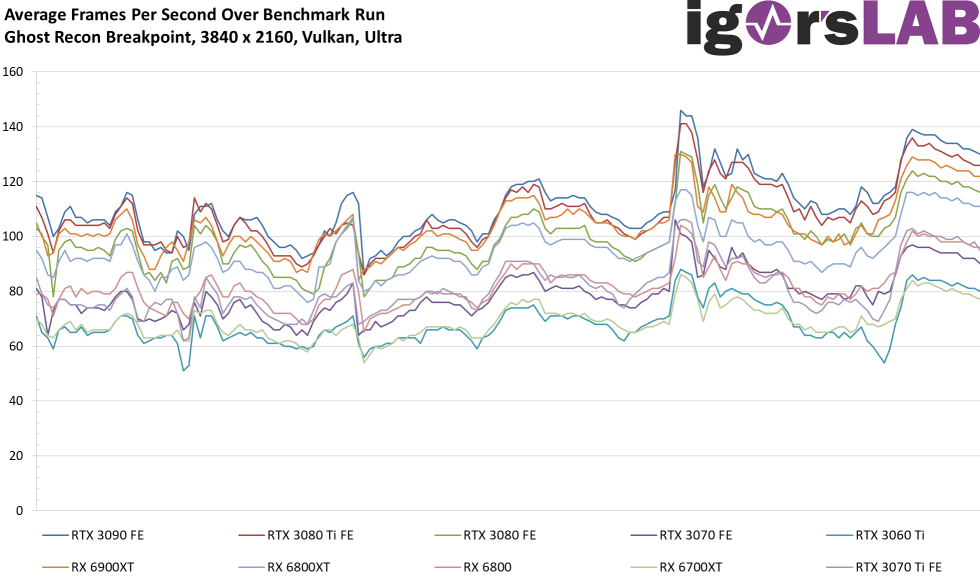
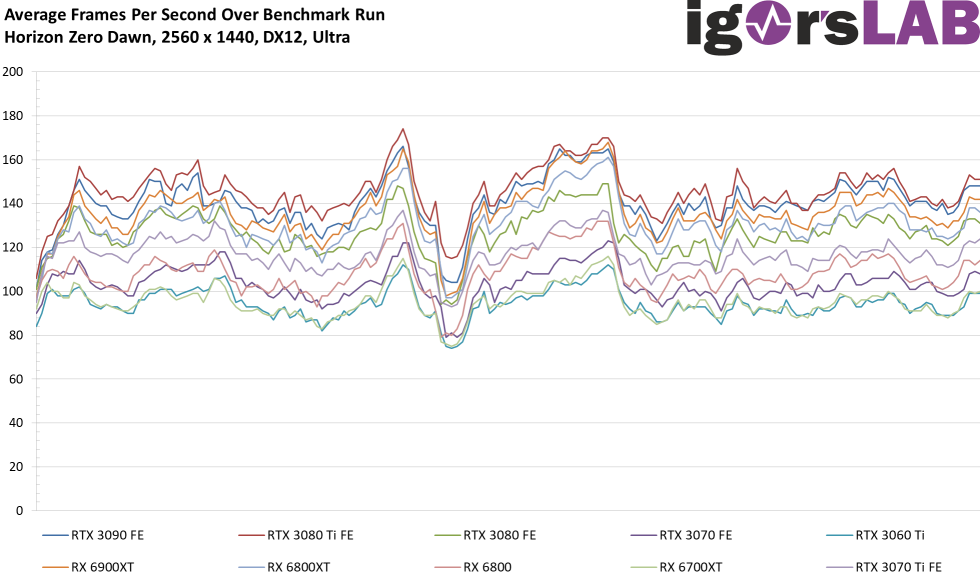
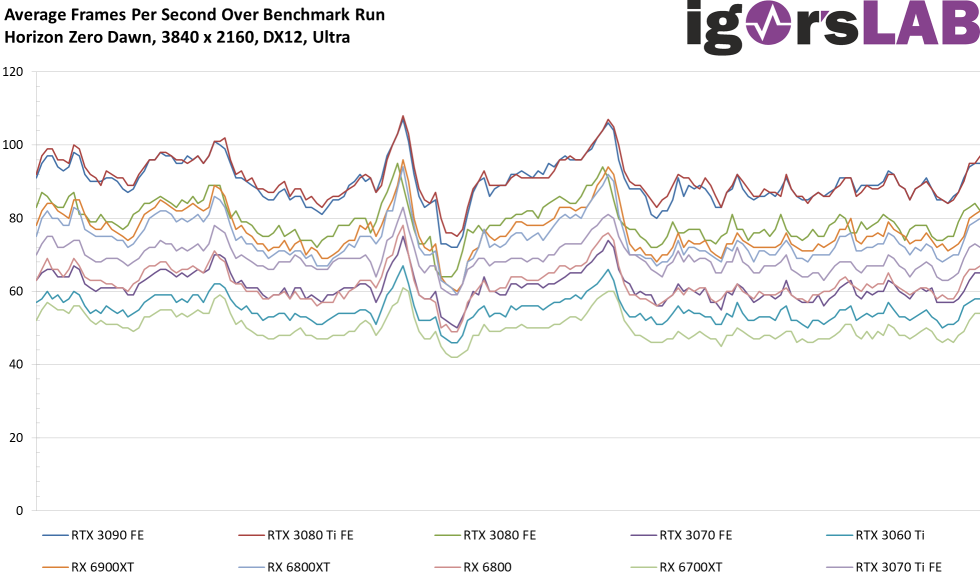
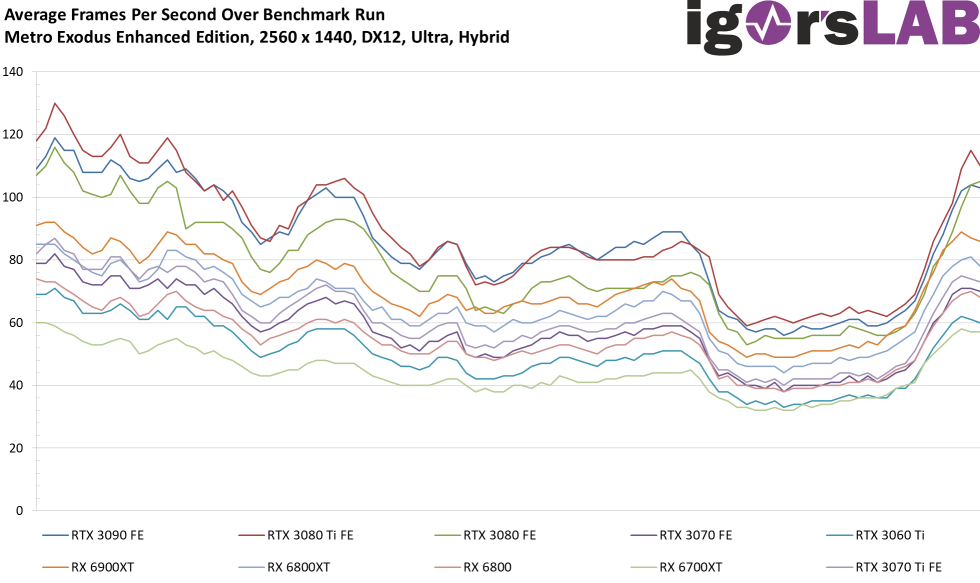
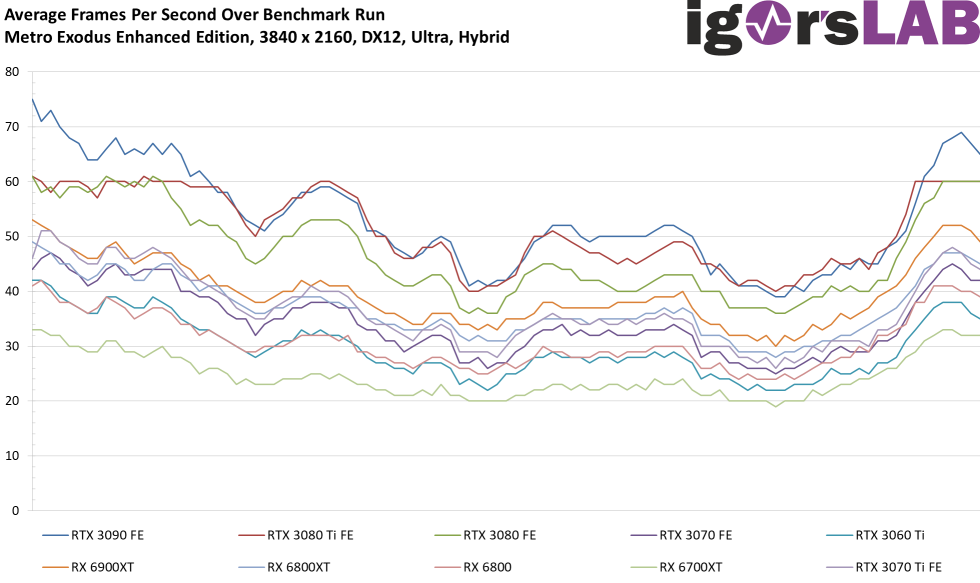
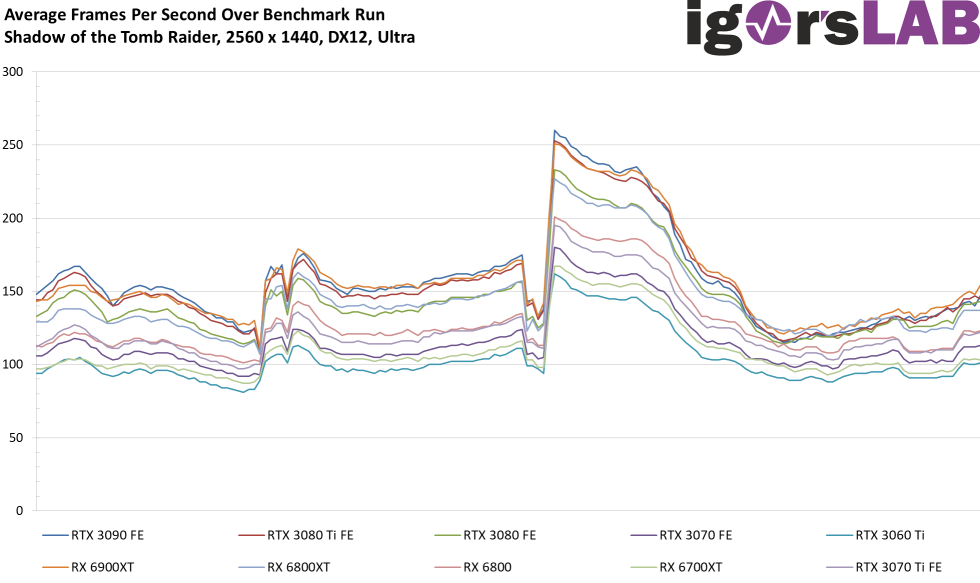
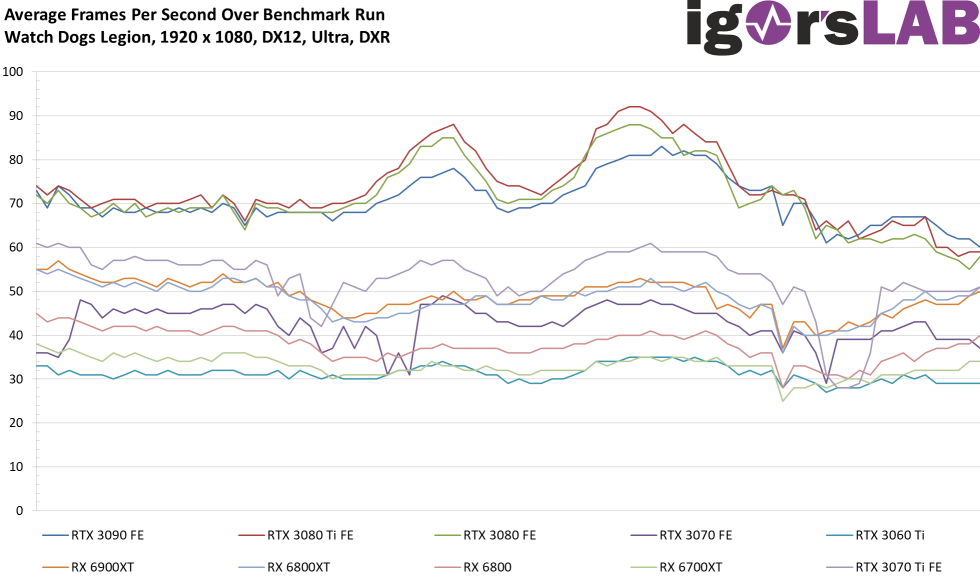
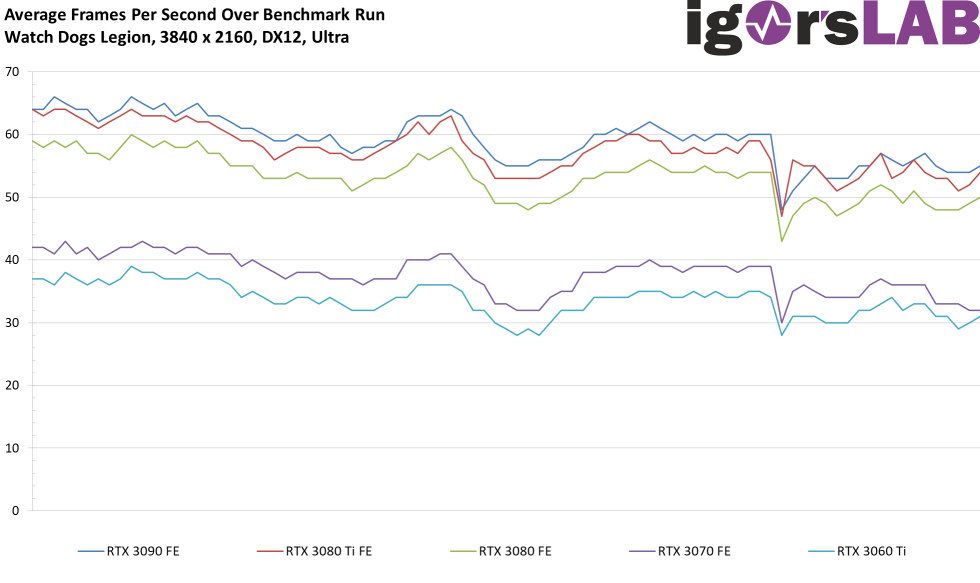
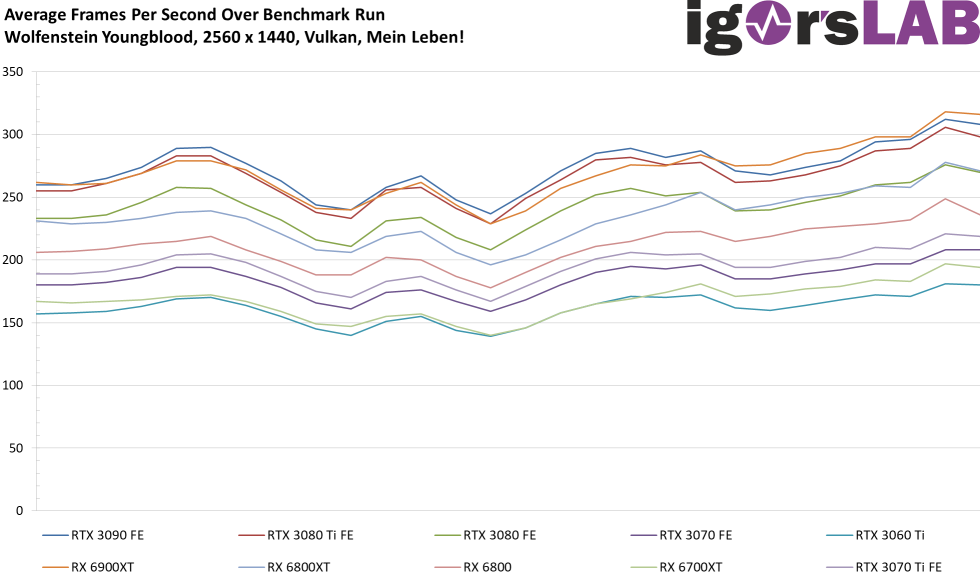
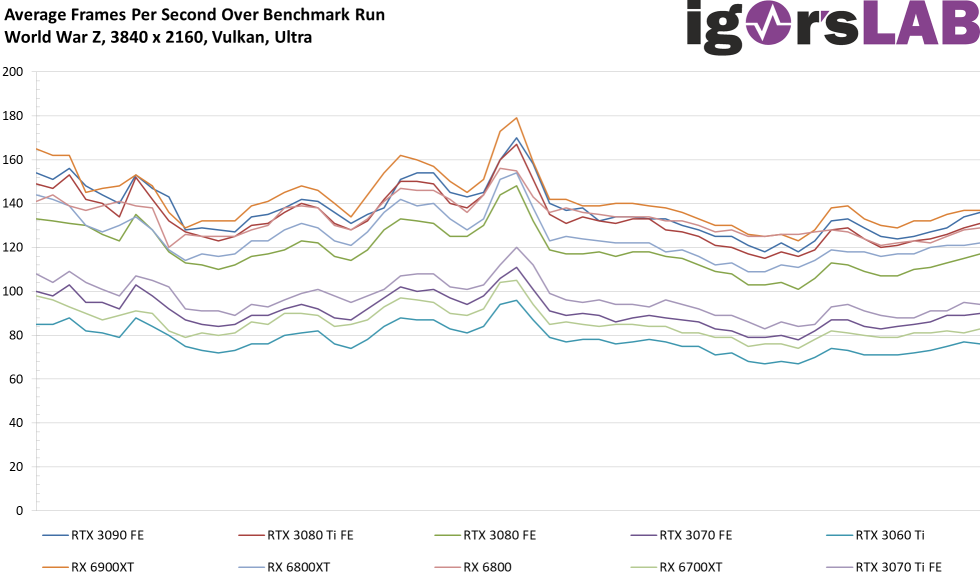
FPS histories of all games and resolutions


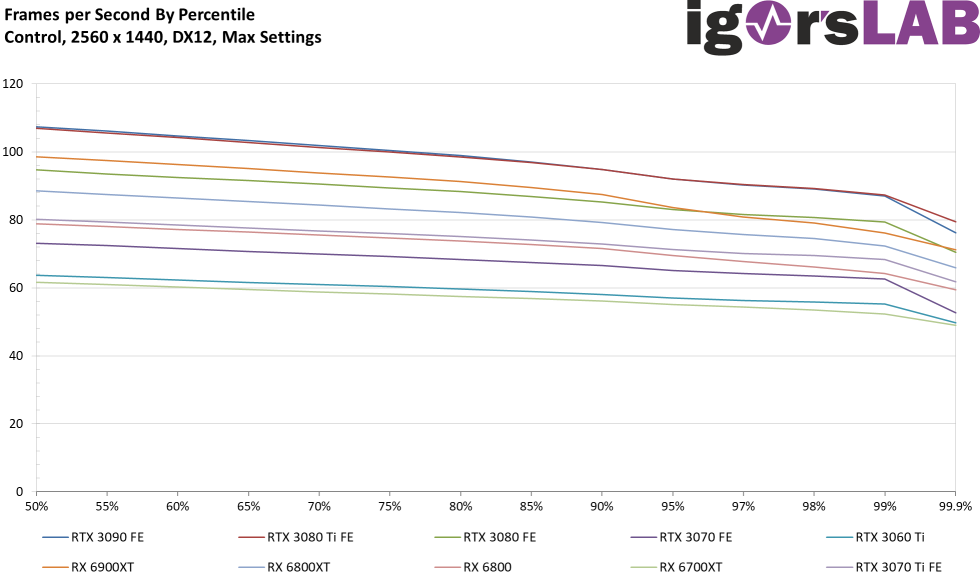
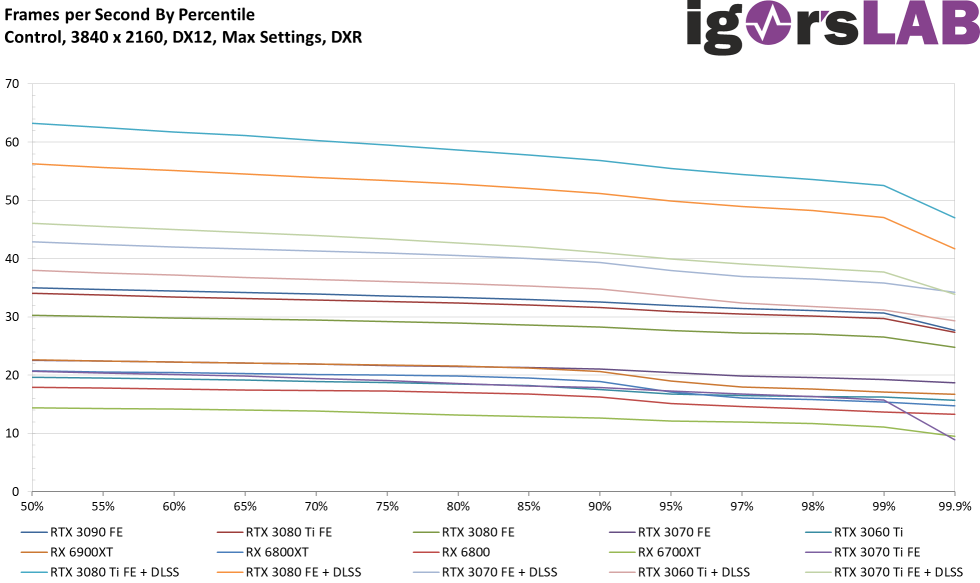
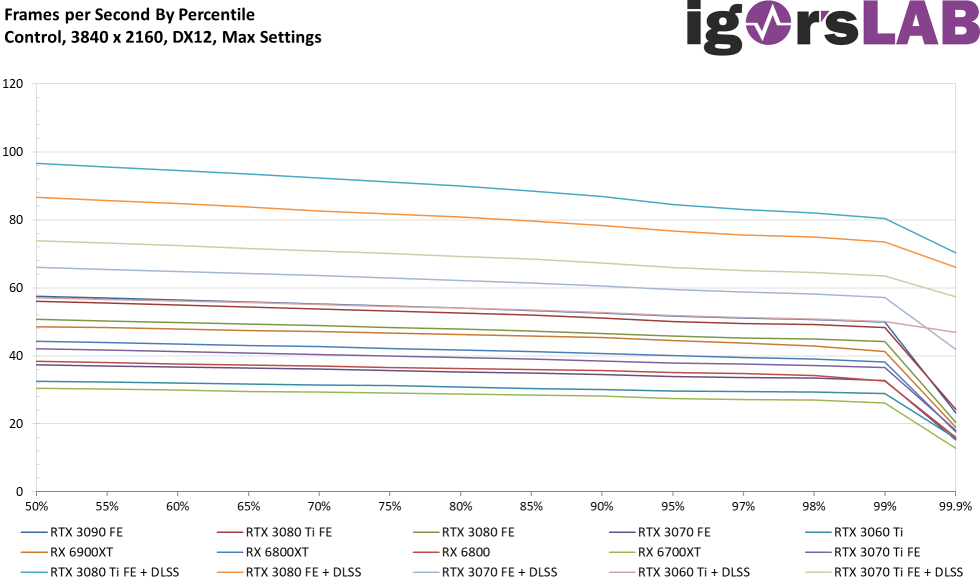
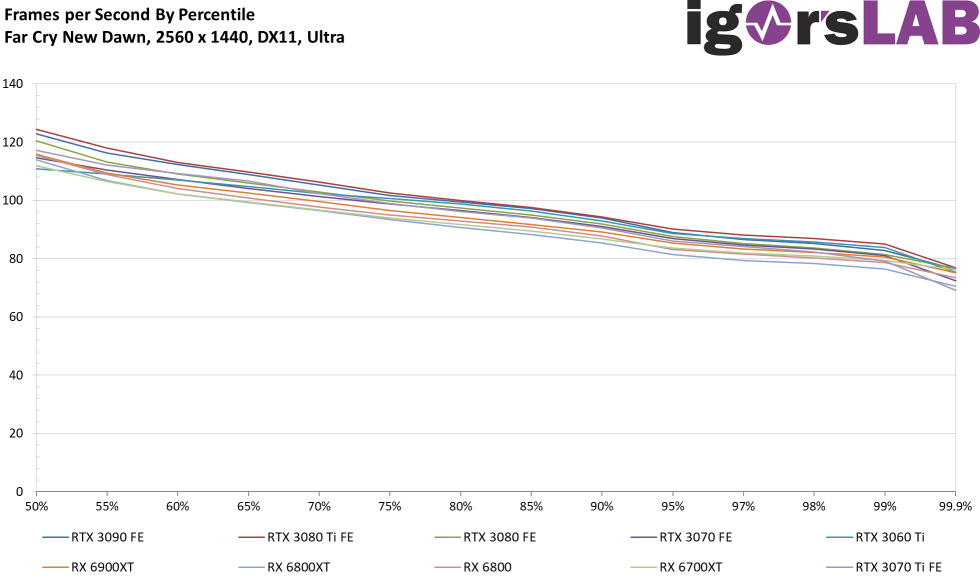
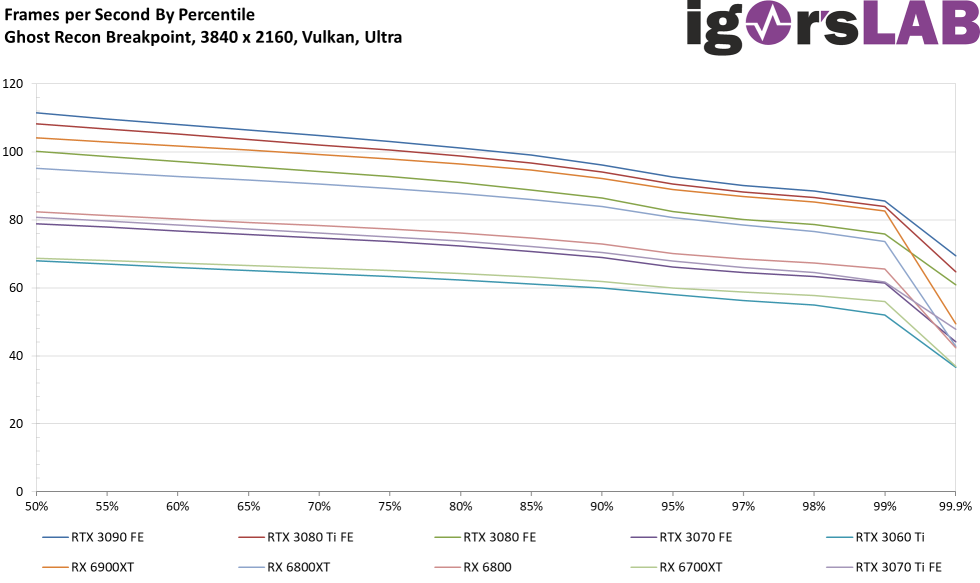
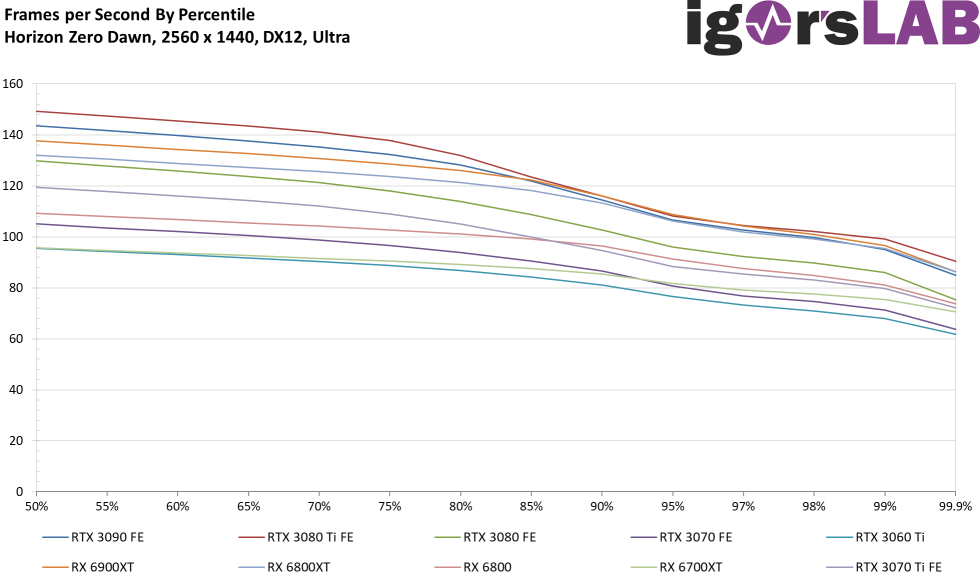
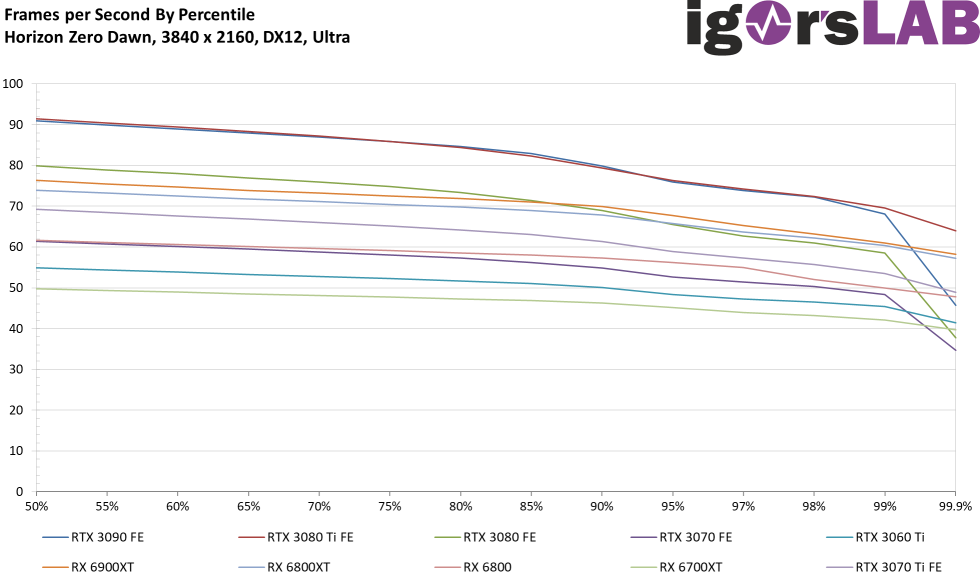
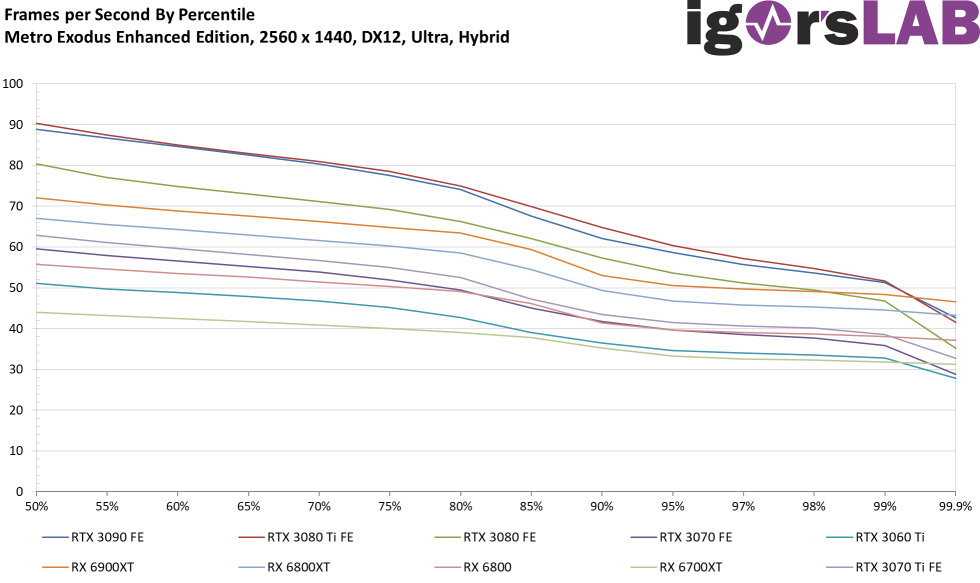
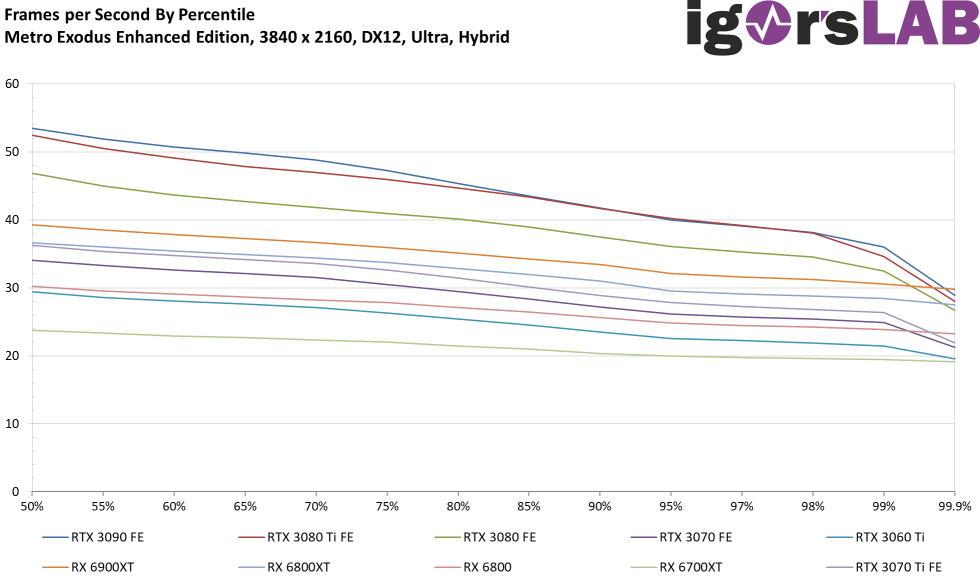
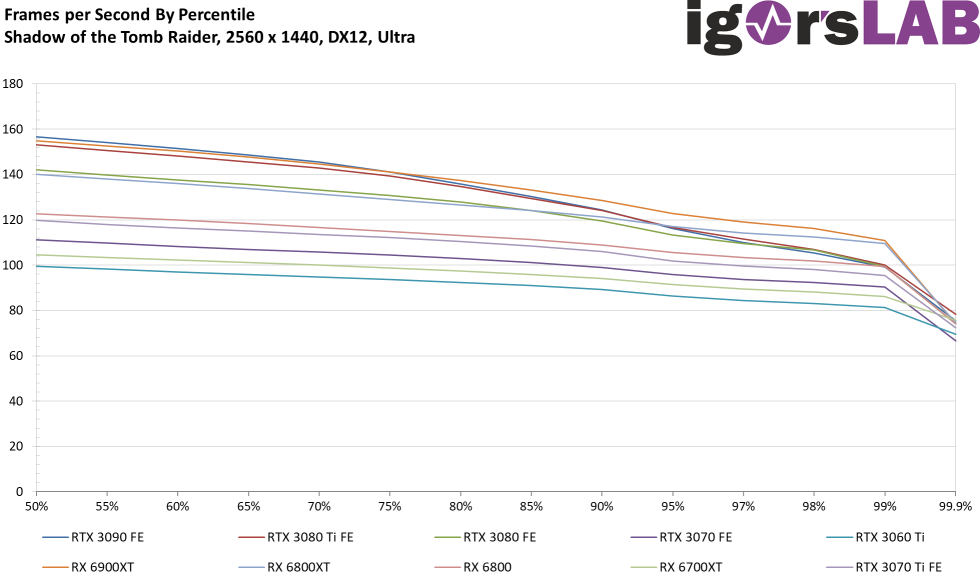
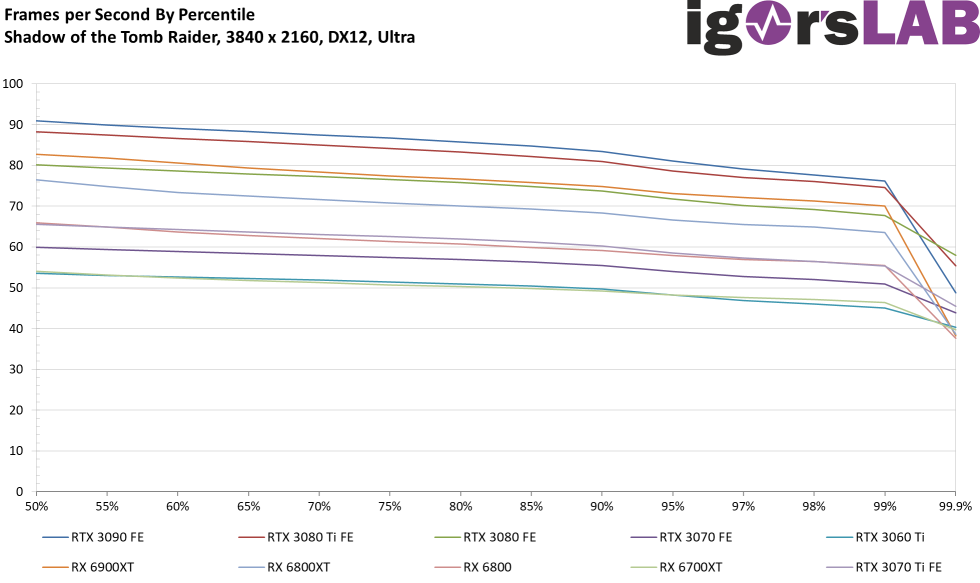
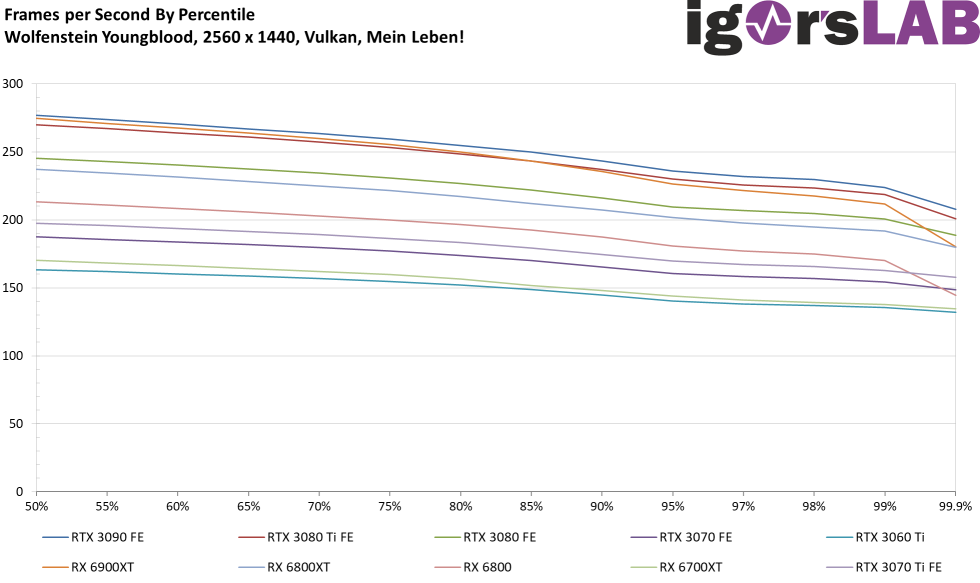
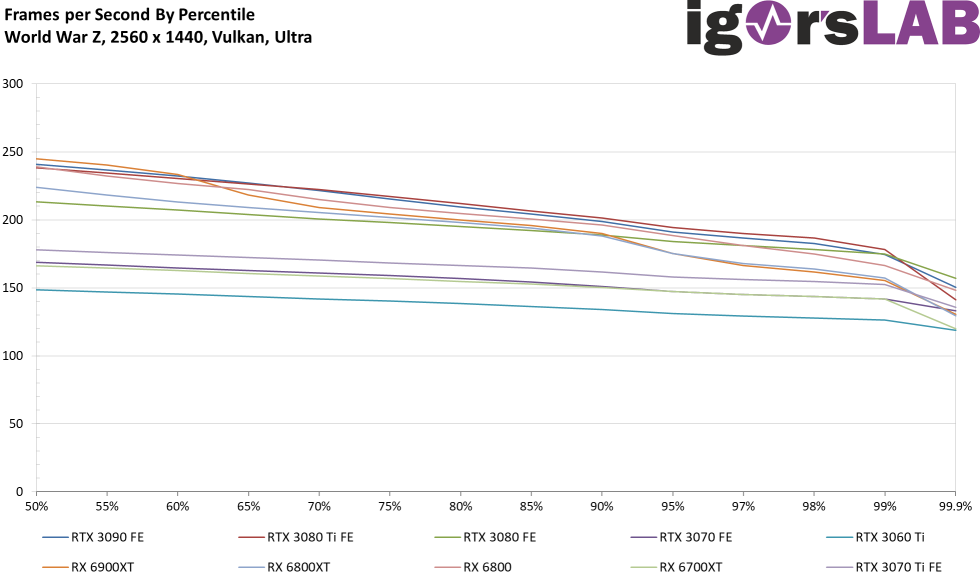
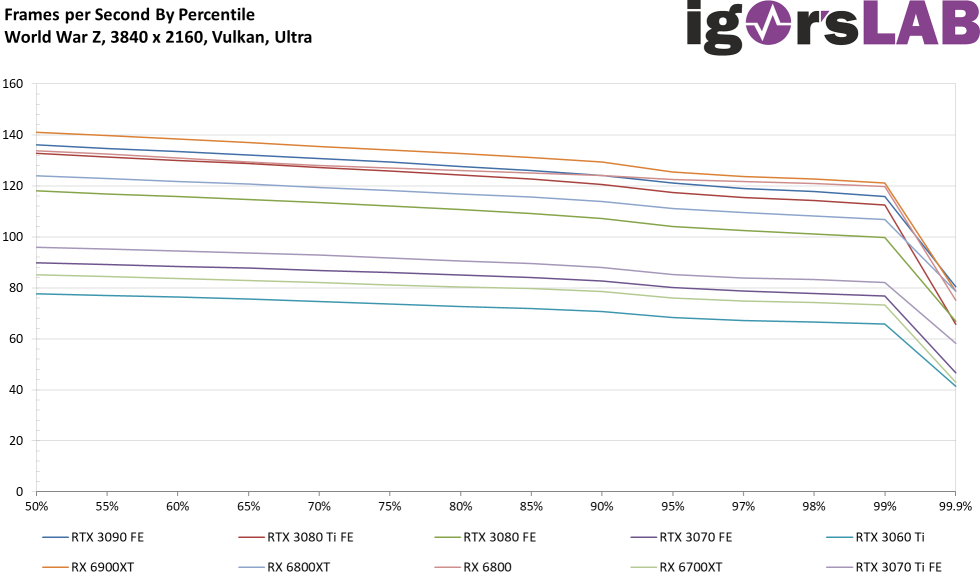
Percentiles of all games and resolutions as curves


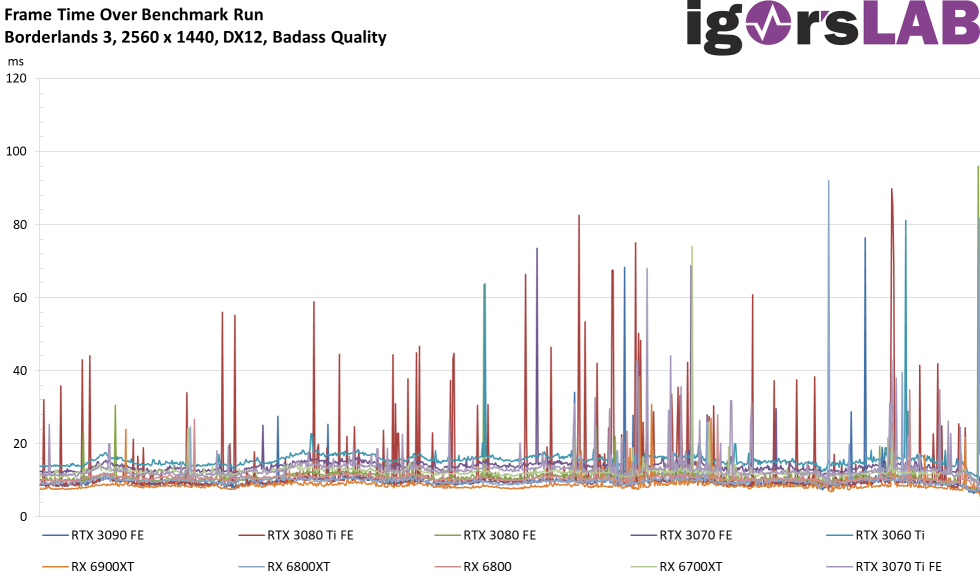
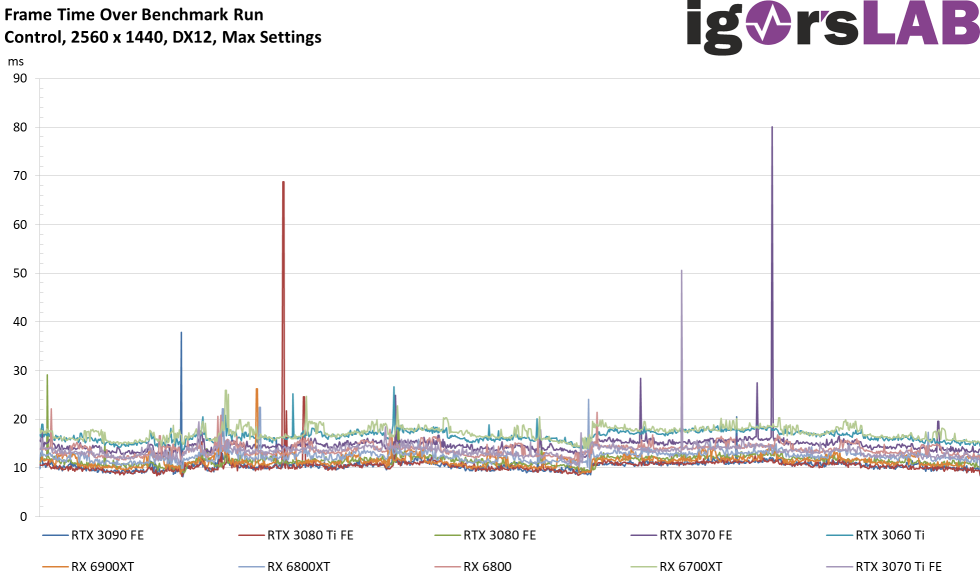
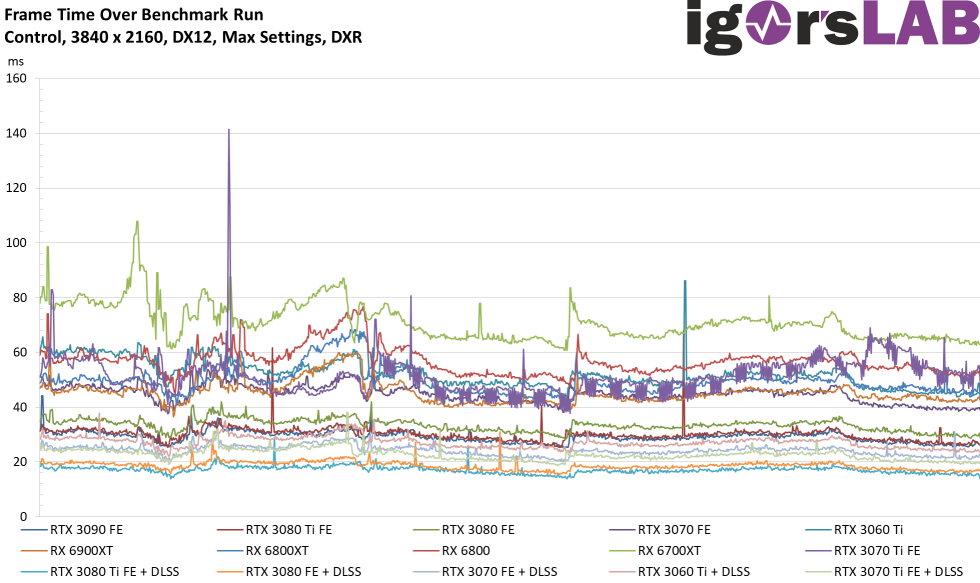
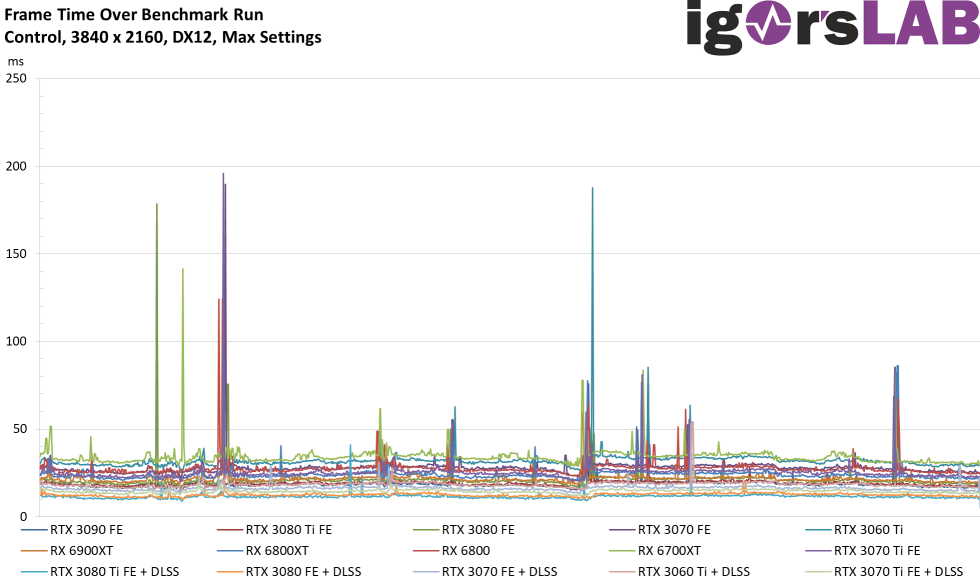
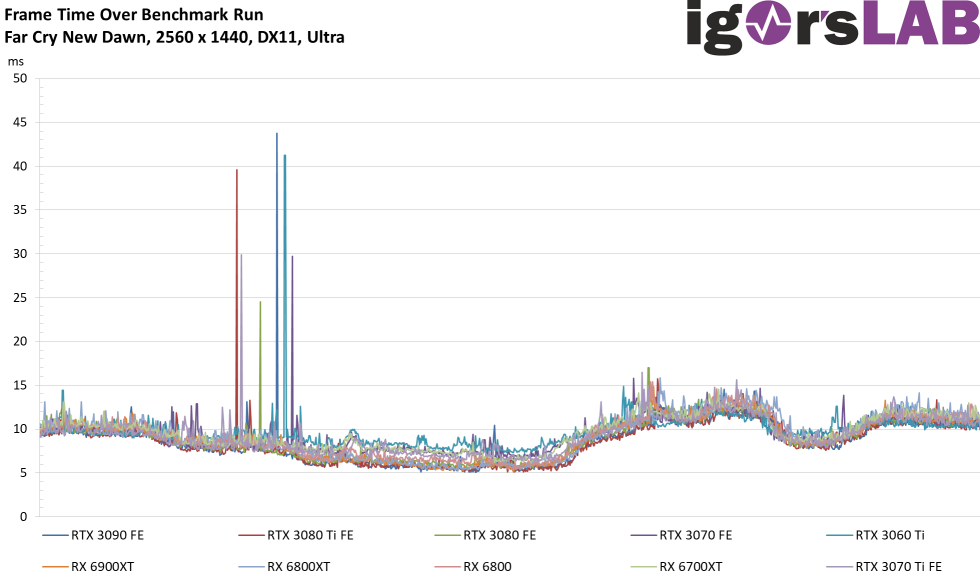
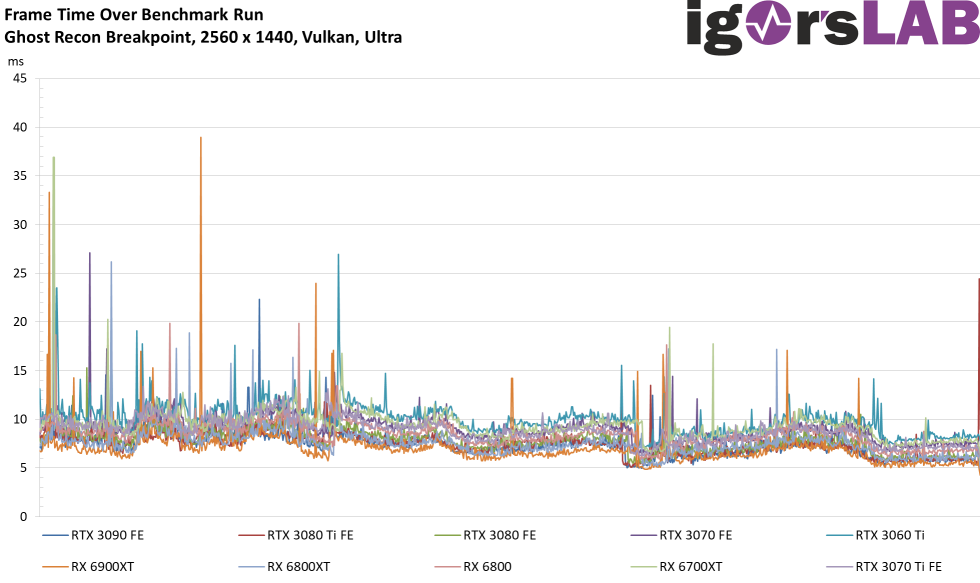
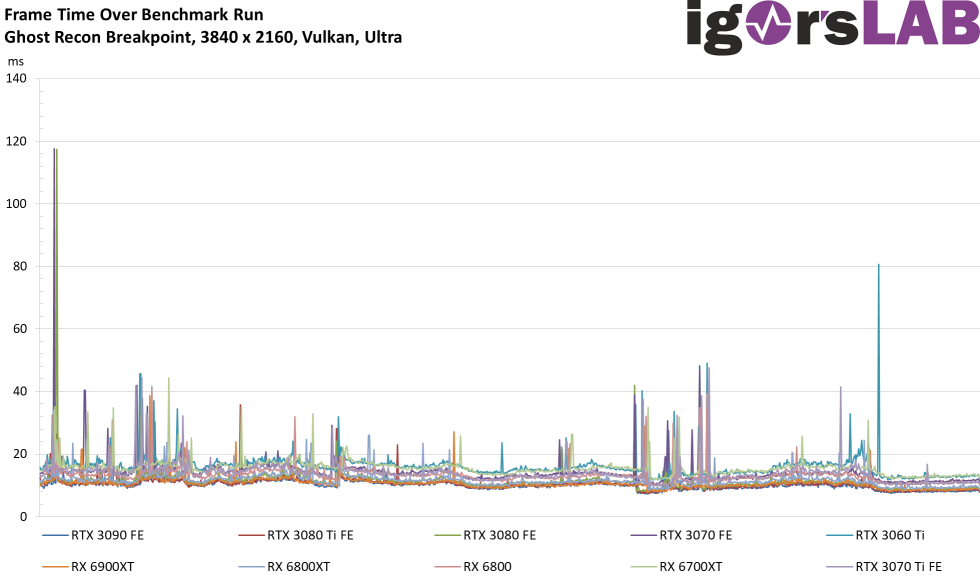
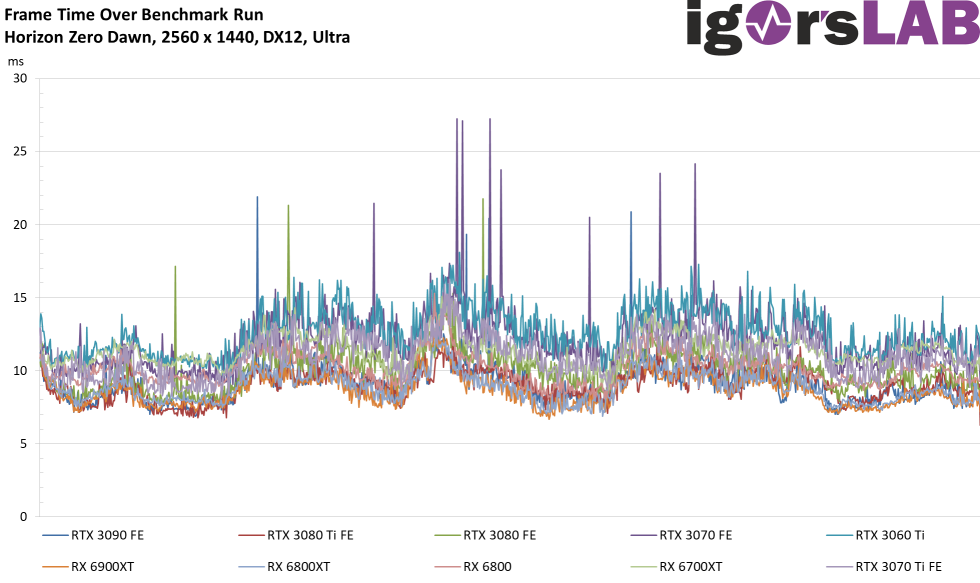
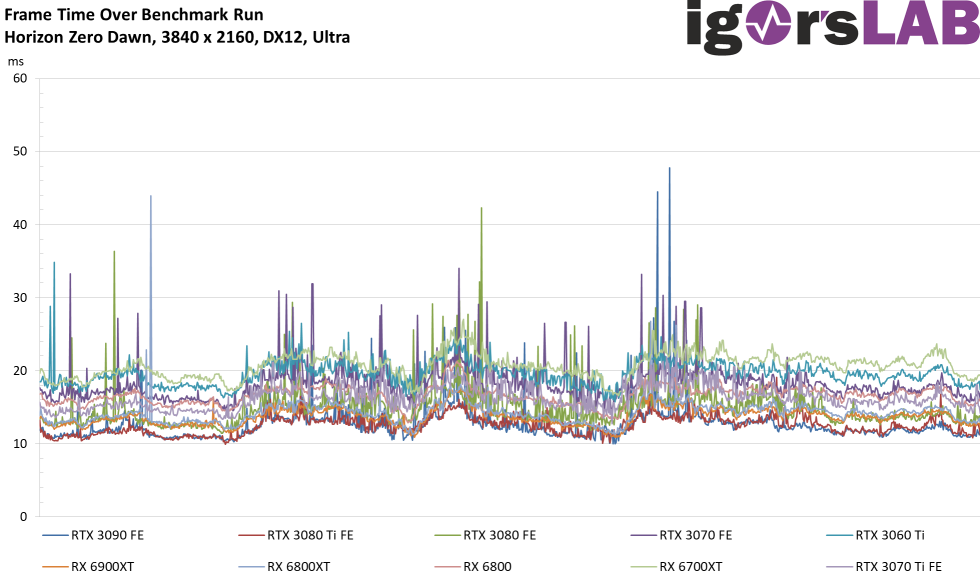
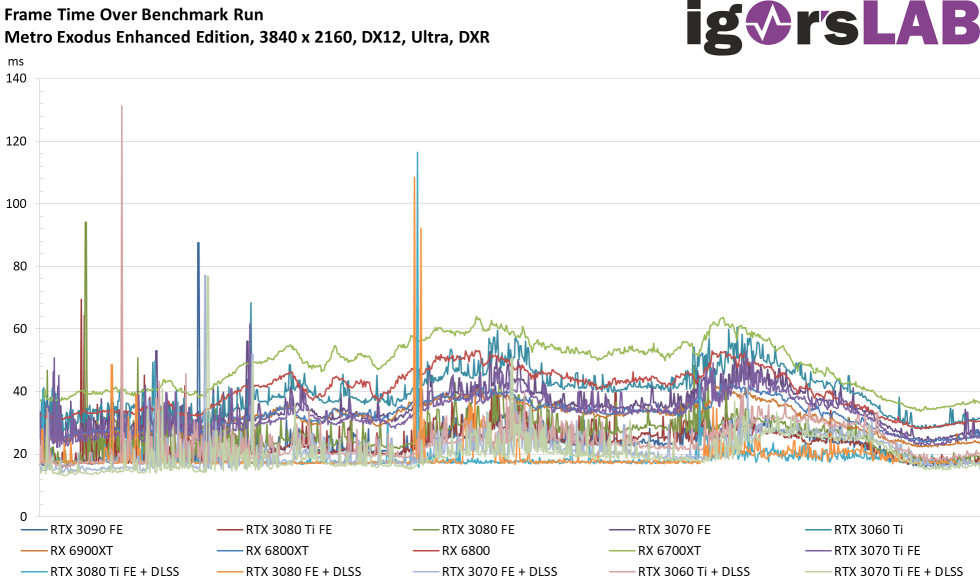
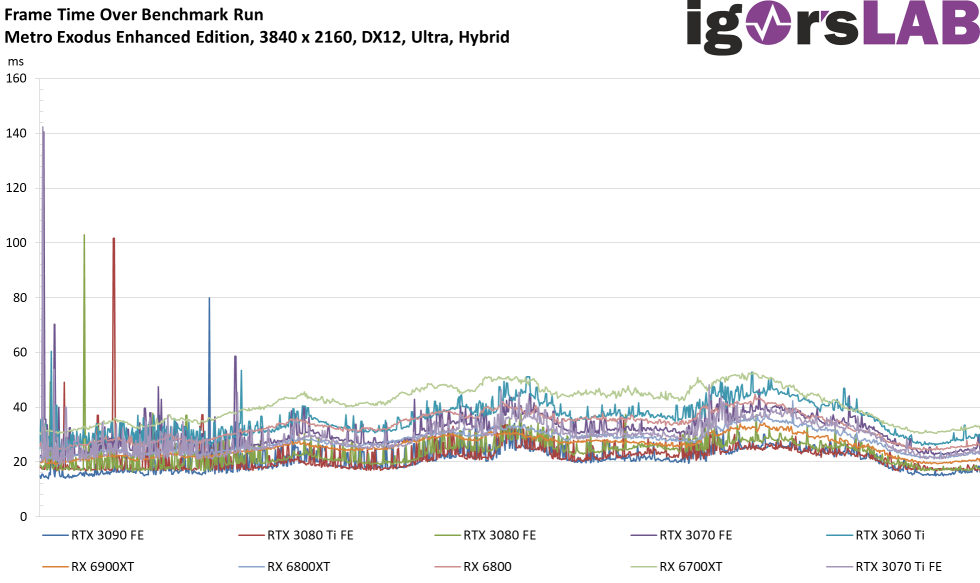
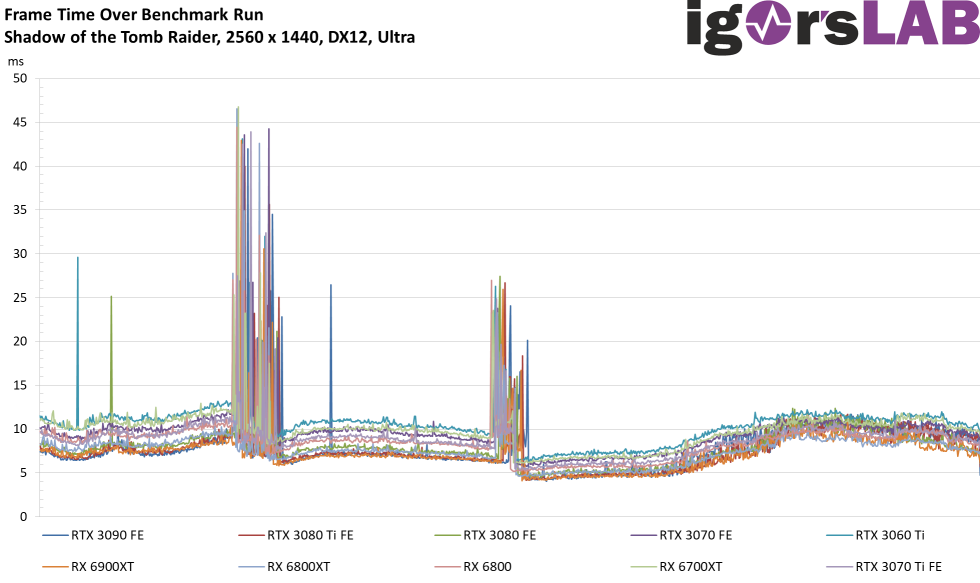
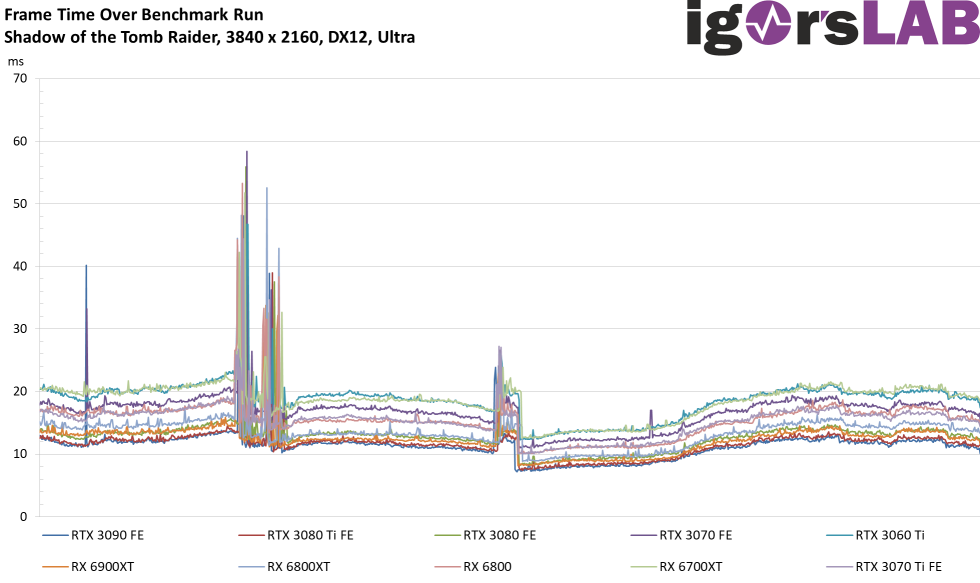
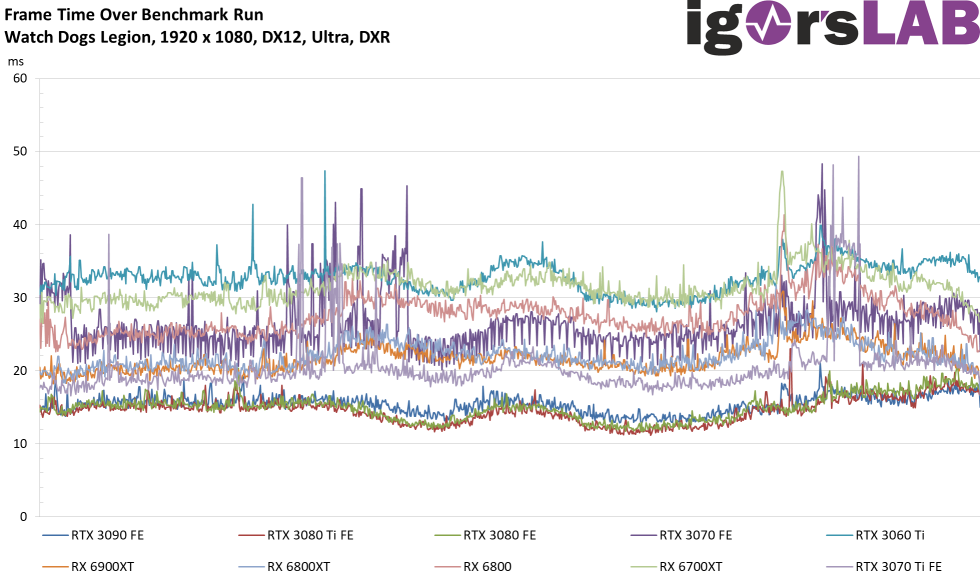
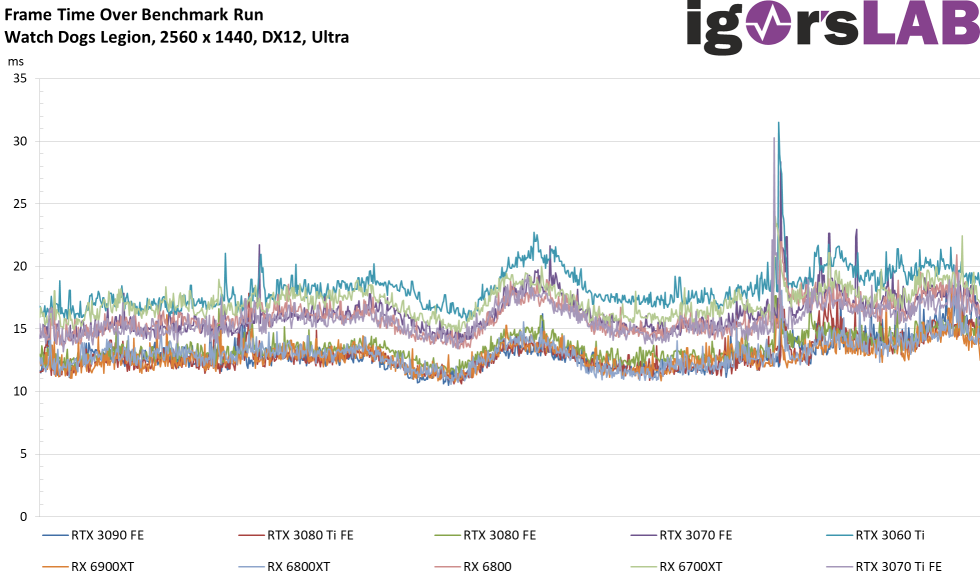
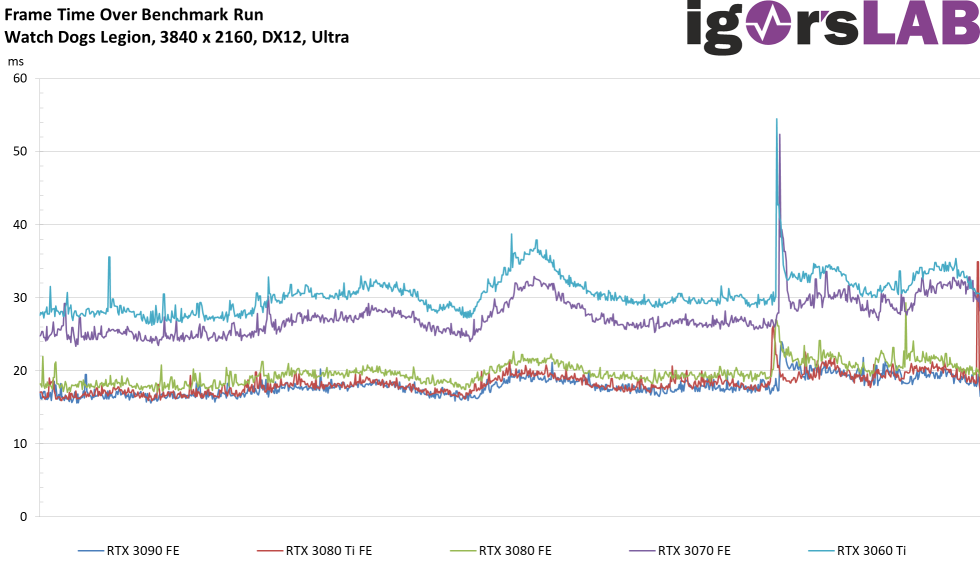
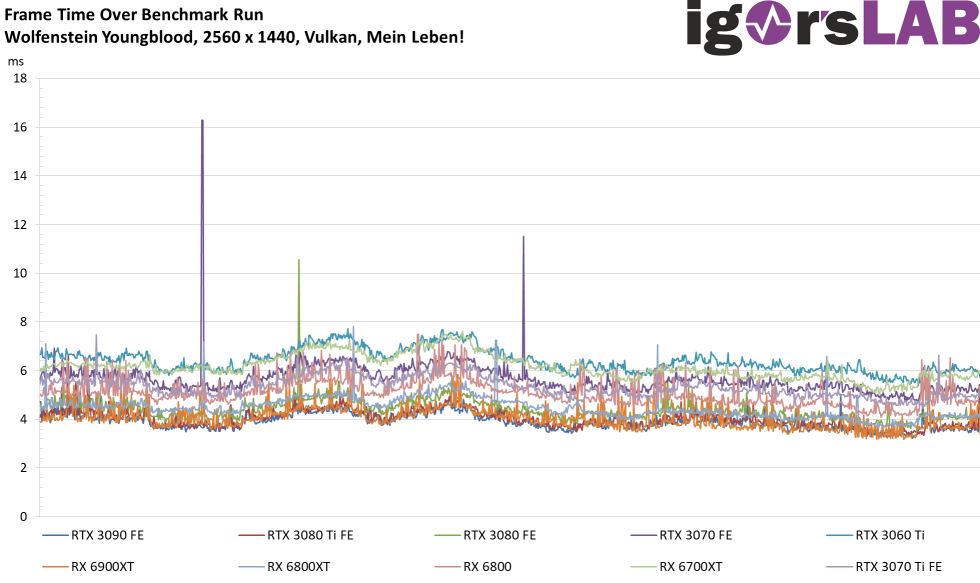
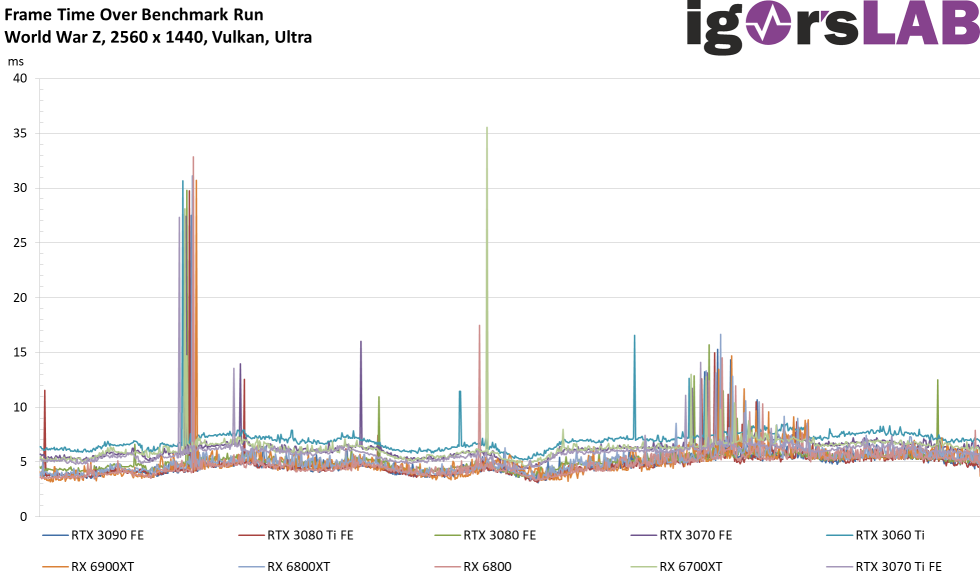
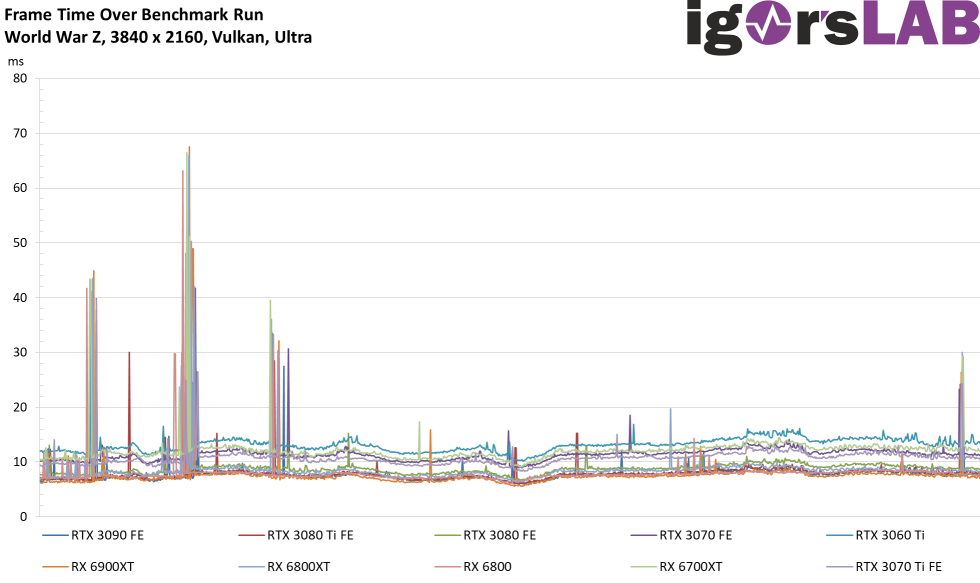
Frame times of all games and resolutions as curves


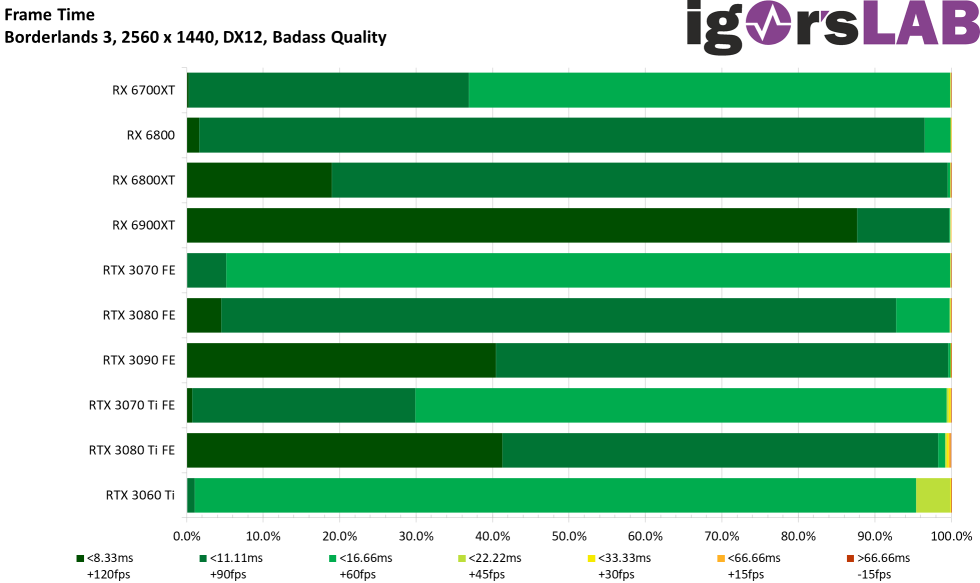
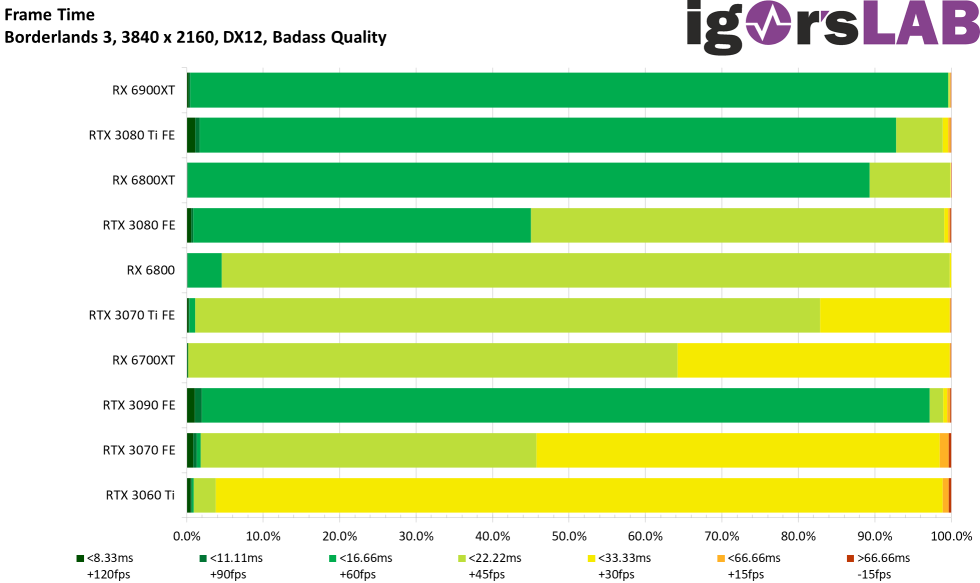
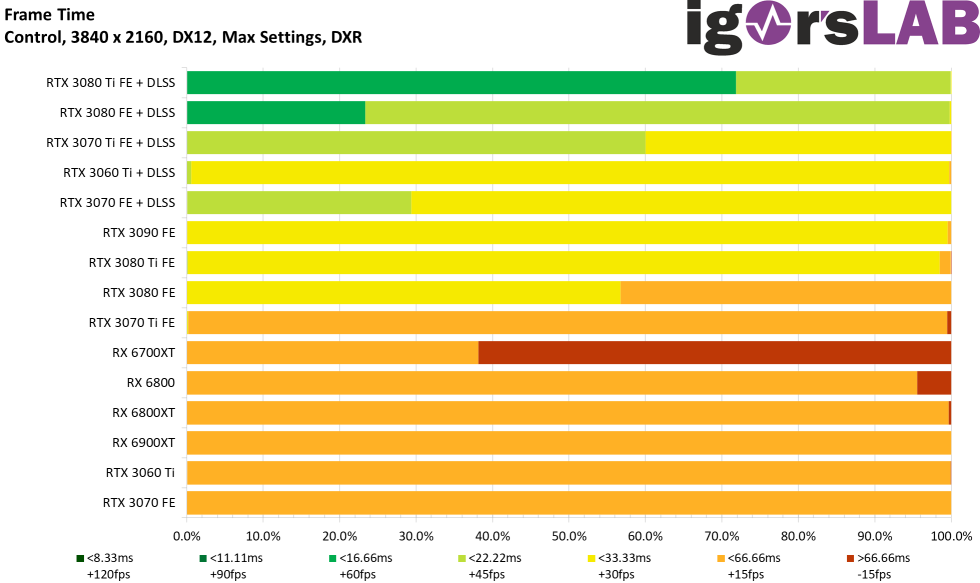
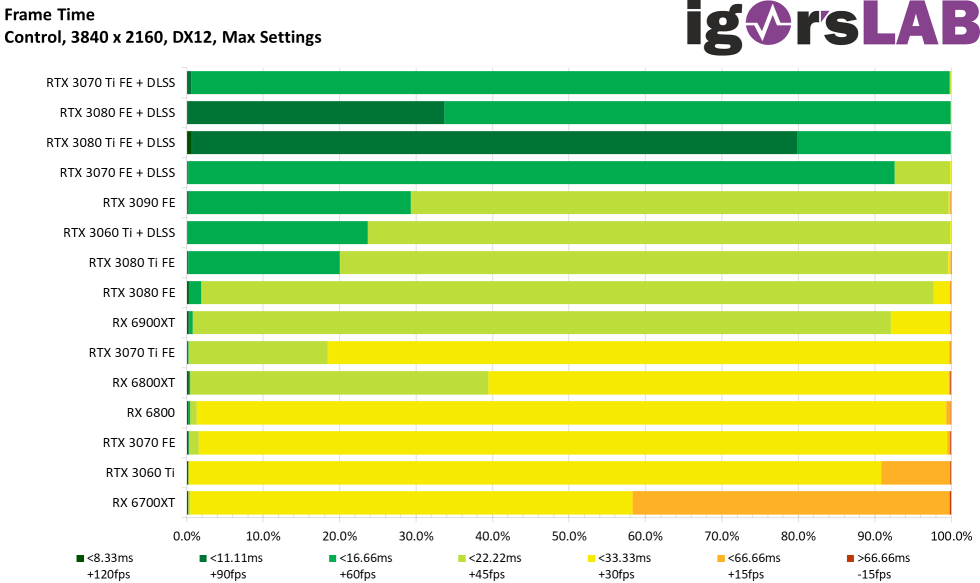
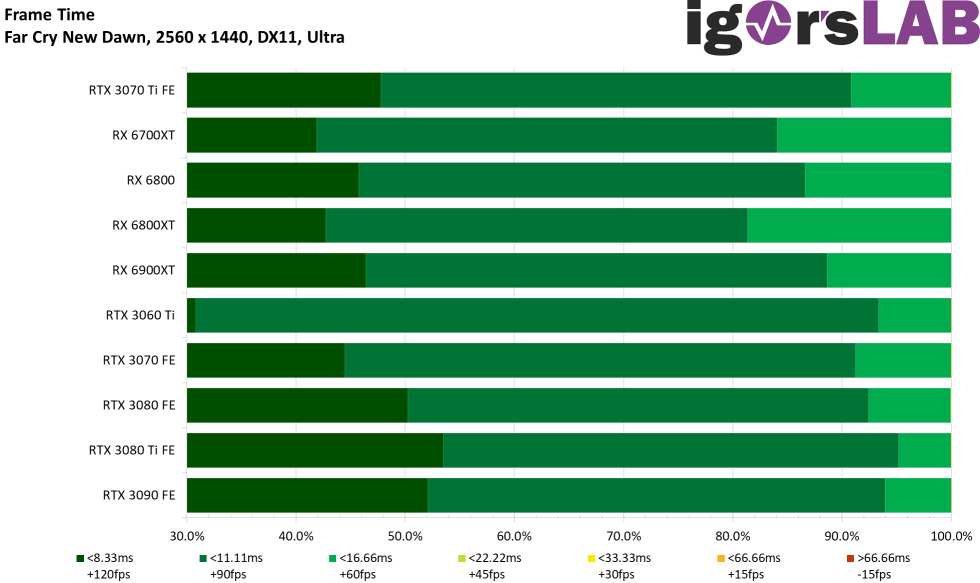
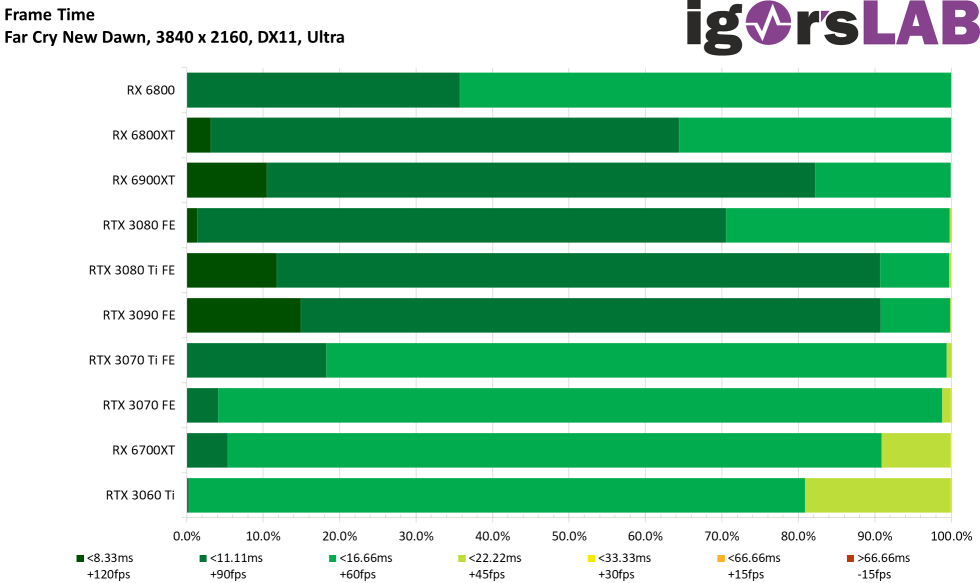
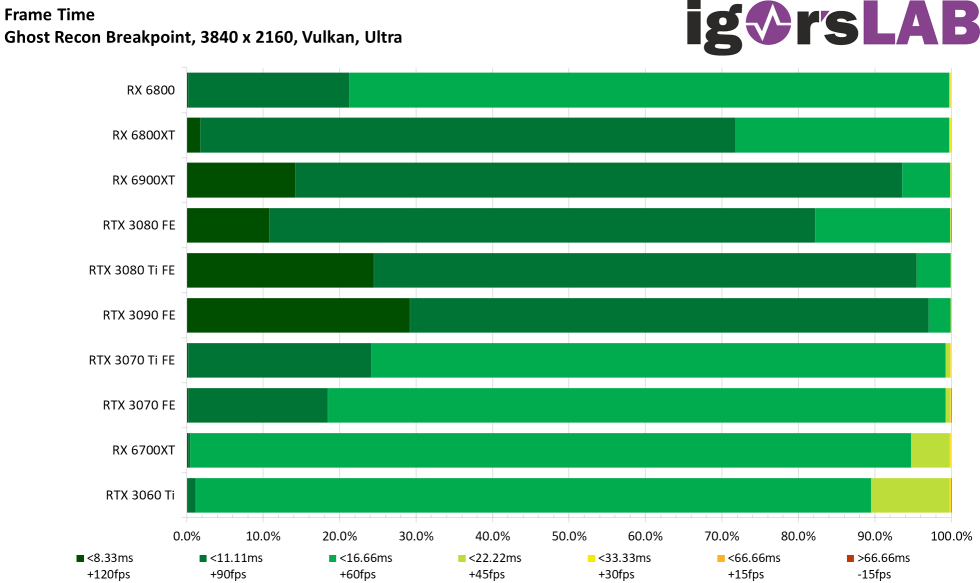
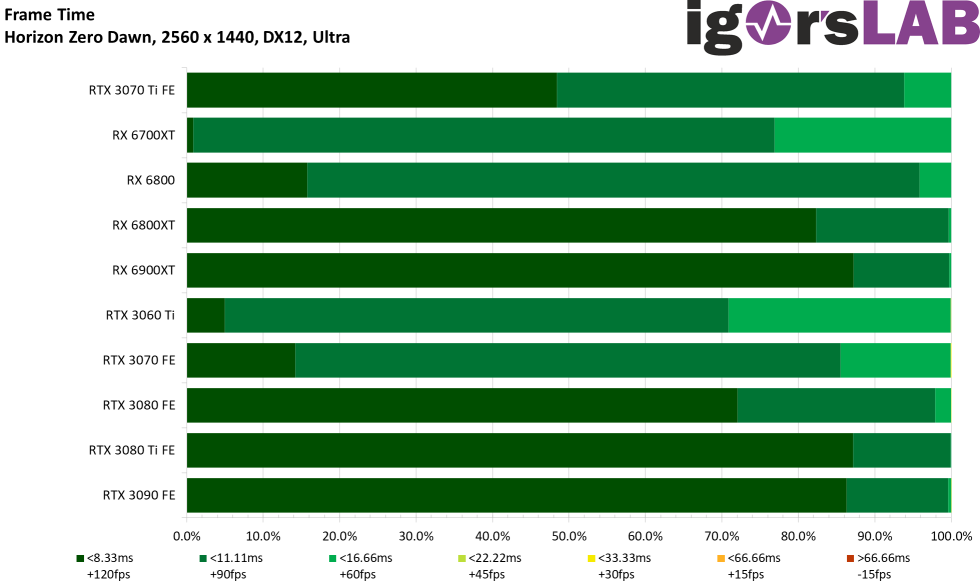
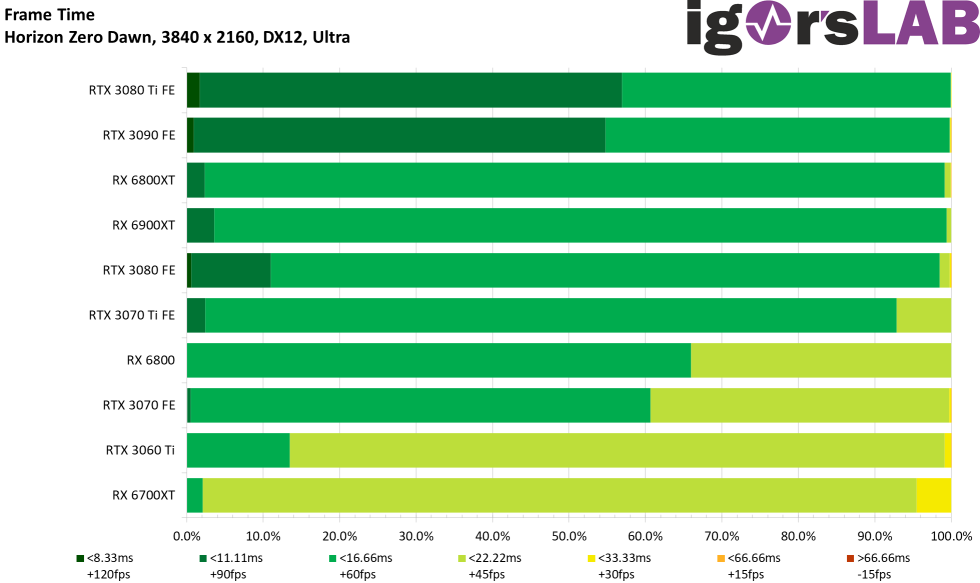
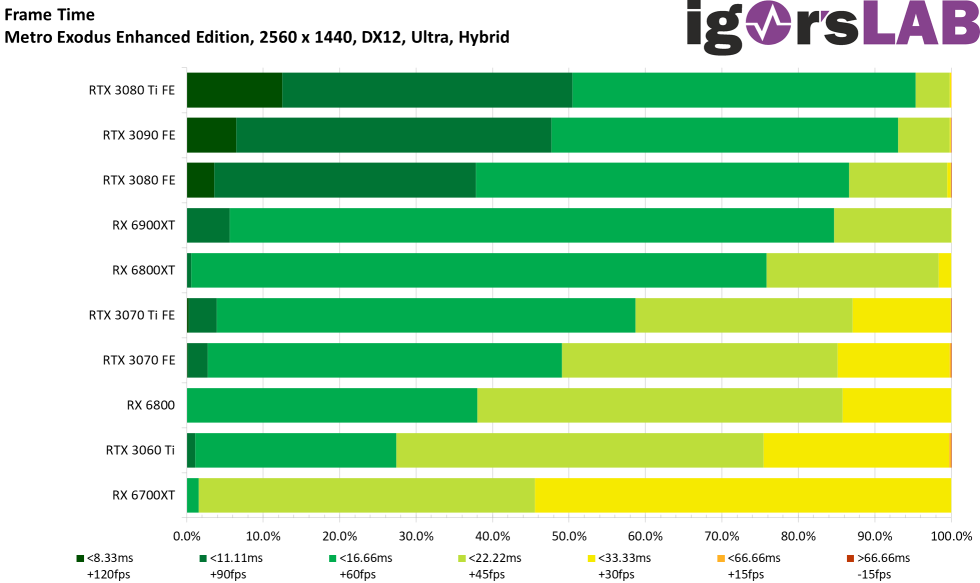
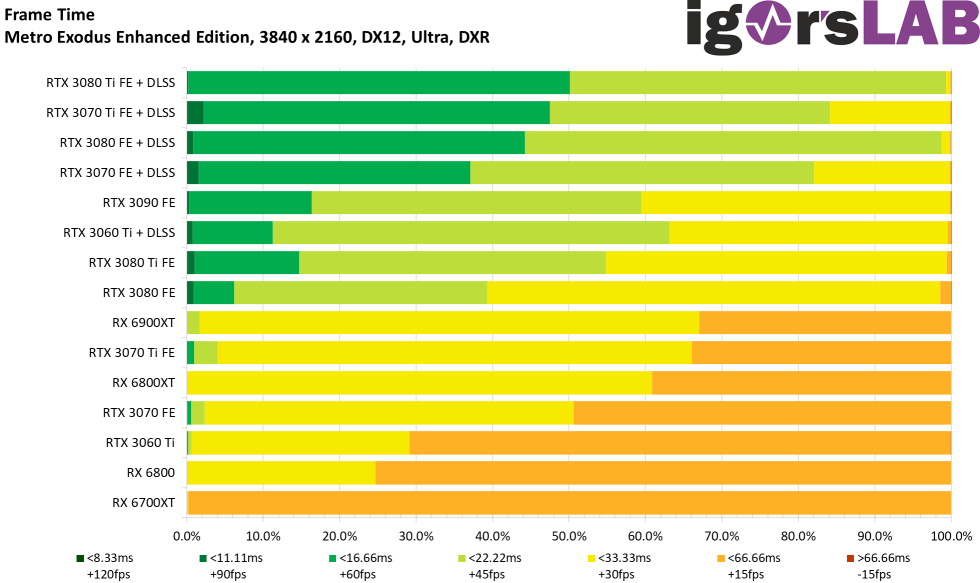
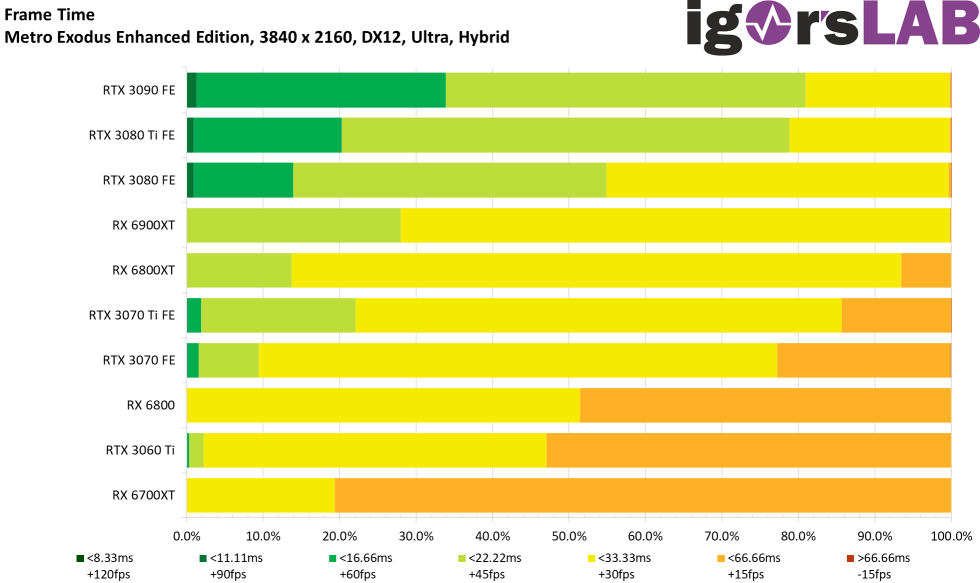
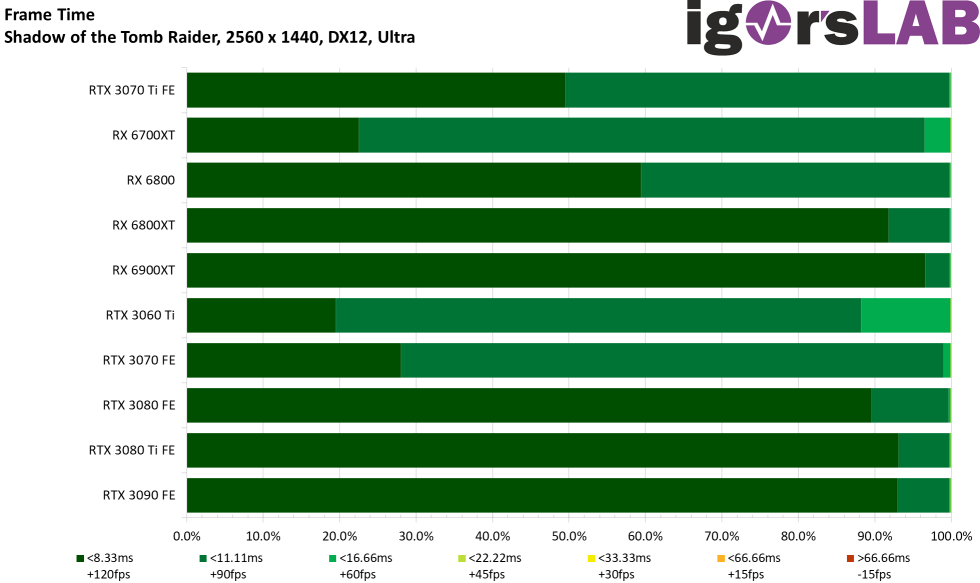
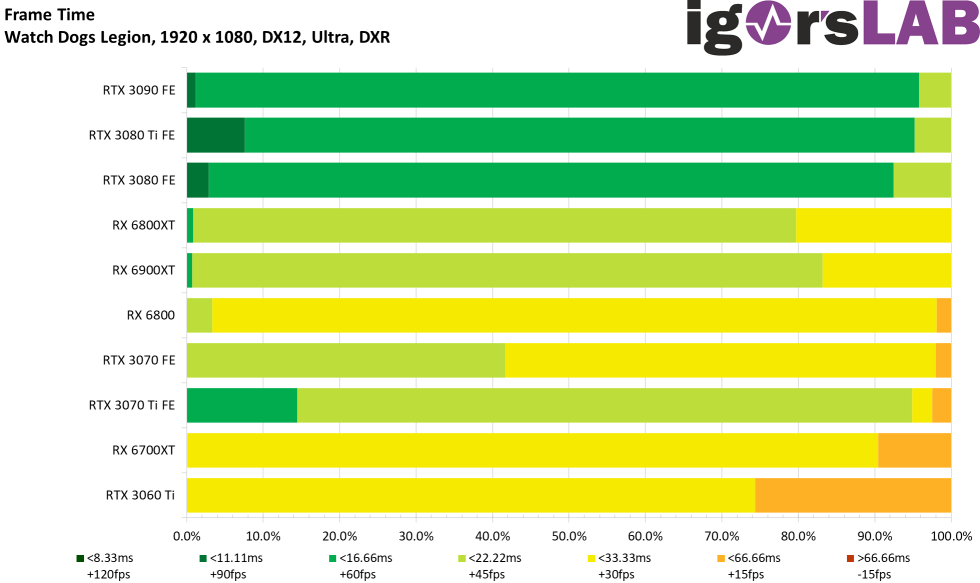
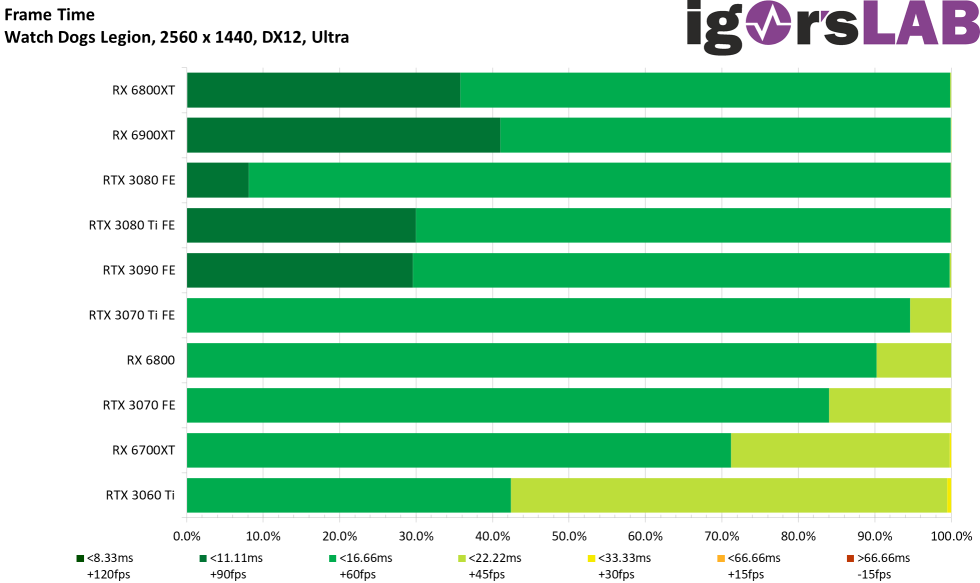
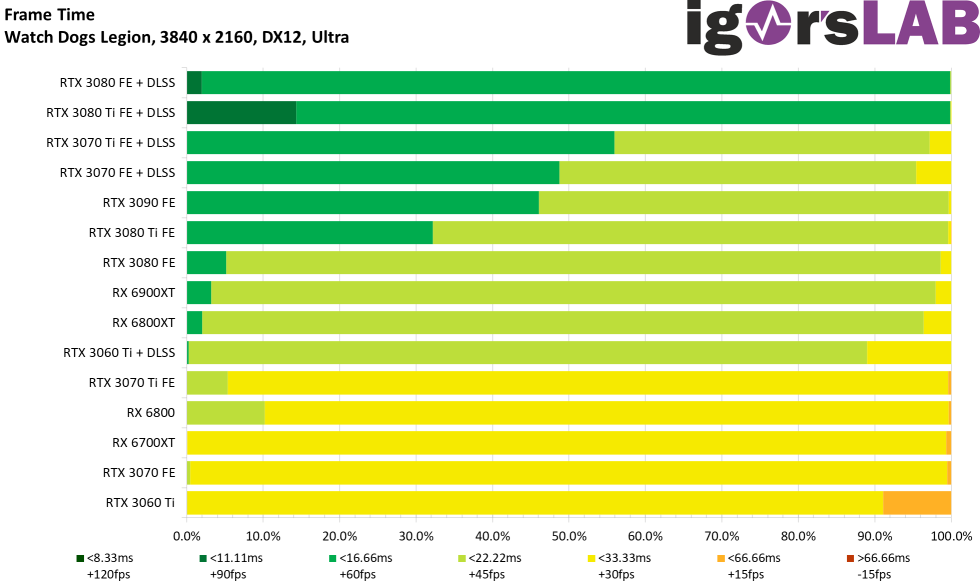
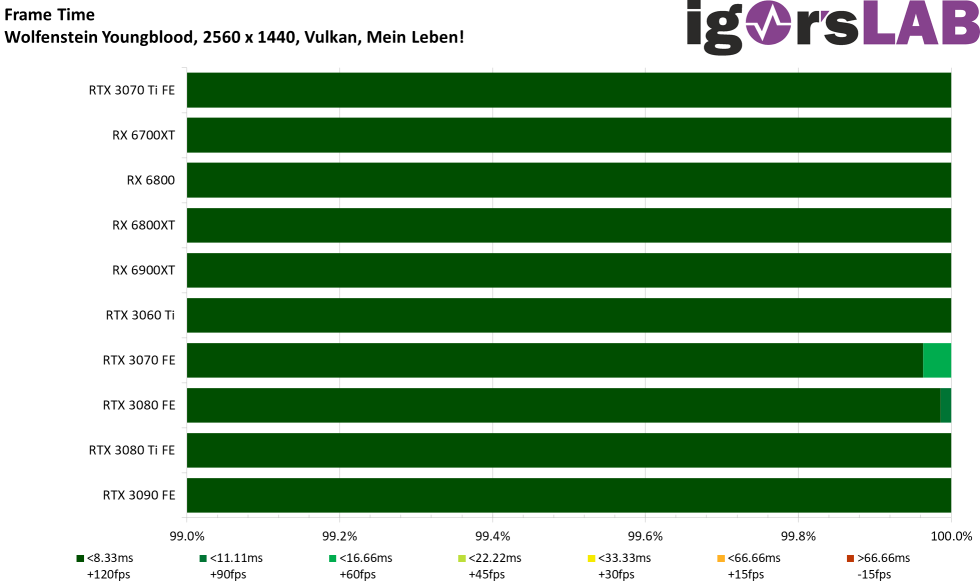
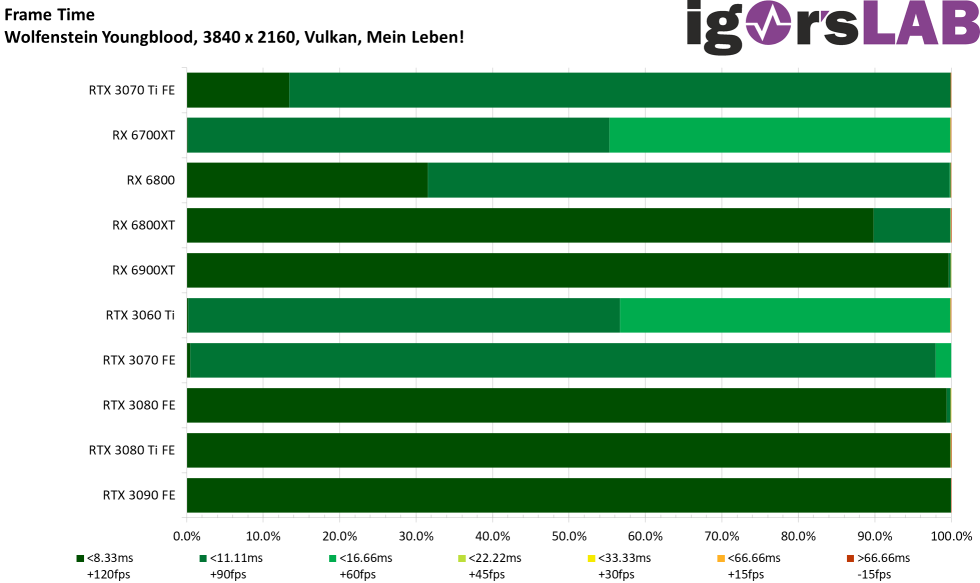
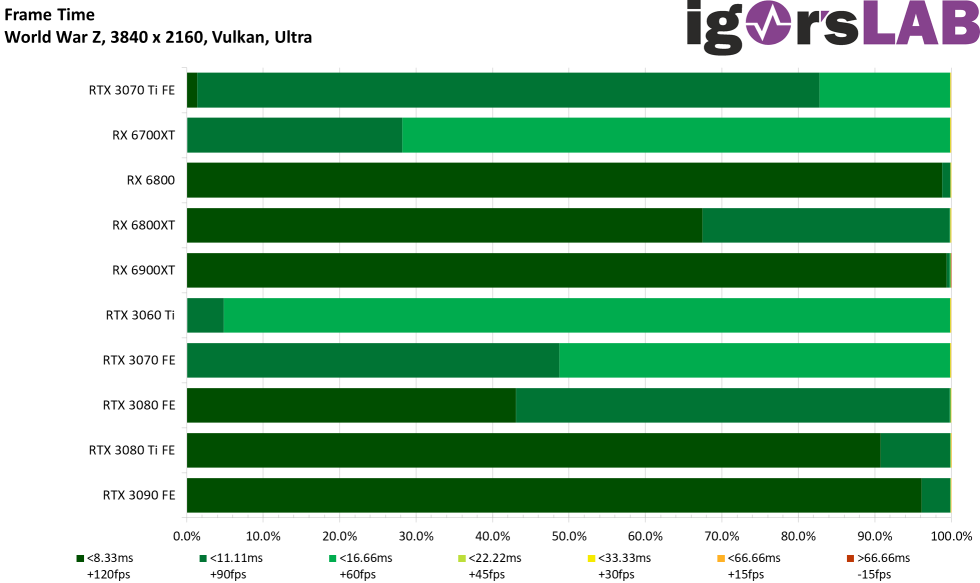
Frame times of all games and resolutions as bars
And because that still doesn’t say much, I’ve now used the much clearer bar chart for each game, which contrasts and captures what the eye can’t see with pure curves.


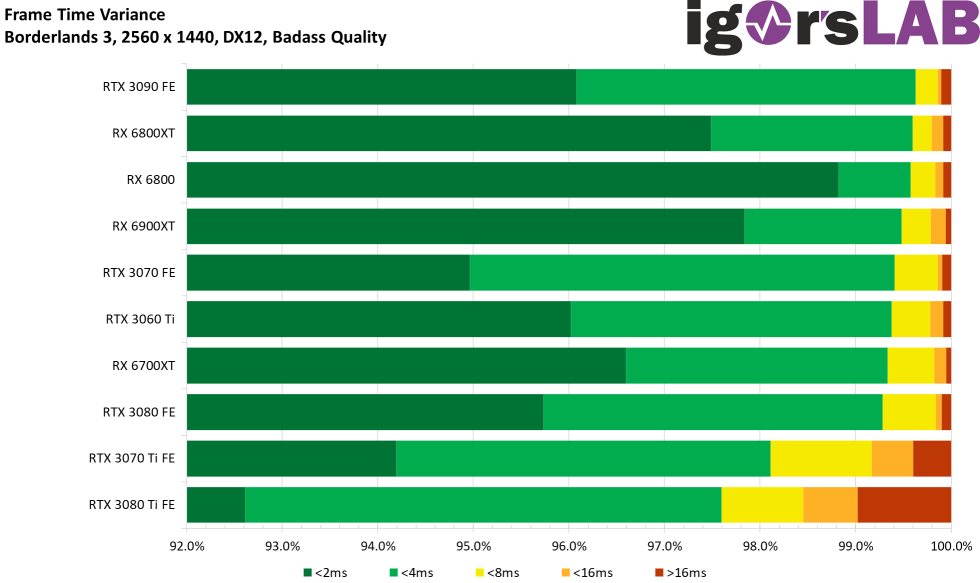
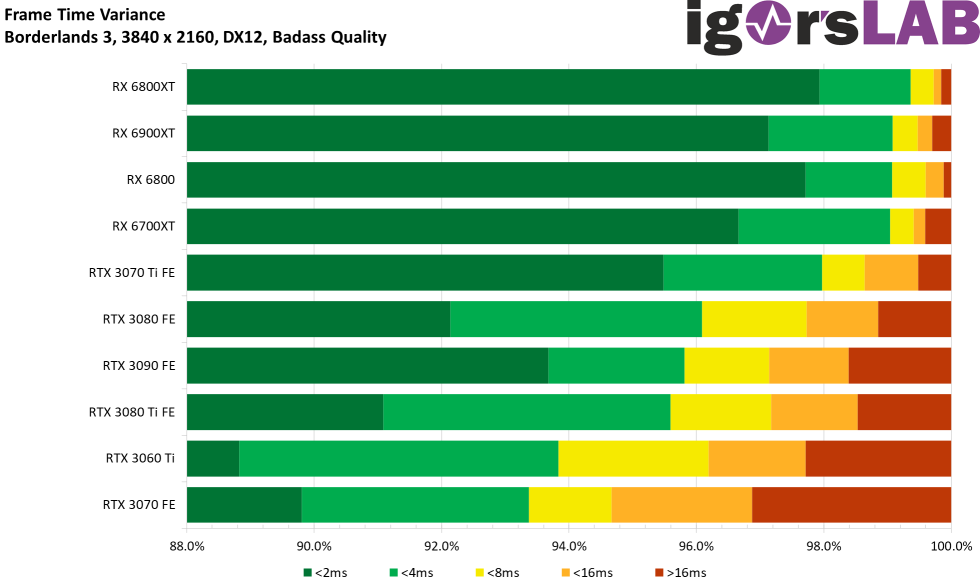
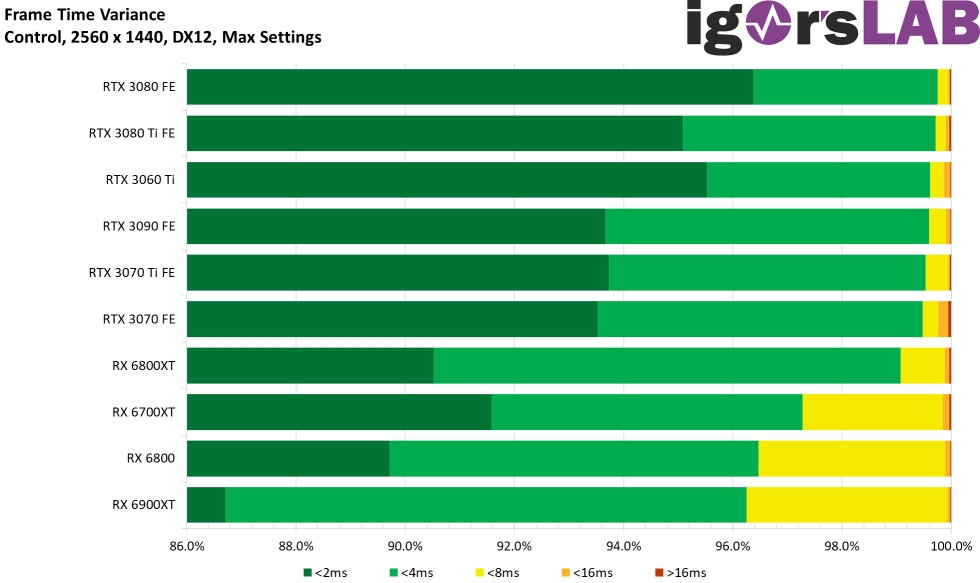
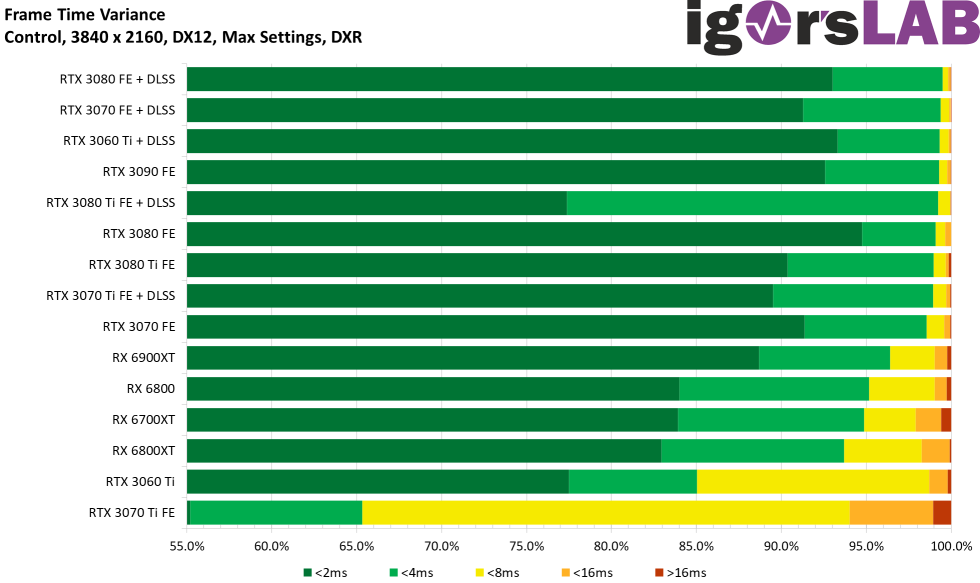
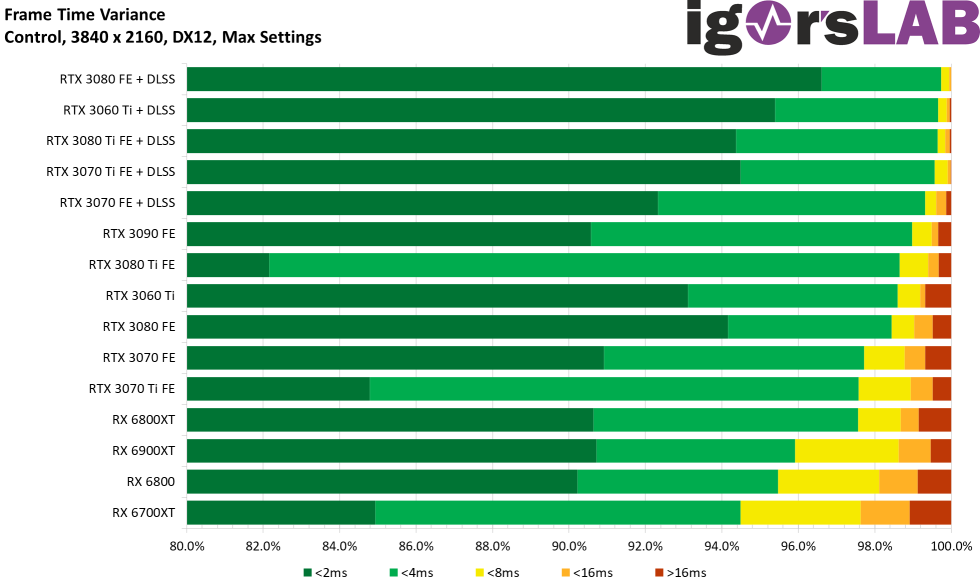
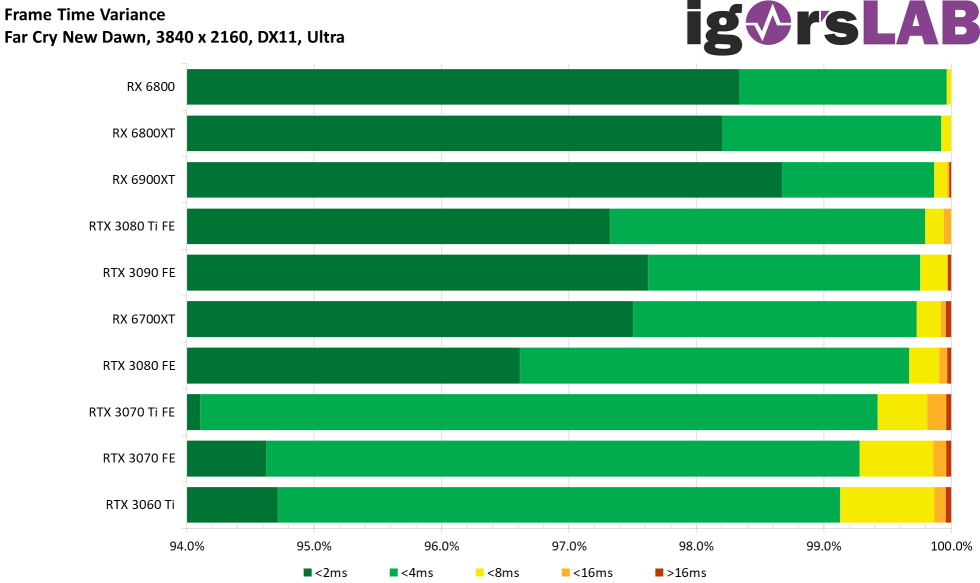
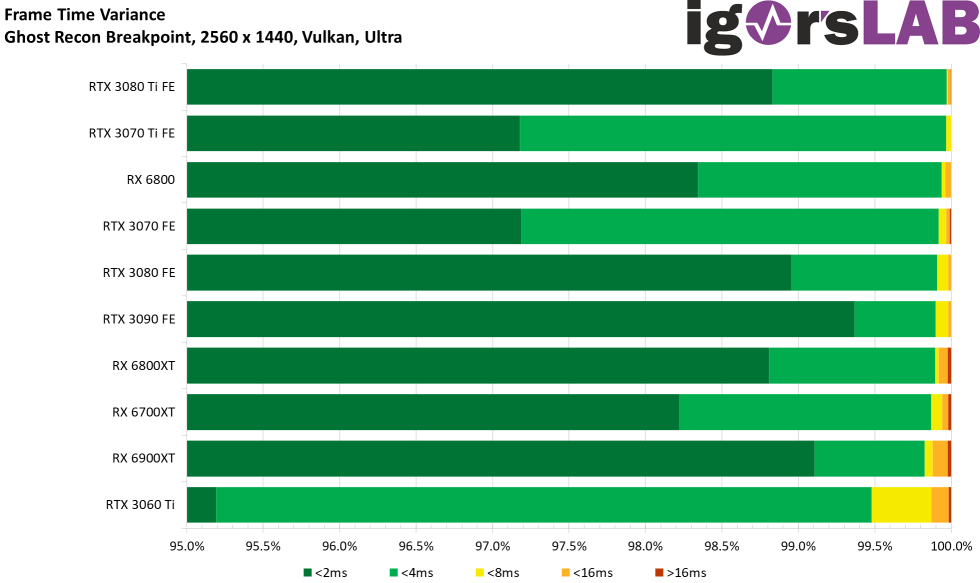
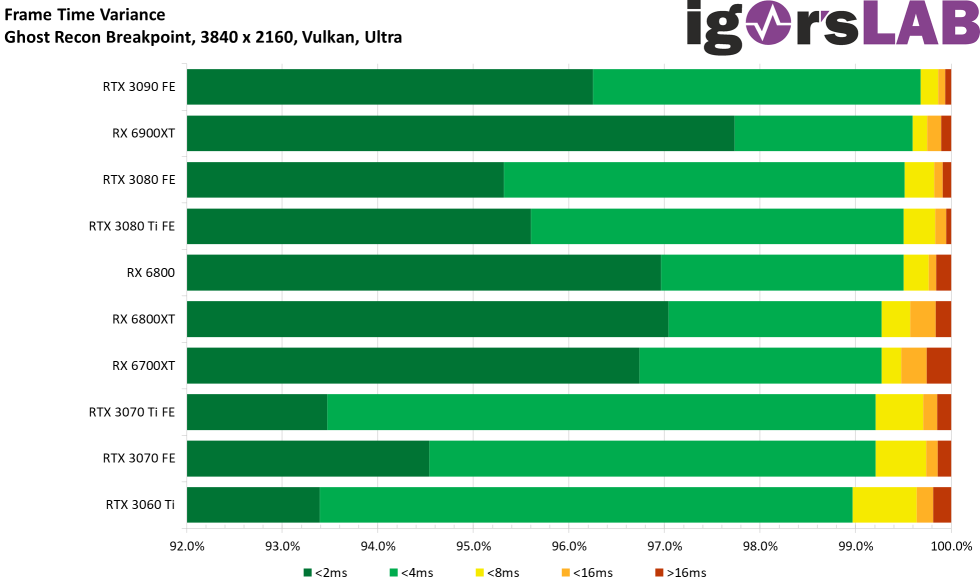
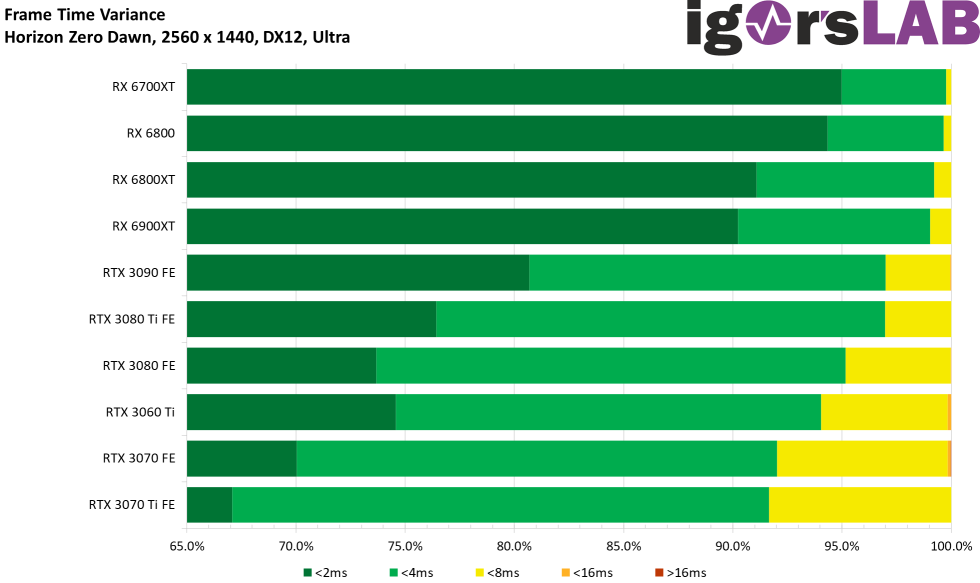
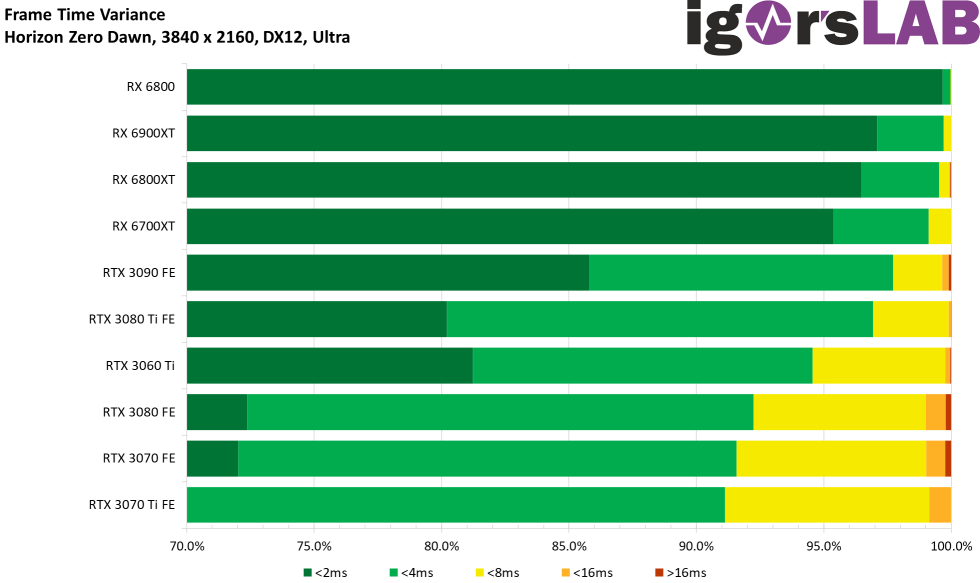
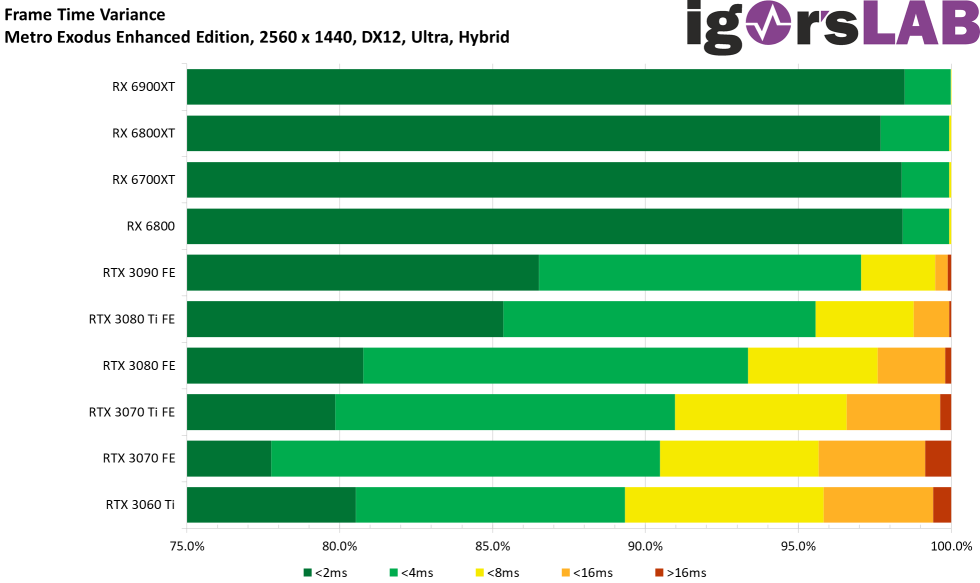
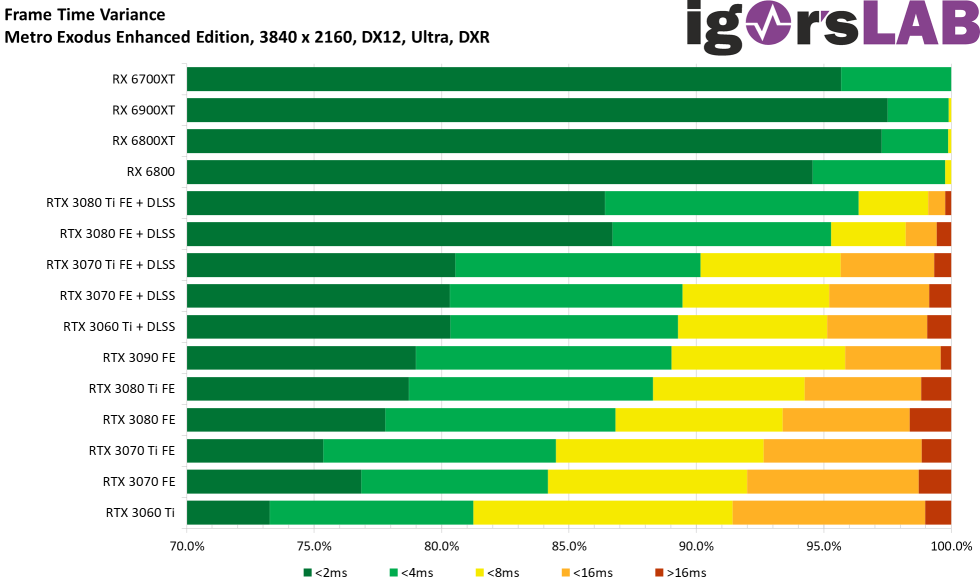
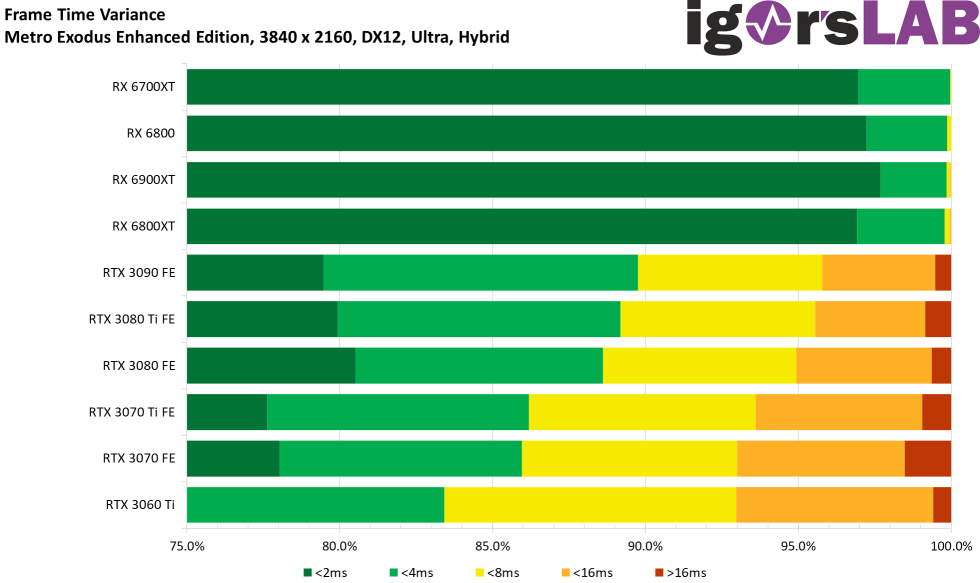
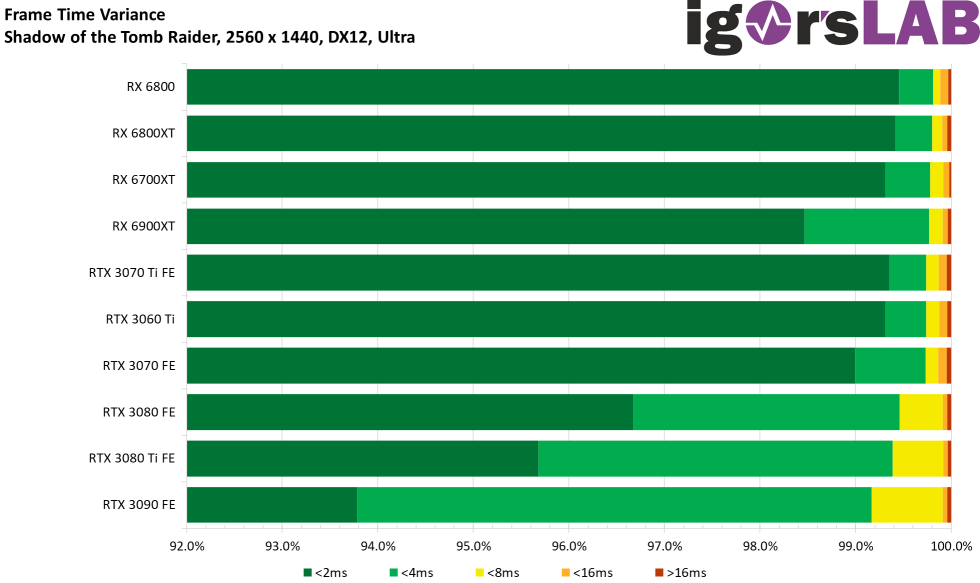
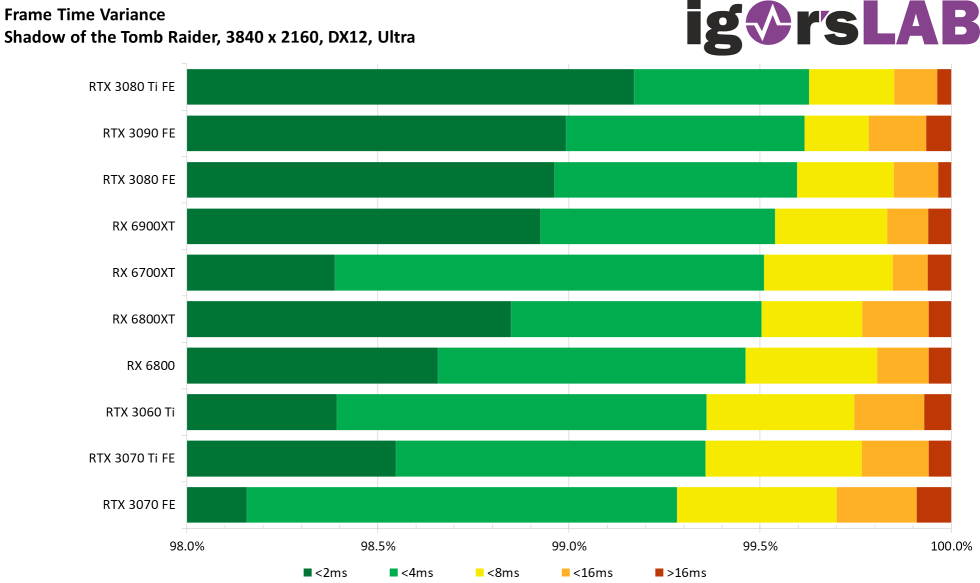
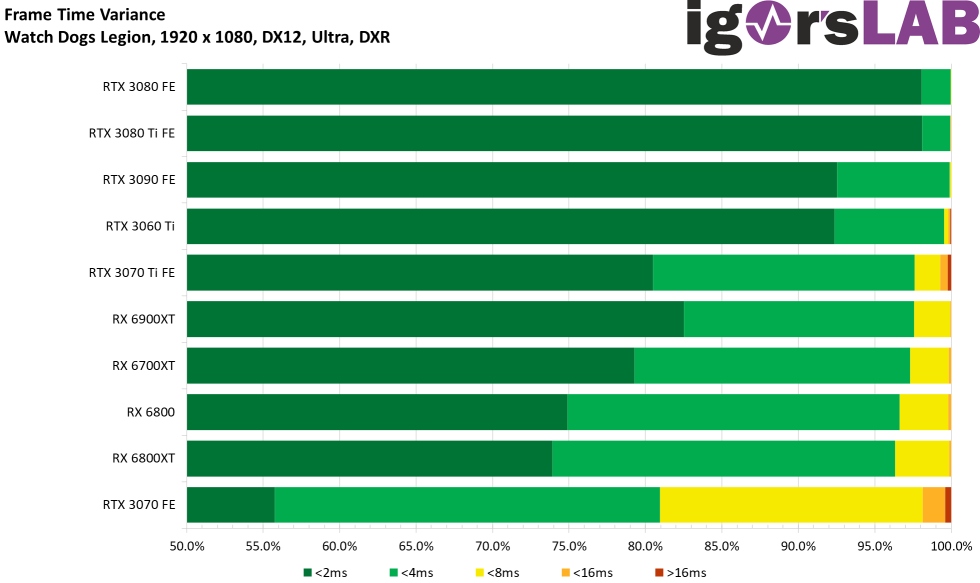
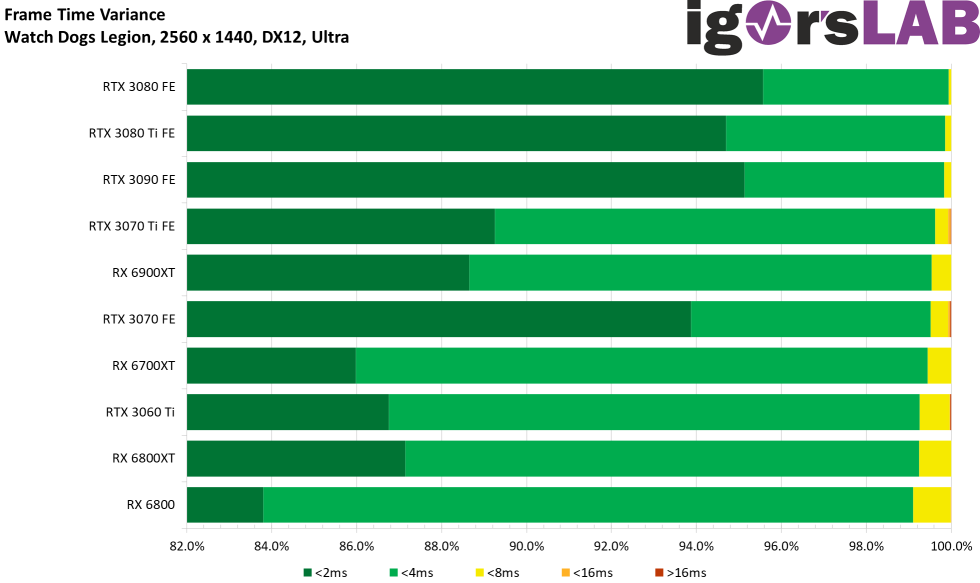
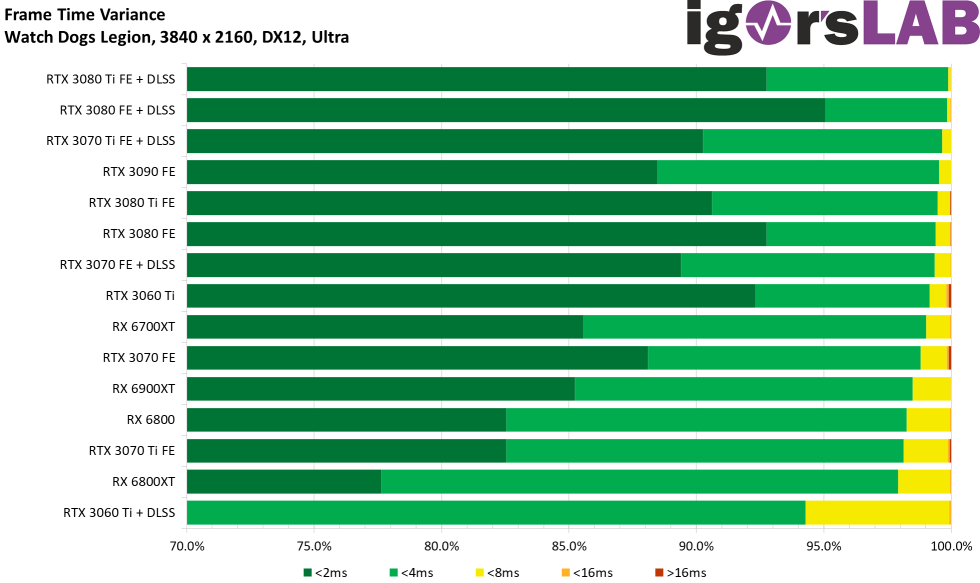
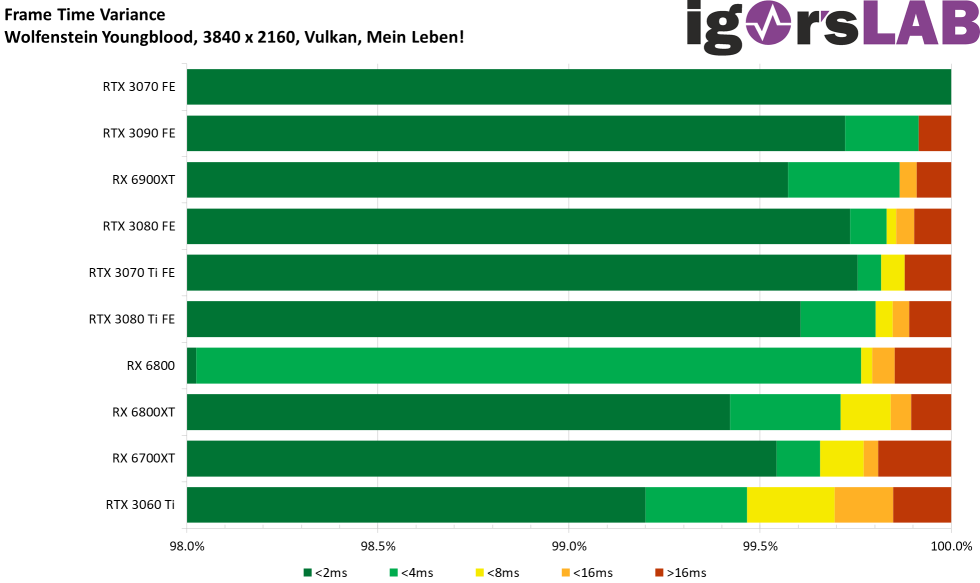
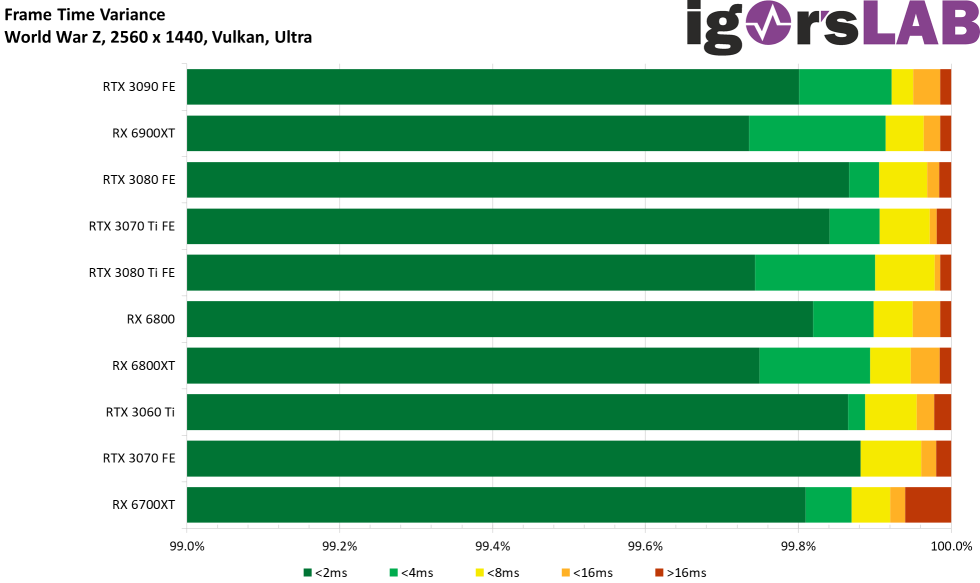
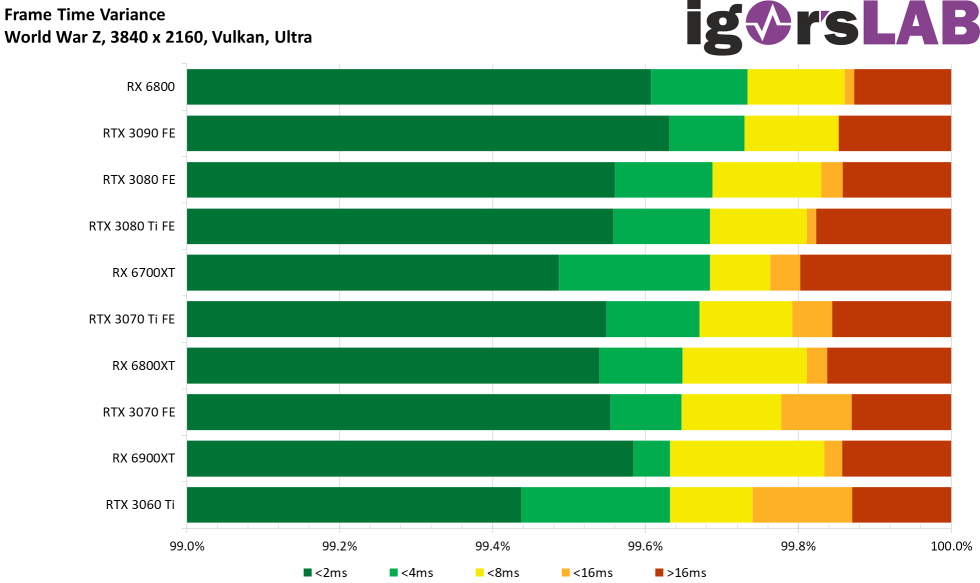
Frame time variances of all games and resolutions as bars
And since it is well known that the eye registers more than one would like, we also have to talk about variances once again. 100 FPS doesn’t have to mean 100 FPS if instead of 100 equally fast rendered frames you see 50 very fast rendered frames, 40 fast rendered frames and 10 lame frames. That’s a rather non-round story called variance, which is the difference in time that two consecutive frames have. This, in turn, must be represented as a bar chart.


- 1 - Introduction, Unboxing and Technical Data
- 2 - Test System and Methods
- 3 - Teardown, PCB Analysis and Cooler
- 4 - Gaming Performance WQHD + FHD/RTX
- 5 - Gaming Performance Ultra-HD/DLSS
- 6 - Detailled Metrics and Graphics for all Games
- 7 - Frame Times vs. Power Draw
- 8 - Power Draw and Efficiency for all single Games
- 9 - Power Consumption Summary and Hi-Res Measuring
- 10 - PEG, Transients and PSU Recommendation
- 11 - Temperatures and Thermal Imaging
- 12 - Noise, Frequency Analysis and Audio-Sample
- 13 - Summary and Conclusion


15 Antworten
Kommentar
Lade neue Kommentare
Veteran
Veteran
Veteran
Mitglied
Urgestein
Mitglied
Veteran
Veteran
Veteran
Mitglied
Urgestein
Urgestein
Urgestein
Urgestein
Alle Kommentare lesen unter igor´sLAB Community →