


Test system and test preparation
I use the usual suspects such as CrystalDiskMark and Atto to check the theoretical data from the specifications. Due to previous workstation tests, these are no longer brand-new SSDs, but everyday goods that have also already been worn down quite a bit. Let’s see what remains of the theory in everyday life after the wear and tear. The SSDs to be tested are located in the first PCIe 5.0 NVMe slot of the motherboard and are not used as system disks.
I also use AJA as an everyday test to simulate the encoding of larger Ultra HD video streams and the SPECwpc storage test, which contains a lot of real applications and it will be interesting to see what performance remains with the large workloads. However, I picked out the applications with the biggest differences and loads as examples. I have also summarized the individual components of the test system in a table:
| Test System and Equipment |
|
|---|---|
| Hardware: |
AMD Ryzen 9 7950X |
| Cooling: |
Alphacool Eisblock XPX Pro Alphacool Eiswolf (modified) |
| Case: |
Raijintek Paean |
| Monitor: | BenQ PD3220U |
| Thermal Imager: |
1x Optris PI640 2x Xi400 Thermal Imagers Pix Connect Software Type K Class 1 thermal sensors (up to 4 channels) |
| OS: | Windows 11 Pro (all updates, current certified drivers) |
Sequential performance of the used SSDs
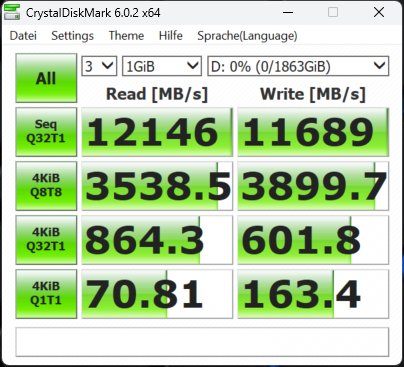
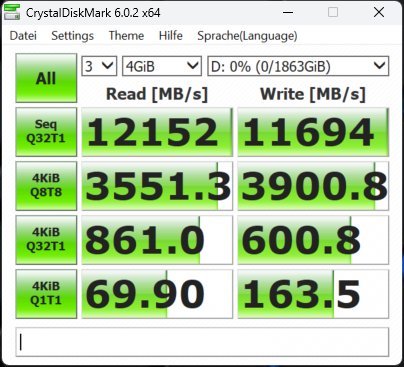
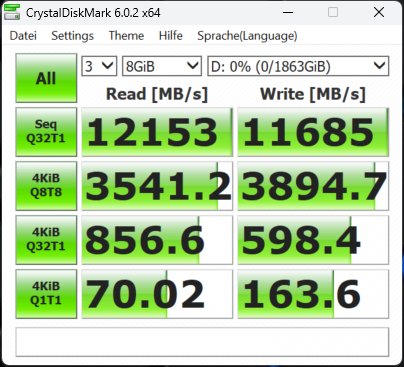
The synthetics are a good way to really run out the big numbers. We will see later how well this works in reality with the real application benchmarks. That’s why I’m starting with CrystalDiskMark and four different file sizes. The SSDs were no longer new at the time of testing (I always do these tests at the end for certain reasons) and I had already had fill levels of more than 50% before deleting the data several times.
This certainly also explains the fact that the maximum values are slightly missed when writing, but the figures are still impressive. Hence the wording with the “up to”. If we now compare the MSI SPATIUM M580 and the M570 Pro, we can see the progress that has already been announced (despite the different CDM version). MSI advertises the 4TB version with 14100 MB/s for reading, which I achieve pretty much exactly on my AMD test system. The same applies to writing.
| MSI SPATIUM M580 Frozr 4 TB |
MSI SPATIUM M570 Pro 2TB |
 |
 |
|
|
 |
 |
 |
 |
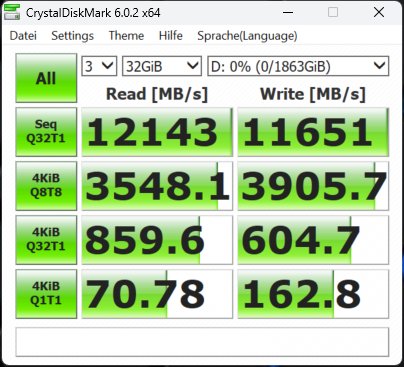 |

You can see very clearly that the dynamic pSLC does exactly what it should, mind you with an empty (albeit not virgin) SSD. The nice thing about the 4 TB SSD is that there is plenty of space and it is therefore better never to fill it more than 2/3 full with data. A higher load does not affect reading, but the dynamic SLC will certainly reach its limits when writing. And if you do it over and over again, it will eventually no longer be possible to switch the memory modules between the two methods.
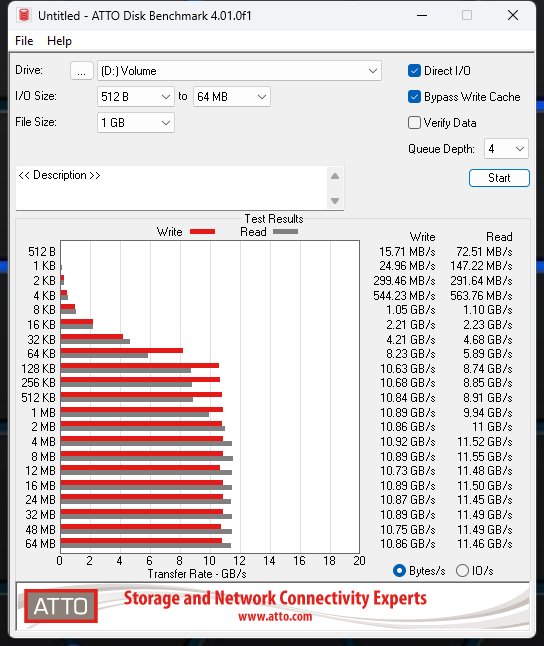
ATTO works in a very similar way, although I only work with two sizes here, which ultimately results in the same thing. The limit of 14000 MB/s for reading is missed, but it is still enough for an impressive result.
| MSI SPATIUM M580 Frozr 4TB |
MSI SPATIUM M570 Pro 2TB |
 |
 |
 |
 |
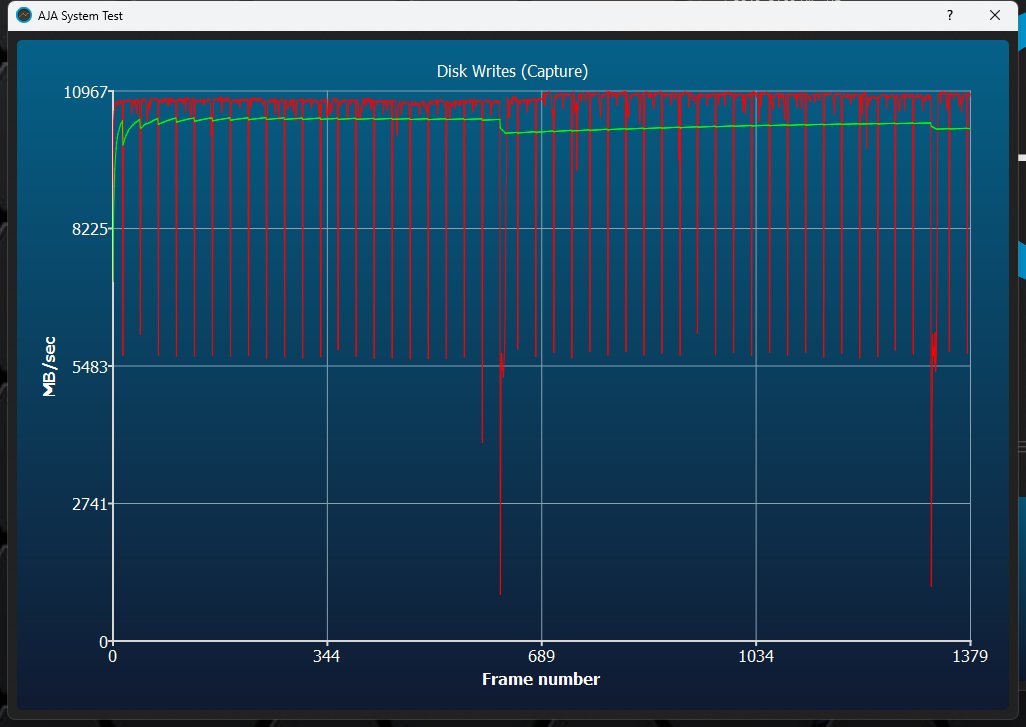
But what happens when you stream a video? The industry uses the AJA benchmark for this, which is effectively an interface between synthetic benchmarks and practical applications. The drop in the write rate differs significantly, the older M570 Pro 2TB “pumps” a little less and even shows the more constant image.
| MSI SPATIUM M580 Frozr 4TB | MSI SPATIUM M570 Pro 2TB |
 |
 |
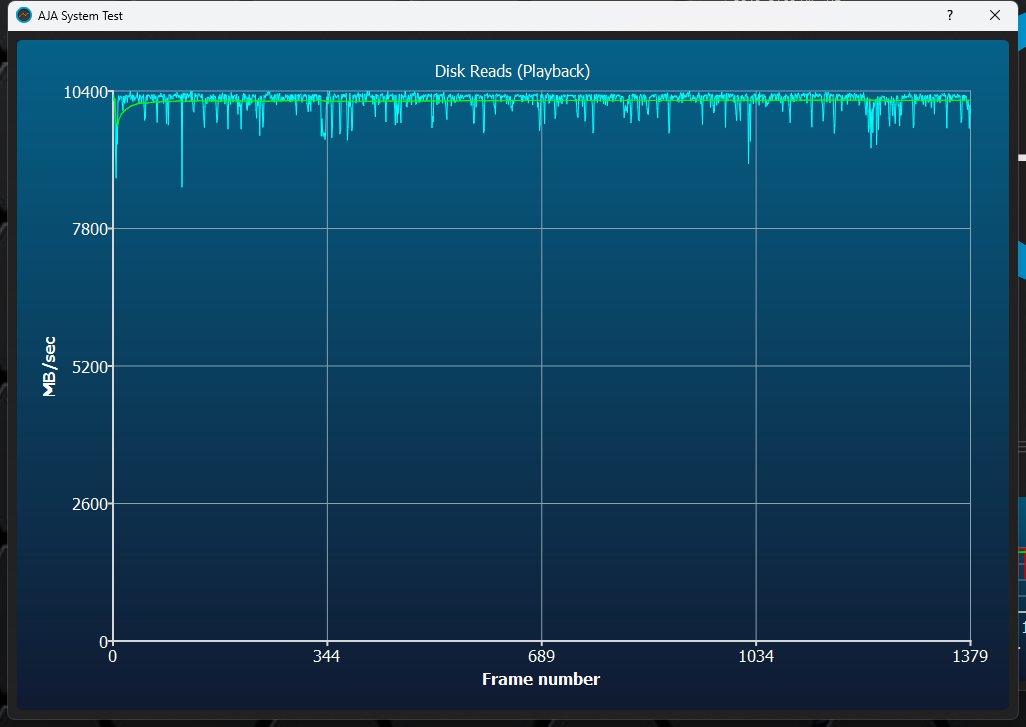
Reading is also quite fast, although the theoretically possible speed is not reached here either. The MSI SPATIUM M580 4TB also has an advantage here. We quickly remember ATTO, because this is also about a 64 GB stream.
| MSI SPATIUM M580 Frozr 4TB | MSI SPATIUM M570 Pro 2TB |
 |
 |
I have attached a detailed AJA protocol for you:
BENCHMARK-TABLE
We can see that the comments made on the previous page about the dynamic pSLC cache and the behavior with larger file blocks are completely correct. Smaller file movements would be even faster if the overhead of the file system is omitted.


35 Antworten
Kommentar
Lade neue Kommentare
Veteran
Mitglied
1
Mitglied
Urgestein
Urgestein
Urgestein
Urgestein
Urgestein
Urgestein
Mitglied
Urgestein
Veteran
Urgestein
Urgestein
Urgestein
Urgestein
Urgestein
Urgestein
Alle Kommentare lesen unter igor´sLAB Community →