


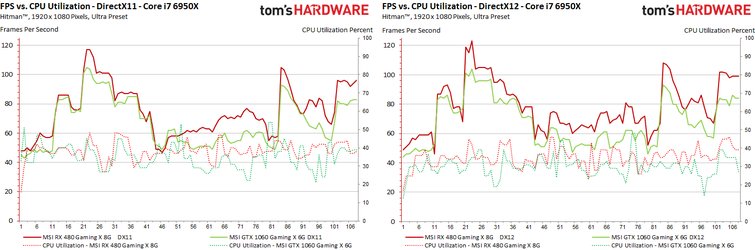
FPS vs. CPU Utilization
A big issue when it comes to recognizing possible bottlenecks and highlighting the advantages or disadvantages of individual rendering paths – if they really exist. First, let's look at the utilization of the stronger CPU: We can see that at no time was there even a partial CPU limit.
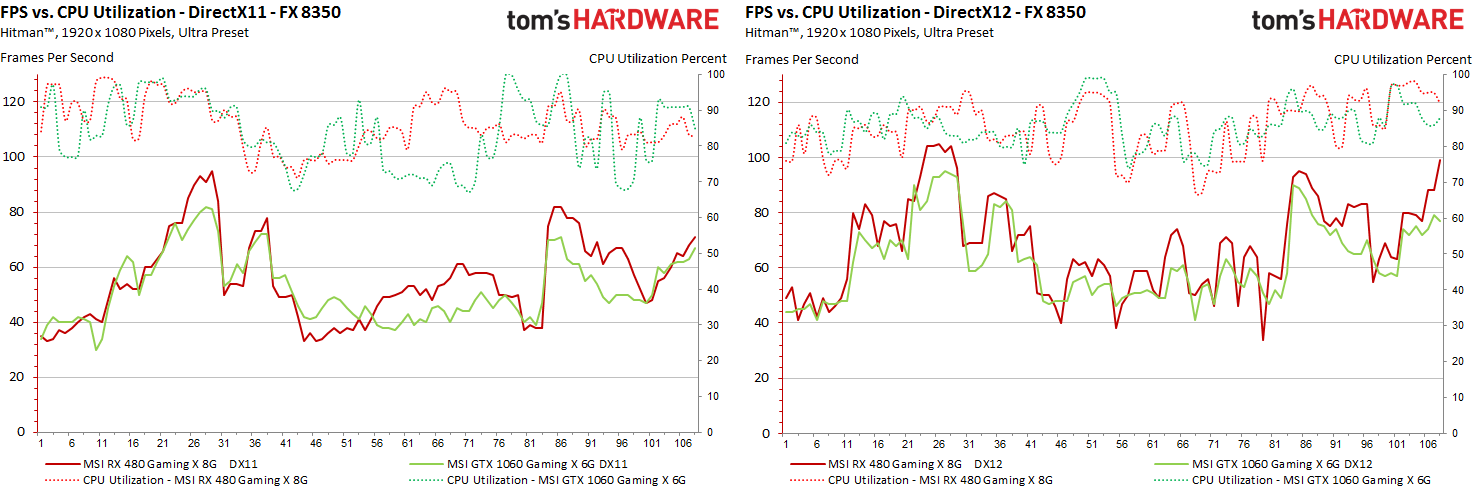
The picture changes abruptly when we switch to the weaker CPU! It is very clear when and where the respective graphics card has entered the CPU limit. In addition, you can see that when using the Radeon RX 480 in DirectX-12 mode, the load decreases significantly, while with the GeForce GTX 1060 you can even see an increase on average:
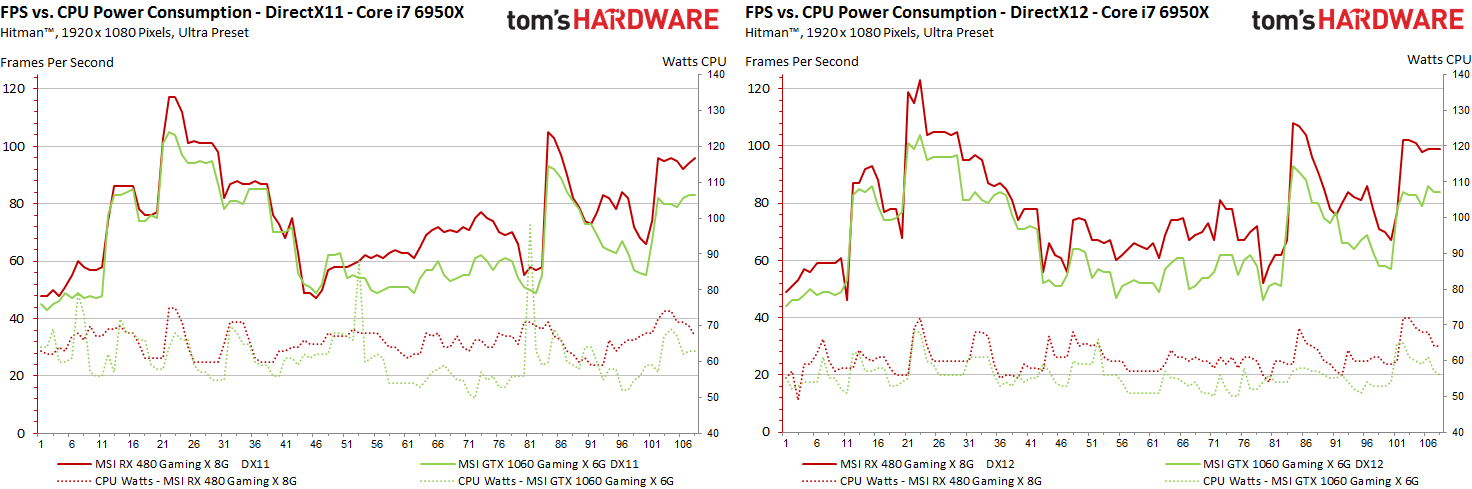
FPS vs. Power consumption
A lower CPU load is partly reflected in a lower power consumption. This is exactly what we want to ask again and test DirectX 11 against DirectX 12 on two systems with two cards each. And right, the power consumption of the CPU behaves reasonably equivalent to the CPU load:
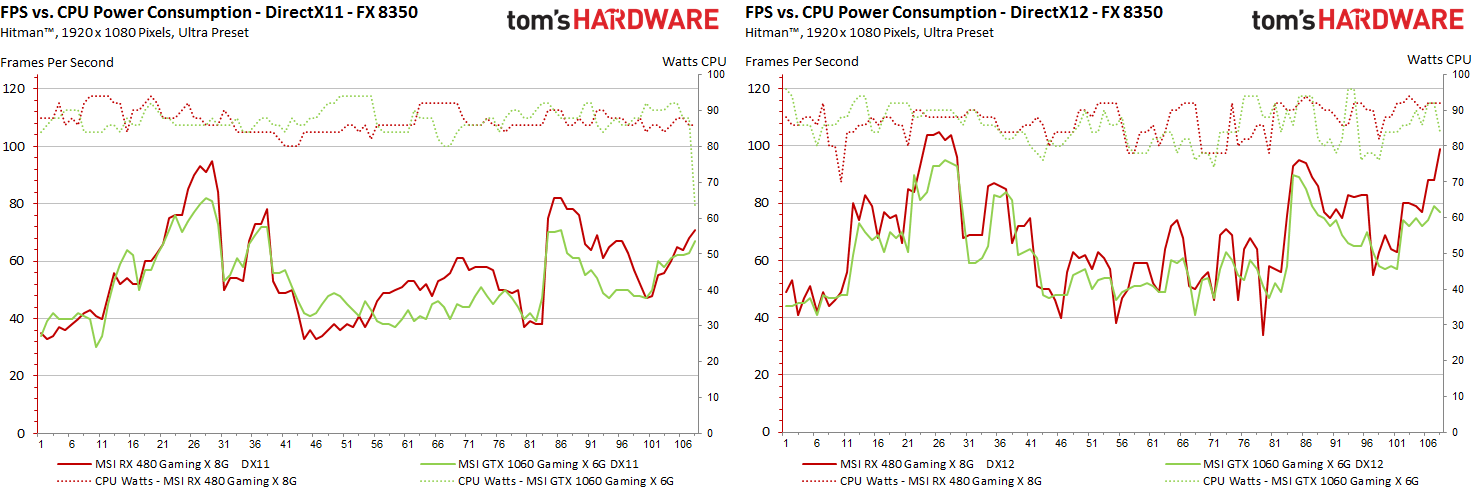
With the weaker CPU, this effect is also visible, although not quite as pronounced, because it still has to work on stop at the end:
Other values and links
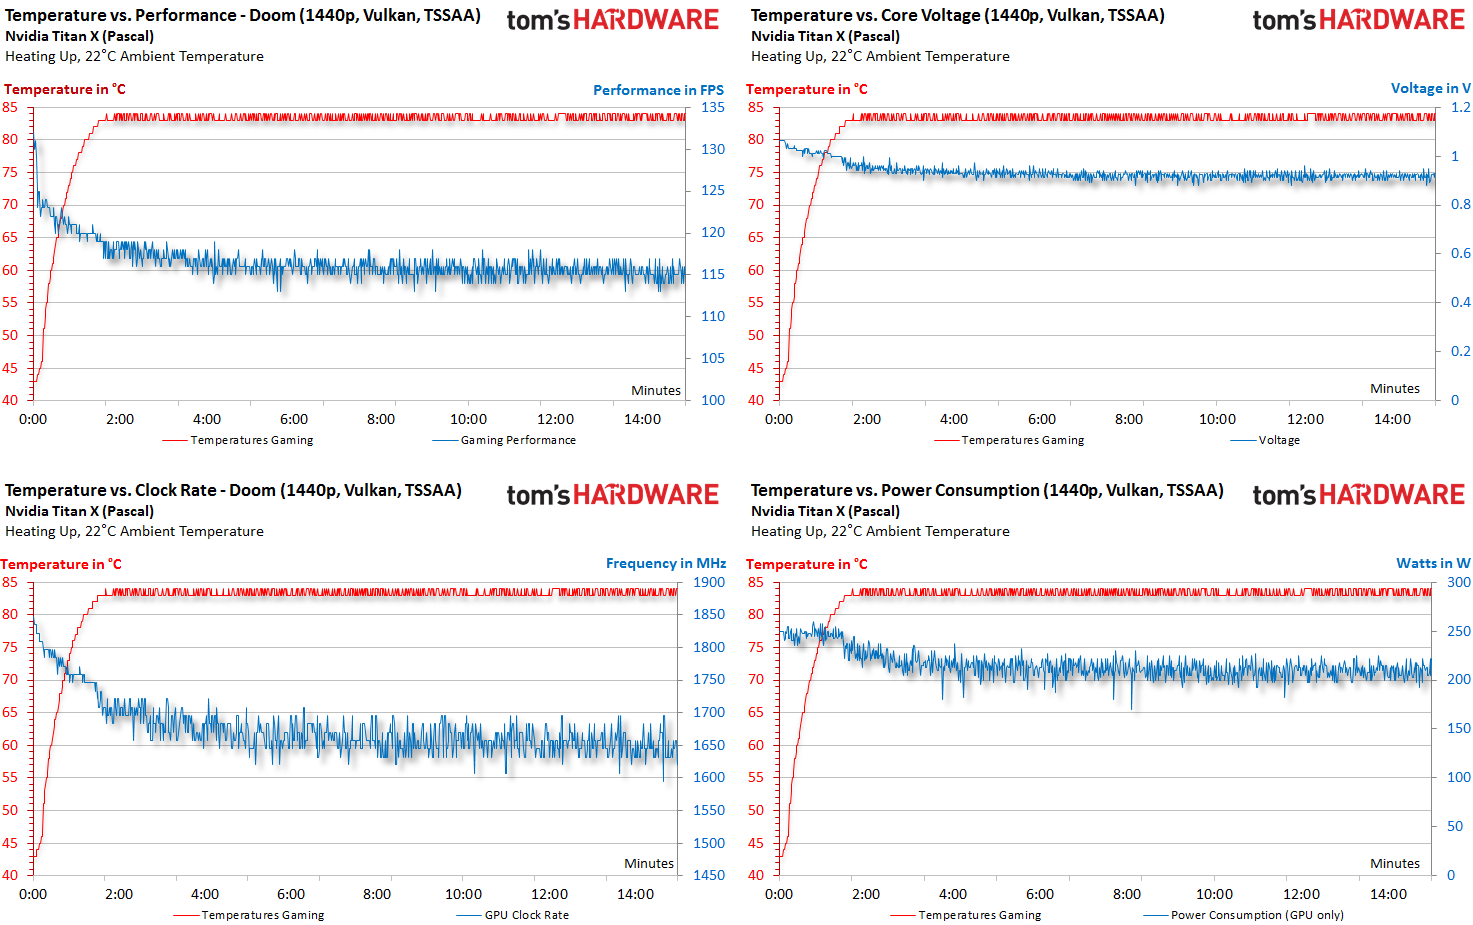
In the recent update for the test of the new Titan X with Pascal GPU, attentive readers will have noticed improved diagrams and evaluations, in which we will have some measurement results with the temperature also measured as a history diagram. have presented. The values for this also come from our tool and thus replace the previously used third-party software:
Conclusion
We have seen that pure bar graphics, while all well and good, are often not the last resort of wisdom, if you want to know more. Of course, one must not and will not always be able to use the concentrated mass of all possibilities – the effort would simply be too high and one would slap the reader with this wealth of information smoothly.
Since we can clearly identify in the course of our measurements and tests where possible problem areas and focal points could lie, we will apply an individual selection in the future. Their composition is the core question of what we consider necessary in order to be able to present our findings in a reader-friendly and accurate manner. We already like our "ruckel index" now, because it certainly saves in many cases the time-consuming explanation of rendering times and differences.
Finally, our express thanks go to the community – be it reader feedback or joint discussions in different forums. Here, the ruckel index was also suggested, the use of the 1. Derivation for our curve function and the more differentiated view of rendering times.
Of course, the whole thing is in the end a neat balancing act between what one could technically prepare for "real enthusiasts" or want to offer easily understandably also for the general public. But we are sure that there is something for everyone.


Kommentieren