PresentMon: Frame Times for DirectX, OpenGL and Volcano Measure
At the latest since the introduction of DirectX 12, Windows UWP and Vulkan, we were once again faced with the task of creating at least largely reliable determination of the rendering times of all individual frames, on the basis of which we can build our evaluations. Because Fraps no longer works for this and was not as reliable as is often assumed.
We were all just right about Andrew Lauritzen – his character a graphics guru from Intel – who provided the general public with a new tool called PresentMon for free on GitHub, which one of his colleagues had programmed.
The idea behind PresentMon is as simple as it is clever: you monitor the event tracing stack of Windows, collect the desired information of all known APIs such as DirectX (9 to 12), OpenGL or Vulkan, and then work them up for the users so that they can easily be can be collected in a CSV file, which can then be evaluated later according to your own ideas.
However, PresentMon is also subject to technical limitations, as it functions at the operating system level, and cannot replace methods such as FCAT 100 percent. In addition, PresentMon currently dispenses with a graphical overlay in the tested applications, so that one is in any case dependent on file logging. What makes PresentMon so interesting, however, is the fact that all currently common APIs can be captured
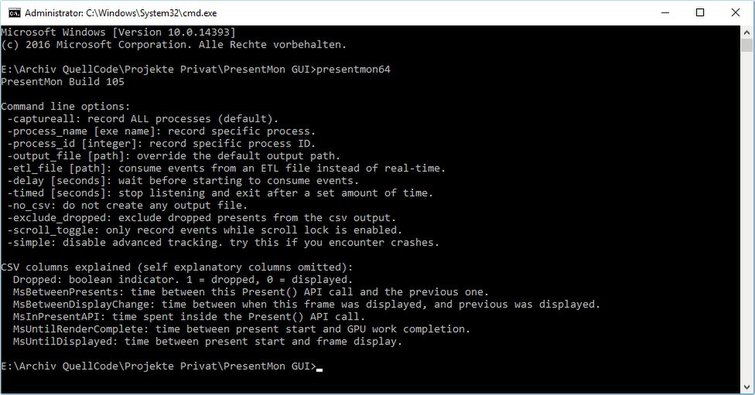
The disadvantage for the user is the rather cumbersome and time-consuming handling of the tool, which functions as a pure command line application and does not even have any graphical interface. The parameters to be passed are manifold and also contain information that is normally manually available in the system (e.g. in the Task Manager).
Capture made easy: The PresentMon GUI
Consequently, the decision was made to develop its own application for internal use, which both launches, controls and monitors PresentMon, and at the same time collects further information, which is then used for a more comprehensive evaluation and presentation. of the results.
In our tool, for example, we have stored all frequently used benchmark games with a one-time profile (and also to be edited) that automatically serves to control the PresentMon parameters depending on the application when one of the stored applications is detected.
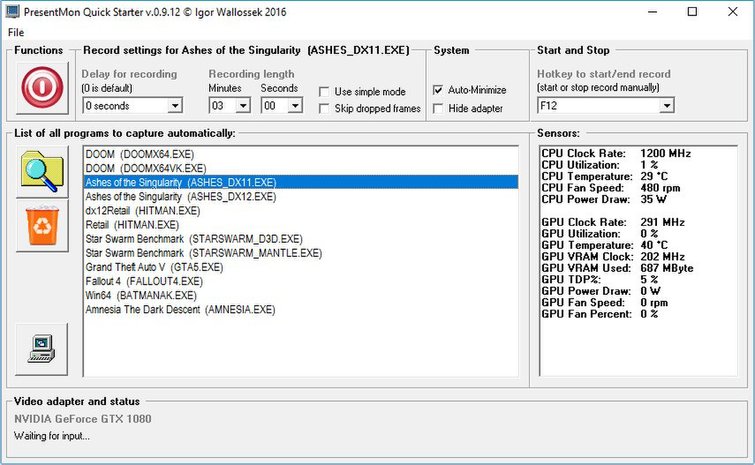
To do this, we have also implemented our own freely configurable hot key system, which allows PresentMon to start, automatically control (recording time, presets) and, if necessary, also manually exit it, while we are in the game or a specific graphic application. A nice female voice informs us about the success (or failure) of the desired action.
System data collection made easy
What is missing in PresentMon, however, must be collected in a different way and as synchronously as possible. As a registered engineering version, Aida64 from FinalWire Ltd. is able to read out a wide variety of sensors from the rest of the hardware components, such as motherboard, graphics card, memory or fixed data storage.
In order to solve this as delay-free as possible and without additional overhead in real time, we do not rely on HWInfo, where the interface is solved via a DLL, but on Aida64, where we can directly access the memory in which the sensor values are stored by the loop.
To minimize disk access, we write this second log file first into memory (the size is small enough) and only then to the disk when the log file has also been closed by PresentMon.
Unfortunately, since PresentMon does not use a timestamp, we set the start of our recordings to the first log operation actually recorded by PresentMon and perform the time recording in parallel in our own log file. This stamp is necessary to automatically control external measurements such as on our oscilloscopes or to to be able to match the logs.
Evaluation of the data and processing for the results presentation
All this data results in a huge pile of binary information that wants to be managed first. For this purpose, we also use software specially programmed by ourselves for this use, which brings together the two log files and performs all the necessary mathematical calculations, which, due to their complexity and the considerable size, are difficult or difficult to perform. would not be executable with Excel at all.
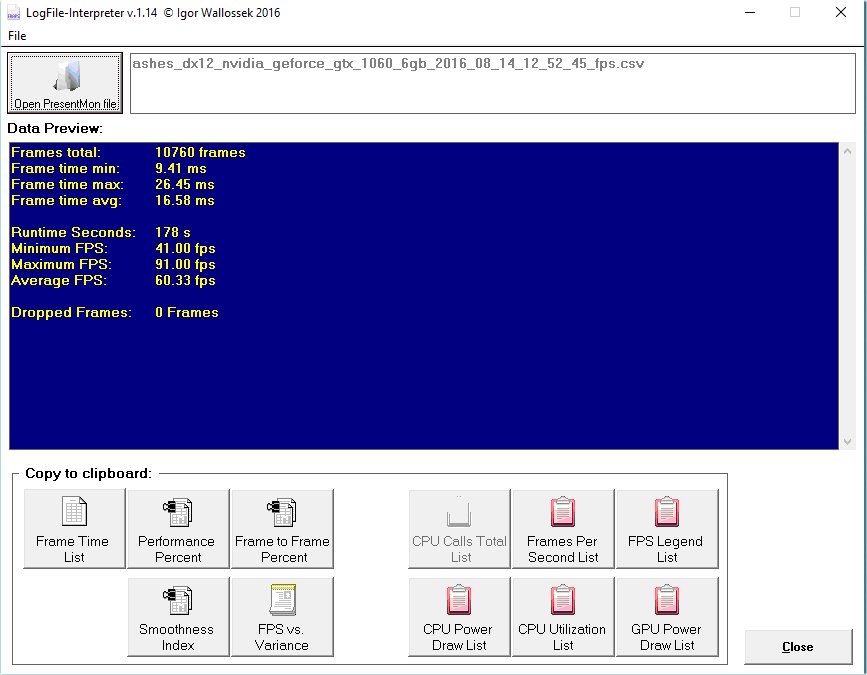
With our third-generation log-file interpreter, we can do exactly these calculations in no time and also implement new evaluations if necessary. We will explain exactly what we are evaluating and what the results will look like with a very concrete example with two different graphics cards and a DirectX12 game.
Our goal is that our readers can also record and understand the evaluations offered simply and correctly, because if we have noticed one thing in the course of our work, it is the fact that bar graphics like the following one unfortunately only half the truth and sometimes even lie that they bend.
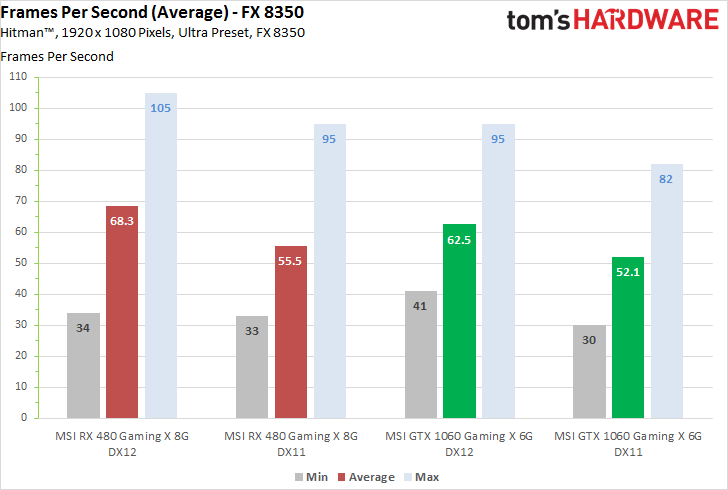
We see minimum, maximum and average FPS values, with absolutely nothing to say about the true performance feeling and possible (micro) jerks. But in order to be able to make these extremely important statements, we need more than just these final values.
Instead, we evaluate the entire course of our benchmark run, including all secondary information, which sometimes leads to very interesting and often deviant assessments, which the simple bars cheekily conceal.
Two graphics cards, two test systems, one benchmark
Since we are not primarily concerned with comparing the MSI GeForce GTX 1060 Gaming X 6G with the MSI Radeon RX 480 Gaming X 8G, but it is certainly a question of explaining what and how we measure or measure. for better comparability and easier understanding, we use a single benchmark for both maps and test systems.
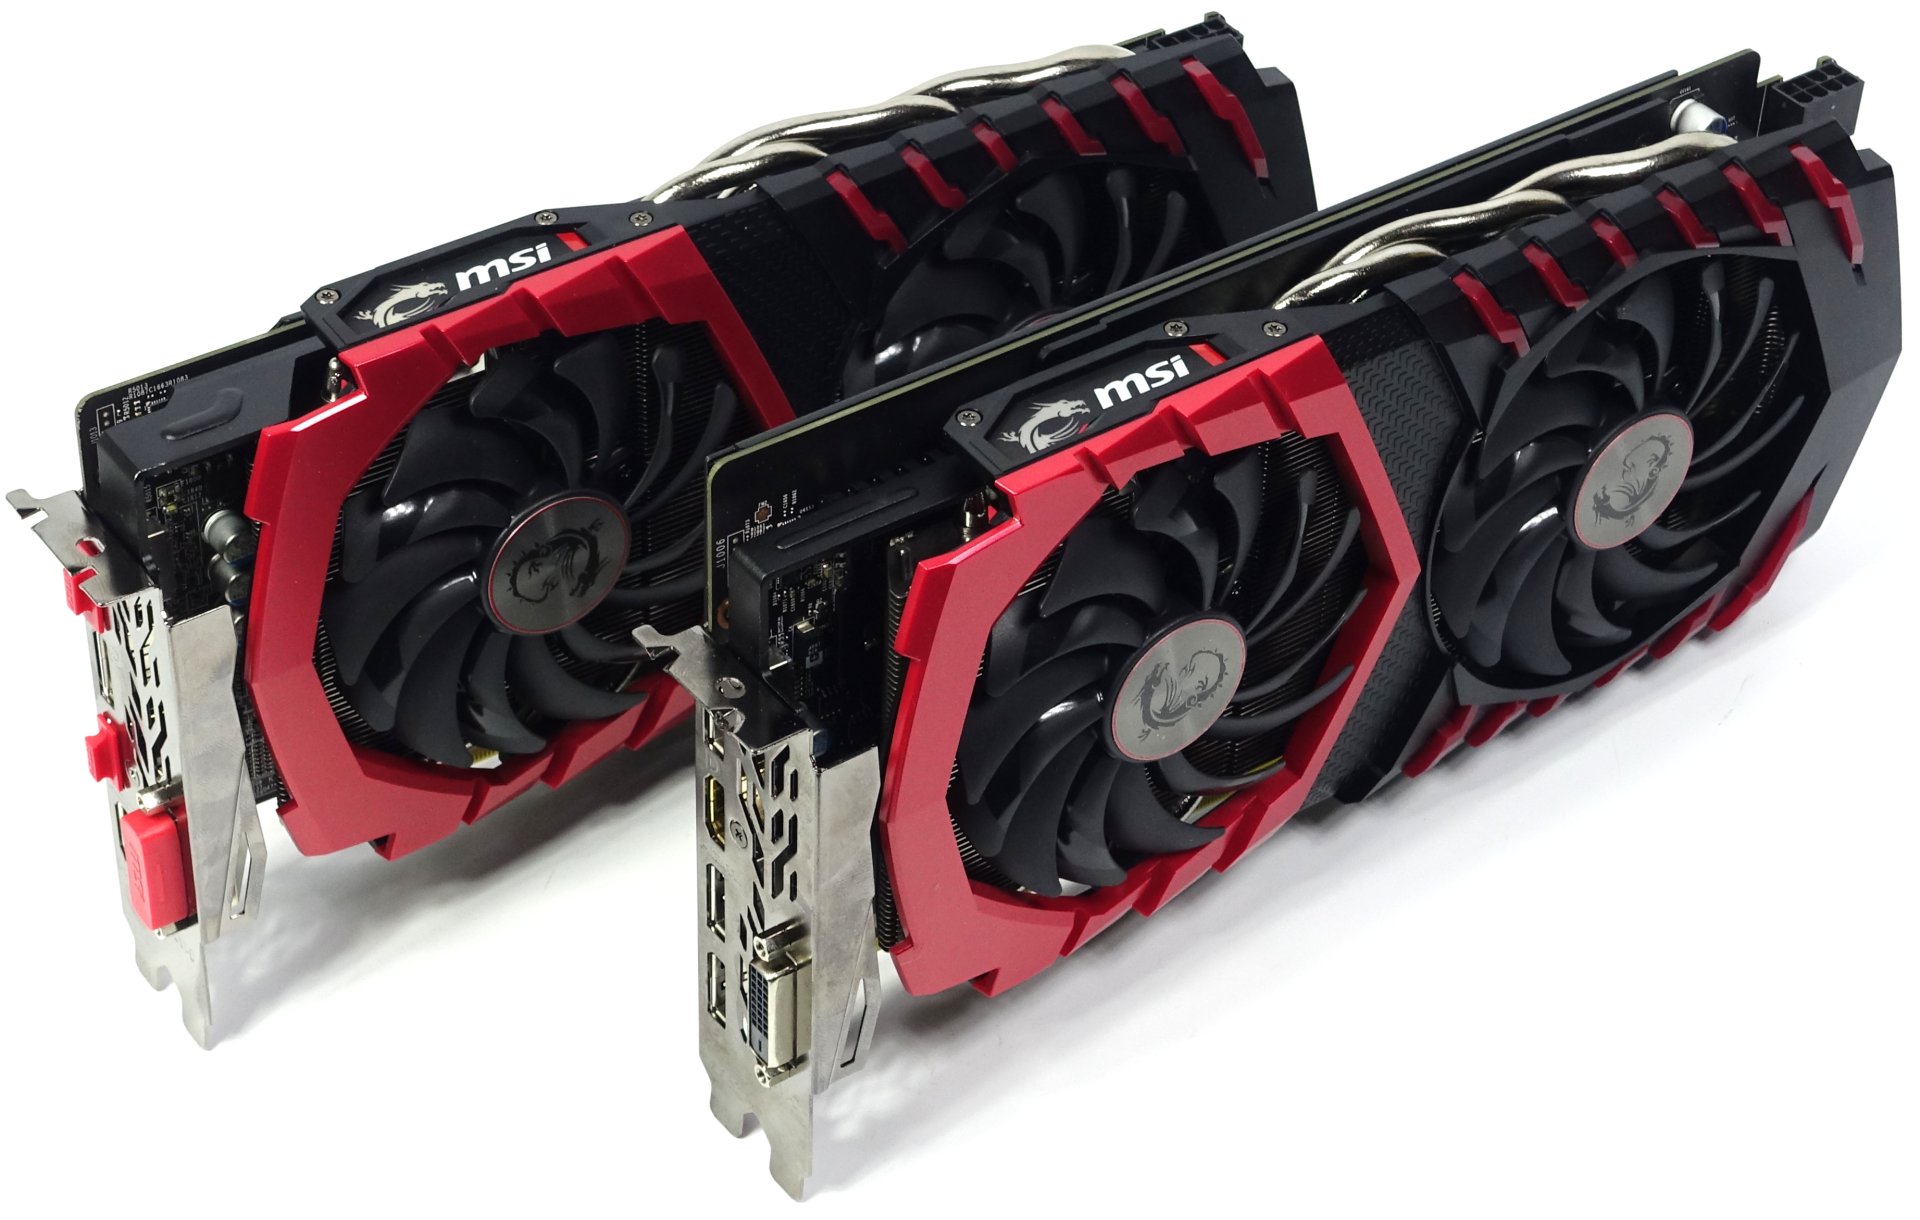
Here we rely on Hitman, with which we benchmark both graphics cards under DirectX11 and 12 on two very different platforms. This is, of course, only a snapshot, but we want to explain our system and procedure here and now and not evaluate the maps ourselves.
| Enthusiast system |
Mainstream PC |
|
|---|---|---|
| Processor: |
Intel Core i7 6950X x 4.2 GHz | AMD FX 8350 @stock |
| Cooling: |
Open-Loop Water Cooling | be quiet! Dark Rock Pro 3 |
| Memory |
16 GB Corsair DDR4 3400 | 16 GB DDR3 1866 |
| Motherboard |
MSI X99A Gaming Pro | MSI Gaming 970 |
| System SSD |
1TB, Intel SSD 5 | |
| Operating system: |
Windows 10 Build 1607 (10.0.14393.51) | |
| Driver |
Crimson 16.8.2 GeForce 372.54 WHQL |
|
Finally, we will not use all the output options presented here in future tests, but will decide on a case-by-case basis what is really important for the article. Should new evaluations be added, we will also update this basic article, because it will now also serve as a source of information linked in other articles in order to avoid unnecessary text dopplers.







Kommentieren