


Immersion: Light-hearted immersion in the virtual world
The subjective feeling now becomes the focus of our considerations. In order to get as undisturbed a gaming experience as possible, players naturally want the possible smooth and delay-free output of the individual images. And although we must of course evaluate both – the performance and the smoothness – in the context of the end, we can also consider both statements separately for good reason.
Simple performance analysis
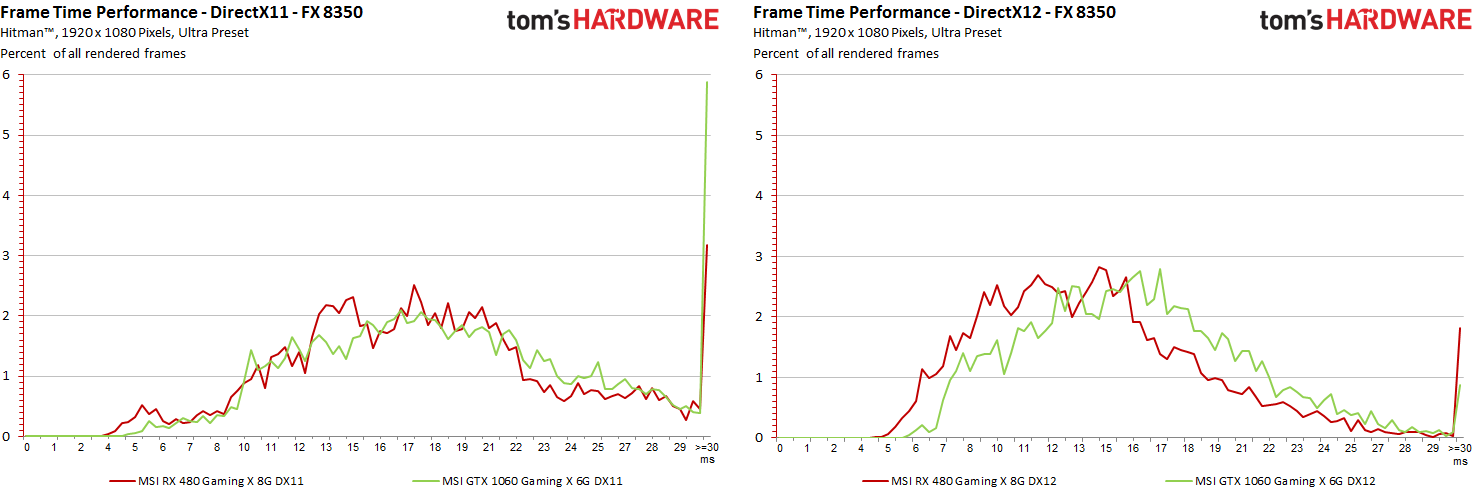
First, let's compare the performance view to compare the two cards on DirectX 11 and DirectX 12. To do this, we analyze the percentage of frames in the tiered rendering times. Everything above 33 ms falls almost below the 30 FPS mark and is from just then also unattractive enough to be summarized. The further to the left on the horizontal axis and the more pronounced the proportions, the faster the map in question renders:
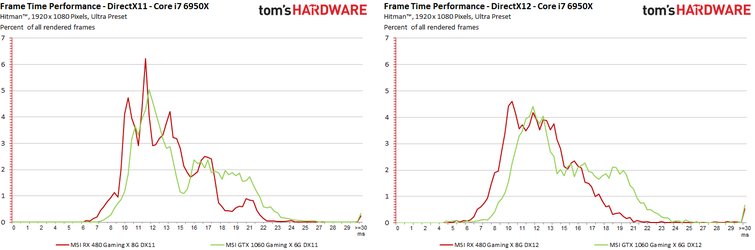
Interesting: You can see the increase in the DX12 rendering path especially on the weaker systems and the Radeon map, where the curve on the right graphic shifts clearly further to the left:
Simple smoothness analysis
For the eye and the brain, however, the time differences in the rendering times of successive frames are also very important. Immersion works best whenever this sequence is as smooth as possible and with small differences between the individual rendering times. Any major deviation (often from 10 to 20 milliseconds) can then be perceived as a microjerker, whereby the subjective feeling of player to player can of course be very different.
Here, too, the percentage evaluation of the individual ren-time differences is carried out first, whereby we have set the limit at 10 ms, above which we will have to look more closely later. However, we can already see here that with both cards on both systems and in both rendering paths not everything runs as smoothly as one would like for the perfect immersion:
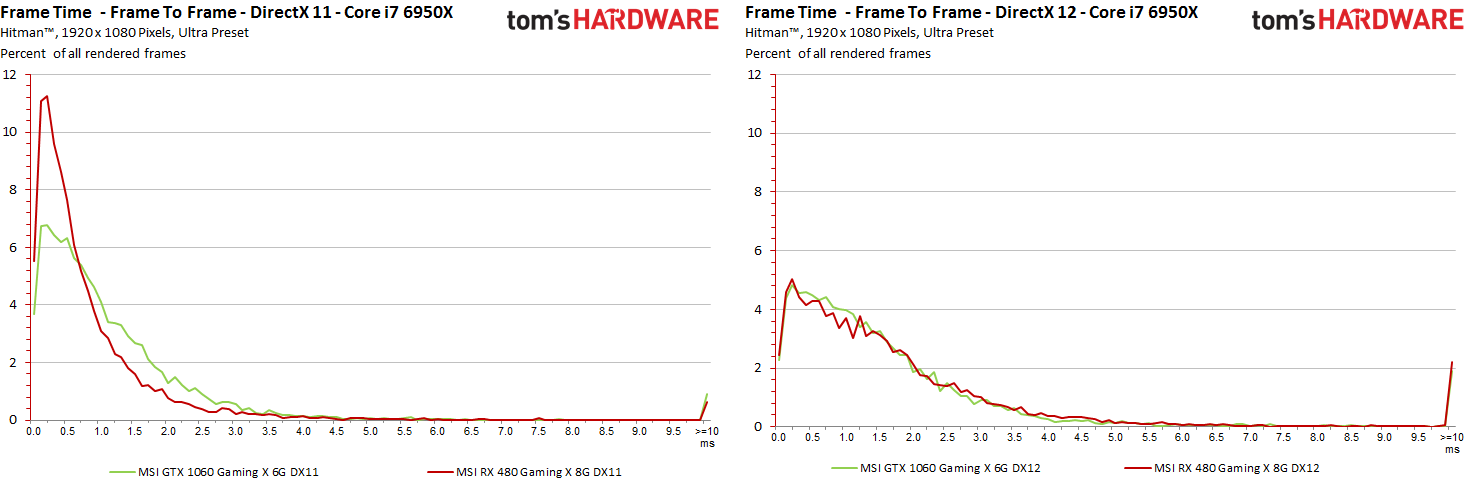
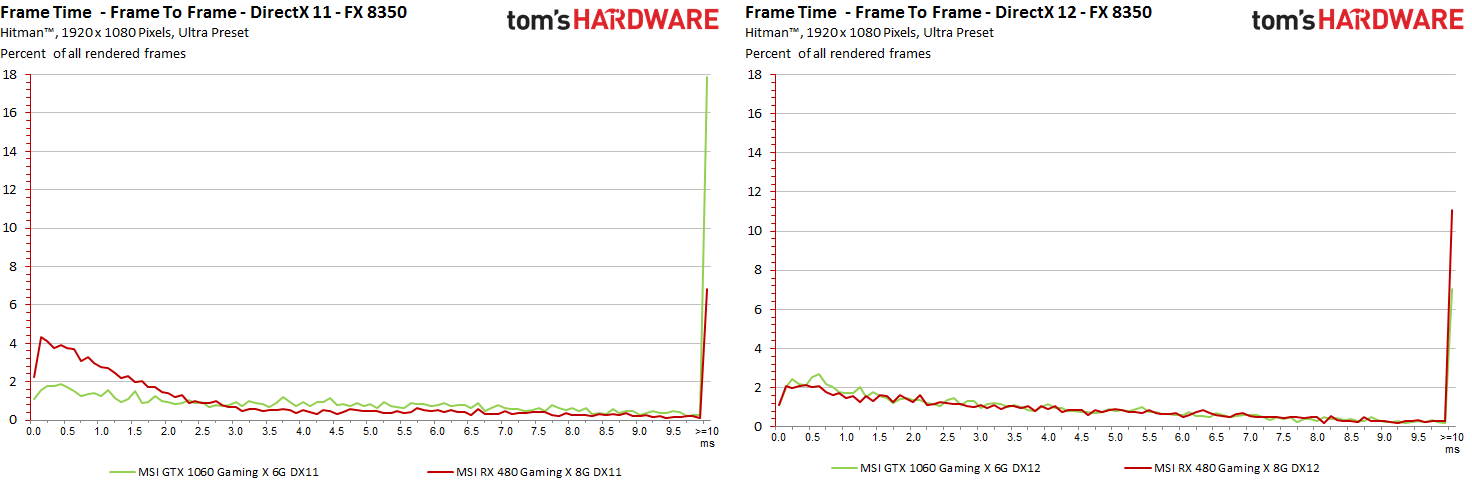
For example, we can clearly see in the graphics that under DirectX 12, in contrast to the increased performance, jerking and the "unrounded" run are also increasing. In order to question this even more clearly, we now have to use mathematics again in the following part of the considerations and also filter these difference curves a little.
FPS vs. Frame-time difference
Many roads lead to Rome – so does this one. First, we interpolate the FPS curve to the longer of the frame-time curves to make a direct comparison. However, the differences of rendering times shown are not a simple difference between the individual frames, but the result of a more complex calculation in which unimportant spikes are filtered a little and in the end only the values that the immersion. First, let's look at the faster system:
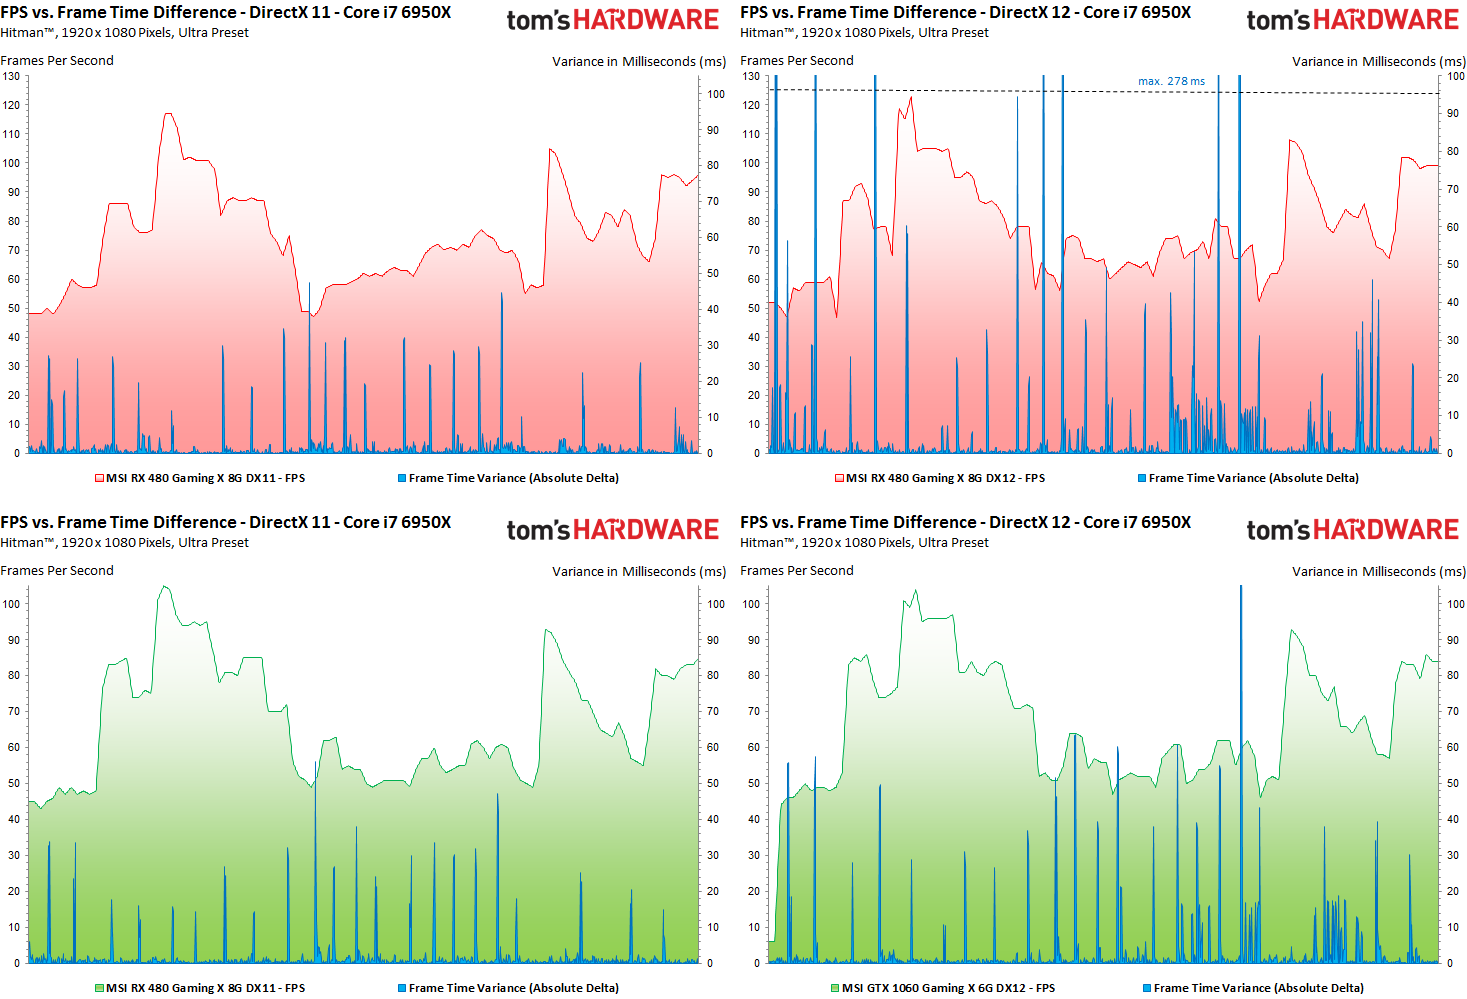
This observation shows us very clearly that increased FPS numbers do not necessarily contribute to immersive well-being, because such outliers up to well over 100 ms are to be regarded as jerks and dropouts and not only microjerkers – and are also perceived as such. This is shown above all by the diagrams with the slower CPU. It's nice to see the Radeon RX 480 now benefiting more clearly from the DirectX-12 rendering path, but it's also an expensively purchased delight, because the frame-time variances are both ugly and disturbing.
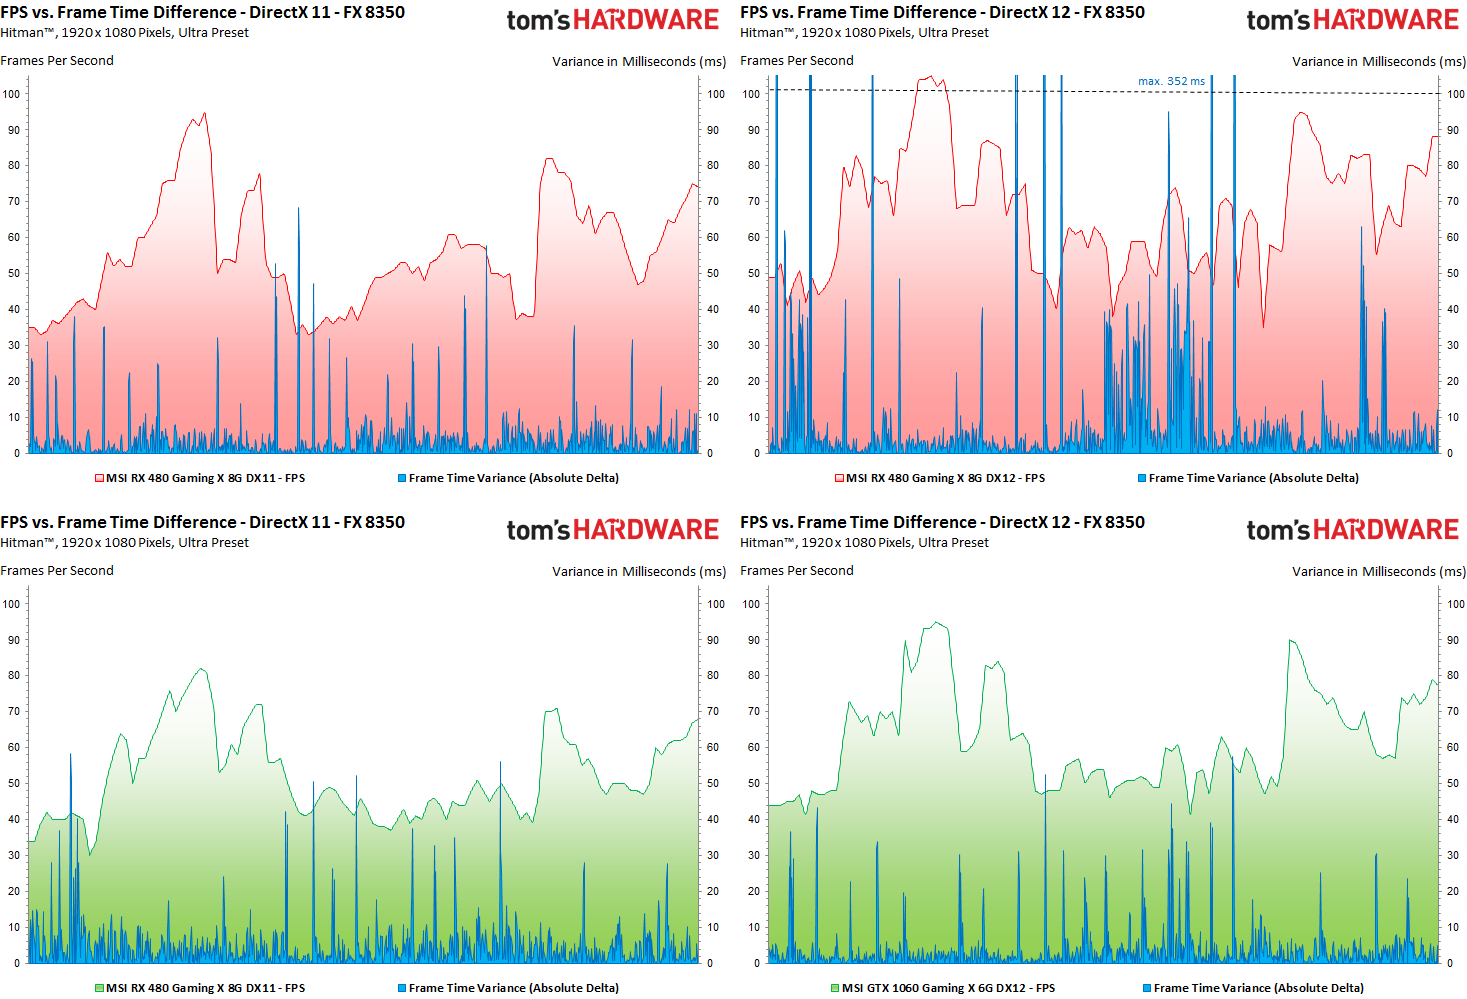
The other card doesn't really get any, but somehow it doesn't lose anything. You can see a stalemate and proof that DirectX 12 for the GeForce GTX 1060 only really makes a difference if the CPU is strong enough. As a consolation patch you get at least the somewhat calmer picture.
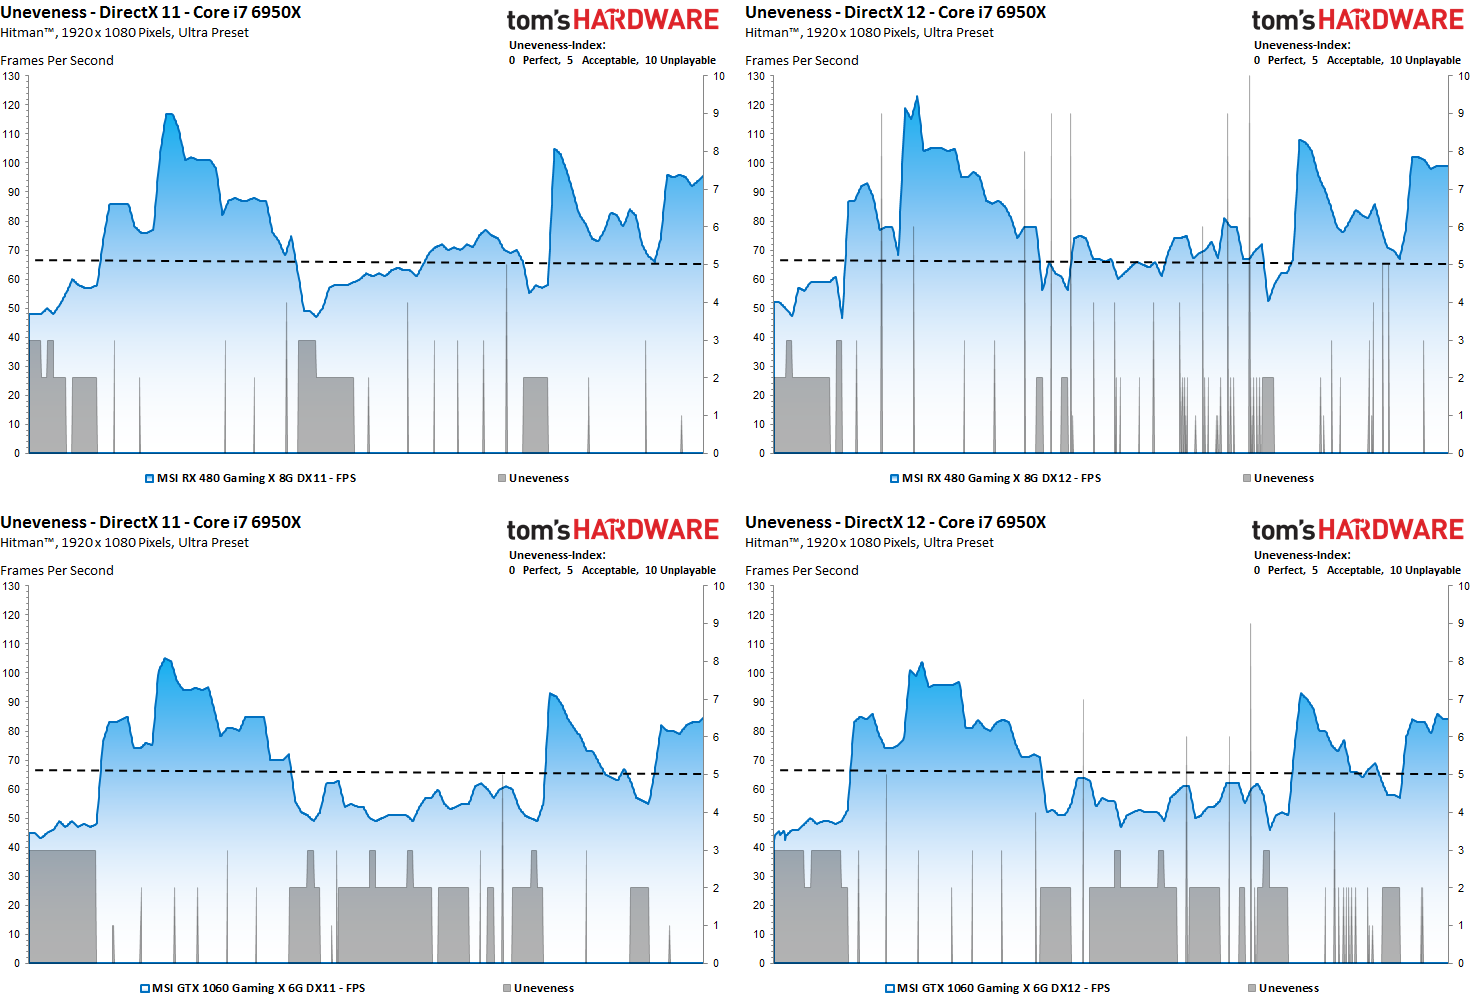
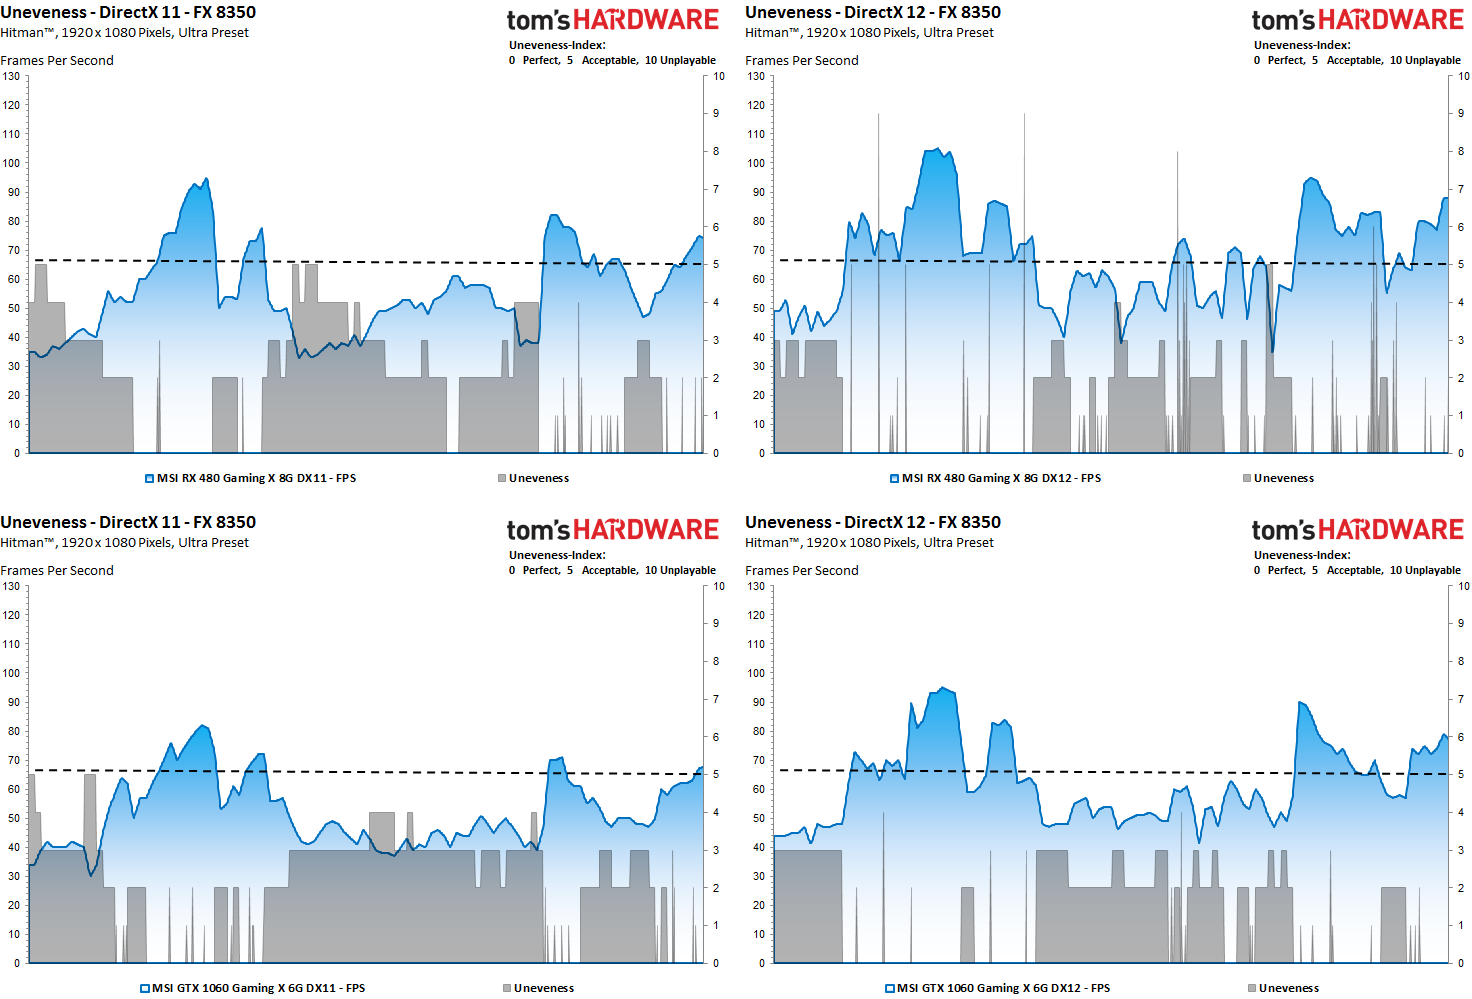
Uneveness: The incorruptible "ruckel index"
First, we take our determined frame times and calculate the real FPS (including the pro rated rendered frames within that second). This is virtually the foundation of our index listing. Because if there are only less than 30 fps, you don't have to consider any of the frames of that second as playable. The same applies to the staggering up to 60 FPS, where the good to very good playability is important.
Of course, all this is still far too crude, but it shows the direction in which it could end up. Nevertheless, even in a really nice 70 FPS interval, a medium or larger rendering disaster in the form of a few, but grotto-bad frames can hide, which submerge in the rough FPS data, so to speak in the collective, but then the player into the Eye-jumping.
Therefore, we add an evaluation layer to the top and examine the rendering times of the individual frames as well as the differences between the respective frames for further evaluation. Aspects such as the first derivation of the functions for the creation of our curves (frame times, differences) as well as a kind of intelligent filter, which for example largely detects and filters out hard transitions in the game sequence, are used.
In case of doubt, neighbouring frames are also used as a plausibility check. Thus, a fairly accurate forecast can be made to what extent such an exception could also be visually perceptible (ruckler, whole dropouts). If this rating is higher than the base that we had already set for the second interval, then this one frame (or the affected frame sequence) within its exact time period with a higher, worse index value.
At the end there is the evaluation of the subjective feeling as an integer "disturbing or jerk index" without flowing intermediate values in the form of decimal places. This rating ranges from level 0 (perfect, no disturbing influences), to level 5 (acceptance limit) to level 10 (real jerks, dropouts). More sensitive minds will be able to perceive micro-jerks from level 3 or level 4, which can become more and more amplify.
The faster CPU also ensures a fairly good and smooth playback of the mid-range cards, whereby the Radeon RX 480 under DirectX 12 already has to contend with some visible jerks.
This becomes even clearer when using the weaker CPU. The GeForce travels much slower, but offers the subjectively perceived calmer image.
Which at least brings us to the end of the issue of the image rating (for the time being). But, of course, this is still not all we might be interested in.


Kommentieren