We have taken the feedback of the readers, evaluated it and improved it again together with an aerodynamicist. Afterwards, everything was recalibrated and the evaluation was extended by new chart graphics, which now finally cover the entire speed band. But more on that in a moment. Of course we noticed that our new measurements were taken up and copied by some competitors, however, politeness forbids to list names and also recognized errors here. Instead, one should always strive to simply do even better oneself and accept the challenge, because the imitators also show that we were the first to discover a real gap in demand!
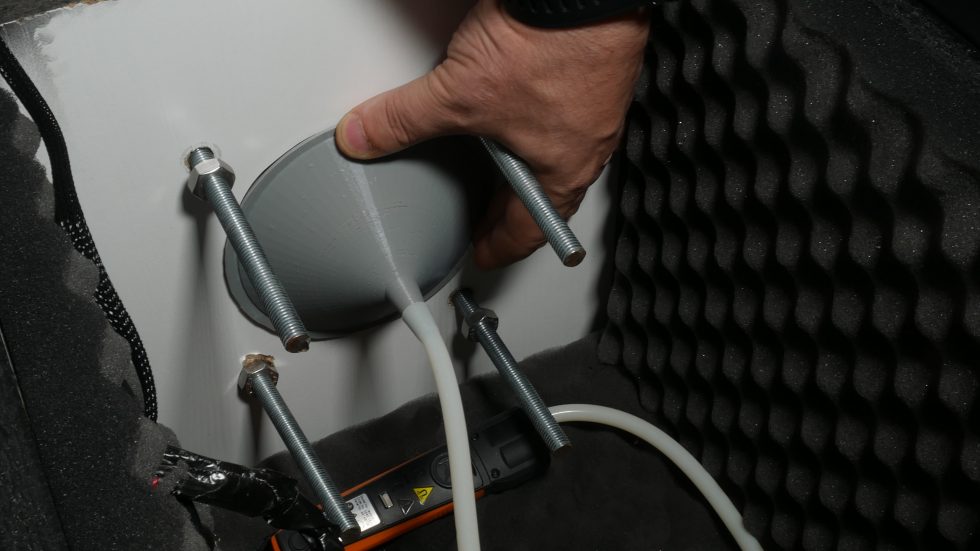
We have only changed the measurement of the airflow and the sound pressure level in the chamber in small details, because they are still accurate enough to stand up well in professional counter tests. On the other hand, we have been able to improve the accuracy of static pressure, especially at lower pressures. Thanks to newly designed and self-printed funnels with special seals, it is now possible to work even better.
Improved measurement setup
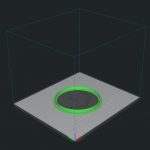
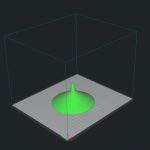
Since my former employer is also one of those who now try to copy us, the angles in the 3D graphics and also in the following two photos are of course not quite right, because without knowing the exact dimensions of the funnel, a copy is virtually pointless and it also works only in a quite small tolerance range really quite accurate. We have also made comparative measurement series for this once again. In practice, the whole thing looks like the two pictures below.
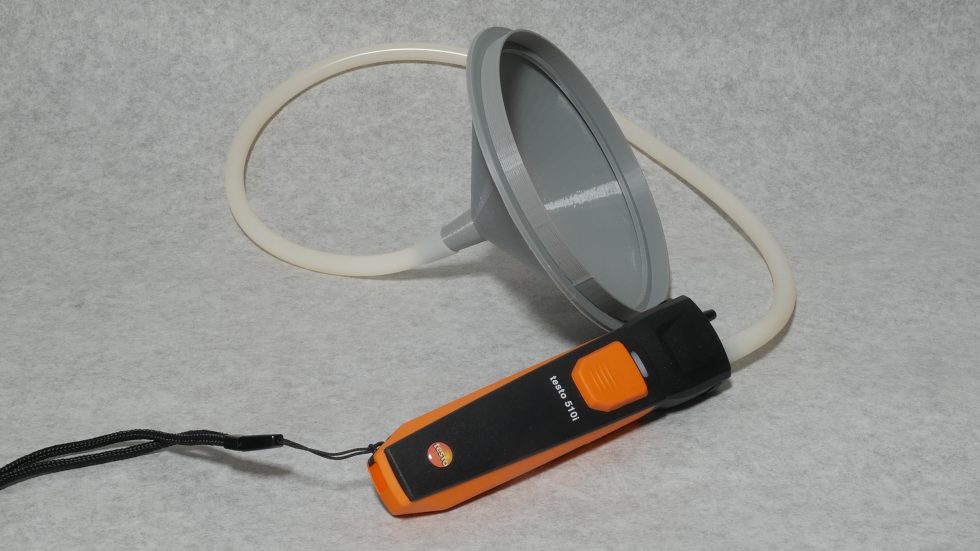
The installation is trouble-free and the pressure receptacle now also closes perfectly thanks to a special seal. The rest is just a matter of calibration, which we also did again. It’s unlikely to get much more accurate with semi-professional methods. However, especially in printing, mistakes are quickly possible, which above all are not immediately recognizable. Even if the deviations are small, we will still measure all previous fans again and prepare them for the database.
New metrics and graphics
Apart from the fact that we now also record the minimum and maximum values for the flowing currents and the power consumption, we have fulfilled two further wishes of the readers and extended the measurement series in this respect. In order to be able to assess the fans really objectively, we first graduated the resulting volume flow and measured the sound pressure level in many individual steps. Fas result for a fan then looks like this in comparison to the reference fan:
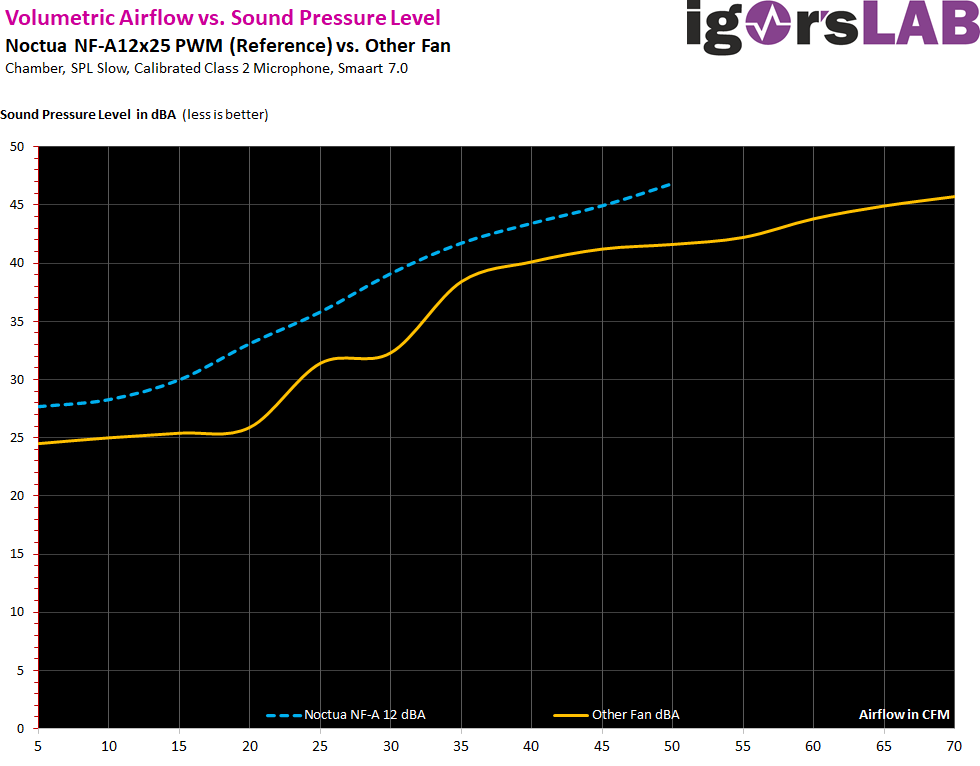
We see that the increase in the sound pressure level of our test fan is not as even compared to the reference, but the level is still lower at a comparable volume flow. In addition, the fan tested and compared here also delivers a significantly higher airflow due to a 50% higher maximum speed, which in the end is bought with a similar sound pressure level as the reference fan, but whose performance is significantly lower.
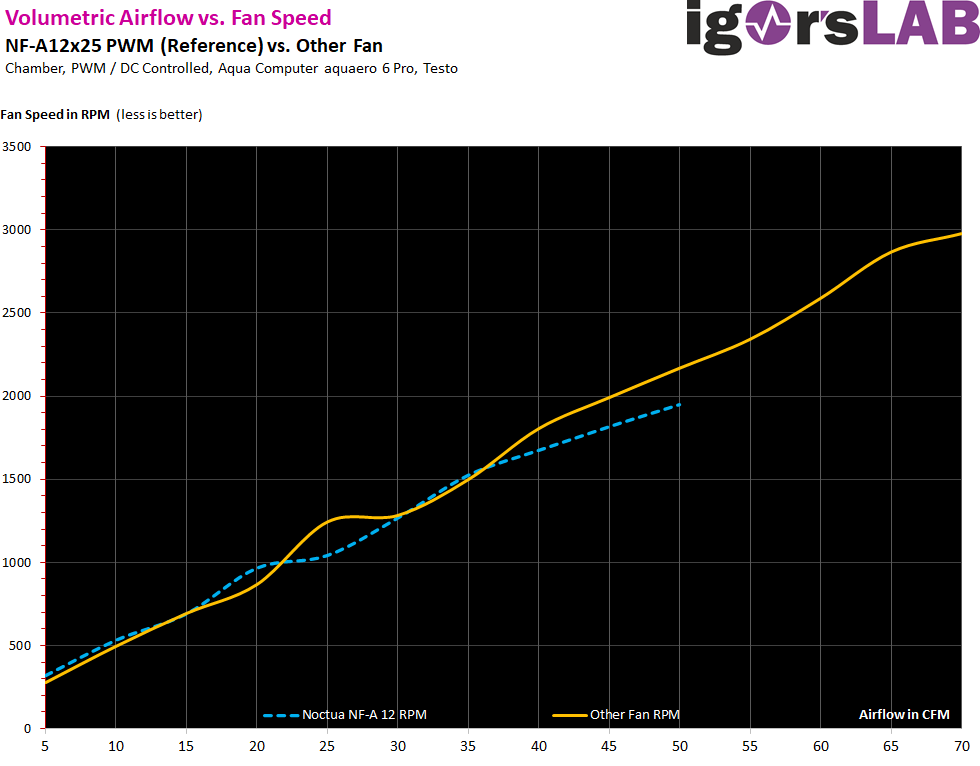
And because we just wrote about the rotational speeds, there are also new comparative graphics for this, at the express request of the reader, by showing which rotational speeds are necessary to achieve a certain volume flow. In practice, we can now also see where the dip in the upper graph comes from in terms of volume, because there is a speed range (rather a smaller window) where the fan doesn’t perform so perfectly and spins higher to reach the desired CFM than a more even rise in the curve would have led us to expect.
In tomorrow’s fan test, we will include all these changes in an article for the first time, and our thanks go once again to the community for all the suggestions, the expert advisor for his competent help, and our Pascal, on whom the work will stick in the end. But we’re happy to do it all for our readers. 🙂




26 Antworten
Kommentar
Lade neue Kommentare
Urgestein
Urgestein
Urgestein
Urgestein
Urgestein
Urgestein
Urgestein
Urgestein
Urgestein
Urgestein
Neuling
Urgestein
Veteran
Urgestein
Mitglied
Veteran
Mitglied
Veteran
Neuling
Alle Kommentare lesen unter igor´sLAB Community →