


Overclocking and undervolting
The conventional overclocking by means of an even higher power limit and more clock speed can be quickly forgotten. We will see why this is the case in the cooling section. So crowbar is not possible. After all, Gigabyte has already had to follow AMD's guidelines for GPU clock speeds in terms of power limit and voltages. And that is where this implementation reaches its limits. Sure, it would be louder and then cool enough – only who really wants that?
In our articles "Overclocked and boiled: AMD Radeon RX Vega64 water-cooled" and "AMD Radeon RX Vega64 without temperature limit with interesting findings" has already been explained extensively. Thus, this path is a dead end anyway.
On the other hand, a healthy sub-voltage can achieve much better results. Especially the use of the program OverdriveNTool can produce real miracles here. More or less, because as always it depends on the respective chip quality (and the driver version). However, since these very individual results cannot be flattened, each user would have to test it for himself. Whether the effort is worth it, however, is up to everyone. A good guide for this can be found, e.g. in this tutorial.
Temperatures and clock rates
Why we limit ourselves to the output of the values reported as GPU temperature is because the telemetry of our test sample also uses this value. What it is all about with the sometimes significantly higher hotspot temperature, you can read here again: ""AMD Radeon RX Vega64 without temperature limit with interesting findings". We were able to log values up to 15 degrees higher on the map, but they seemed a bit borderline in their height if you take advantage of all the possibilities of the map.
We now tabulate the achieved start and end values for temperatures and GPU clock (boost):
| Initial |
Final value |
|
|---|---|---|
| Open Benchtable | ||
| GPU Temperatures |
44 °C | 74-75 °C |
| GPU clock | 1378 MHz | 1352 MHz |
| Ambient temperature | 22 °C | 22 °C |
| Closed Case | ||
| GPU Temperatures |
46°C | 74-75 °C |
| GPU clock | 1378 MHz | 1344 MHz |
| Air temperature in the housing | 24°C | 47°C |
Overview Graphs: Temperatures vs. Clock
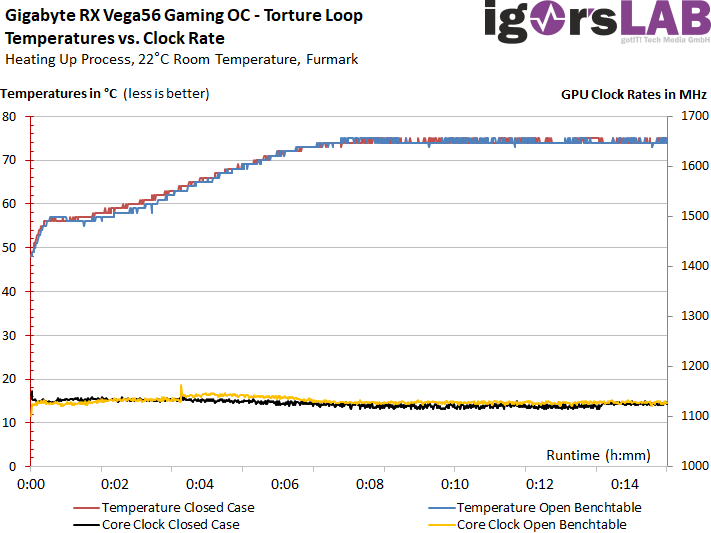
For better illustrations now again the respective courses considering our timeline of a total of 15 minutes each for the warm-up time.
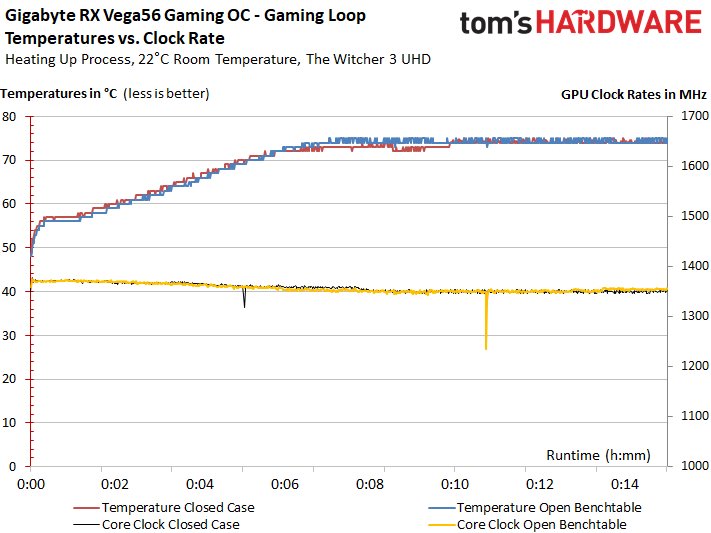
We see that the clock in the gaming loop is around approx. 100 MHz higher than the reference. This increase of an average of just under 10 percent in this very demanding game is bought with a 40 watt higher power consumption, which is already 18%. However, gaming performance only increases by a maximum of 5-7%, which is no longer in any meaningful relationship. The Torture Loop looks similar:
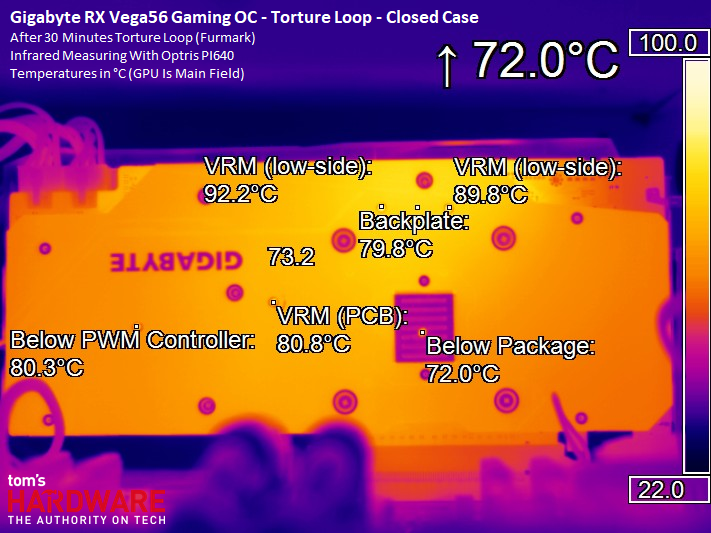
Thermal analysis of the back of the board
Finally, we consider the thermal analysis of the respective load states. In order to remain as practical as possible, we have pierced the backplate at the relevant locations for the IR measurements and cut out the pads accordingly. Since these are very small diameters, this does not change the performance.
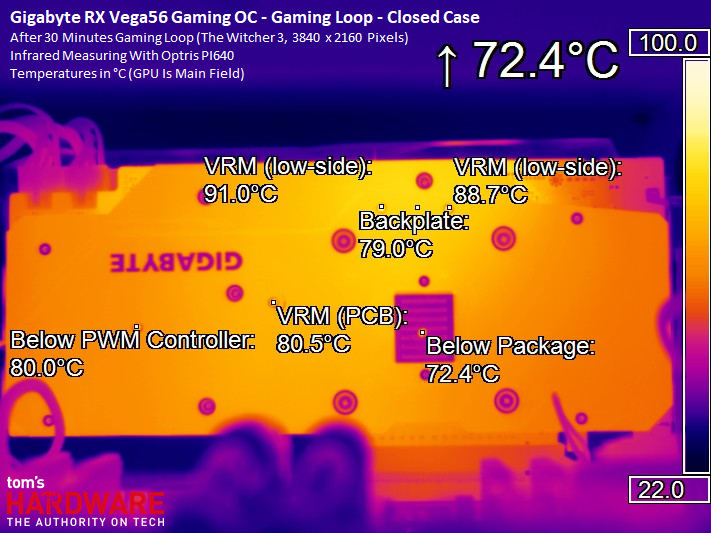
Gaming
We can see that the map is already reaching its limits in the gaming loop. As long as you operate it vertically and in an open structure, everything still seems to be in the green area, but that can change quickly if you install it.

When used in closed housings, we then measure higher temperatures for the voltage converters by up to 6°C. Here it is revenge once again that the fans only take into account the GPU temperature. With only a little more bums for the fans you would get back to about. 4-5°C cooler, without the ears falling off.
Stress
The stress test is slightly lower in terms of power consumption compared to normal gaming, so the GPU stays a little cooler.
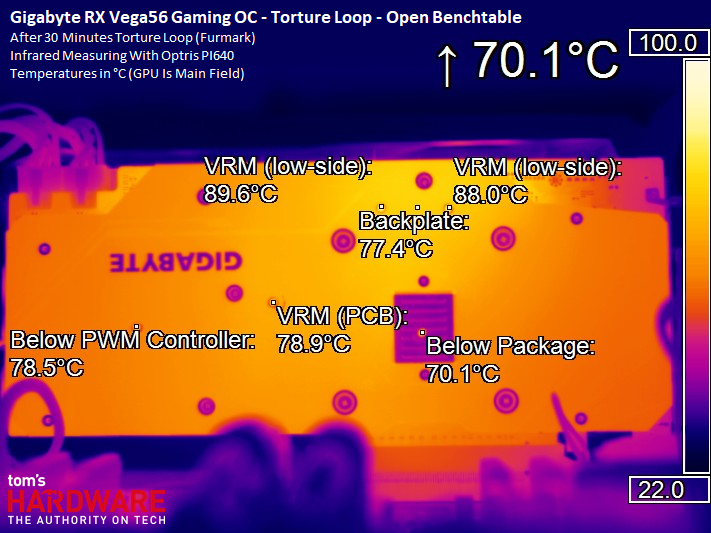
Even in the closed housing, this time it is only up to two degrees more at the neuralgic points, nothing more. Nevertheless, the plentiful 92°C does not have to be for a part of the voltage converters.


Kommentieren