Important preliminary remark
However, due to the amount of information, I have written an extra article about the circumstances of this BIOS exchange, which explains the whole thing in detail. One can read this now under “AMD’s BIOS castling of the Radeon RX 5600 XT and the consequences for consumers and board partners: BIOS tangle, cooler differences and some crashes” for a better understanding. There I also describe the possible problems a potential buyer might face.
But back to the Powercolor RX 5600 XT Red Dragon. In this review I focused on the new BIOS in performance and silent mode when benchmarking the card and compared these two results with the performance mode of the old BIOS. The old silent mode is pretty silly, so I left it out. The GeForce GTX 1650 Super will certainly be annoyed by this. The bandwidth increase of up to 17% with 14 instead of 12 Gbps is of course brutal and you will notice it very clearly in the measurements.
I tested all cards again on the new test system with the Ryzen 9 3950X and focused the card selection on the direct opponents. Thus, besides the RTX 2060 6GB, a GeForce GTX 1660 Super and the 1660 Ti are included as well as the two RX Vega and the RX 5700 and 5700 XT from the AMD portfolio. There wasn’t more time to do so, as the BIOS only arrived on Friday (and then anothers on the weekend), whereby Windows had also received a few patches.
The fact that the GeForce RTX 2060 has been picked out as a counterpart is probably primarily due to its price. Because the UVP of 299 euro for the RX 5600 XT is set quite high, so that a slower card with original BIOS simply would not have been sold. Because with approx. 300 euro one lies exactly in the range, where there are the most favorable RTX cards in the trade. It will be however exciting to see, how much the better equipped models of the RX 5600 XT will then really cost in the shop and how large the price difference to the most favorable RX 5700 will be. This is exactly where I see a big problem. Unless AMD lets the rather hapless RX 5700 die slowly, whose price gap to the much faster XT version is simply much too small.
Either way, I will be surprised what this BIOS-enhanced Radeon can (and cannot) do. However, all three cards (Powercolor as AMD sample, MSI and Sapphire self-procured retail cards) had sporadic stability problems under longer full load and very extensive memory usage, which the board partners could confirm to me. If you get into such problems yourself, which can happen (but not with all cards), you can get back to stable areas with 50 MHz less memory clock. This only as additional info at the edge, because I will of course keep at it.
Technical data and picture gallery
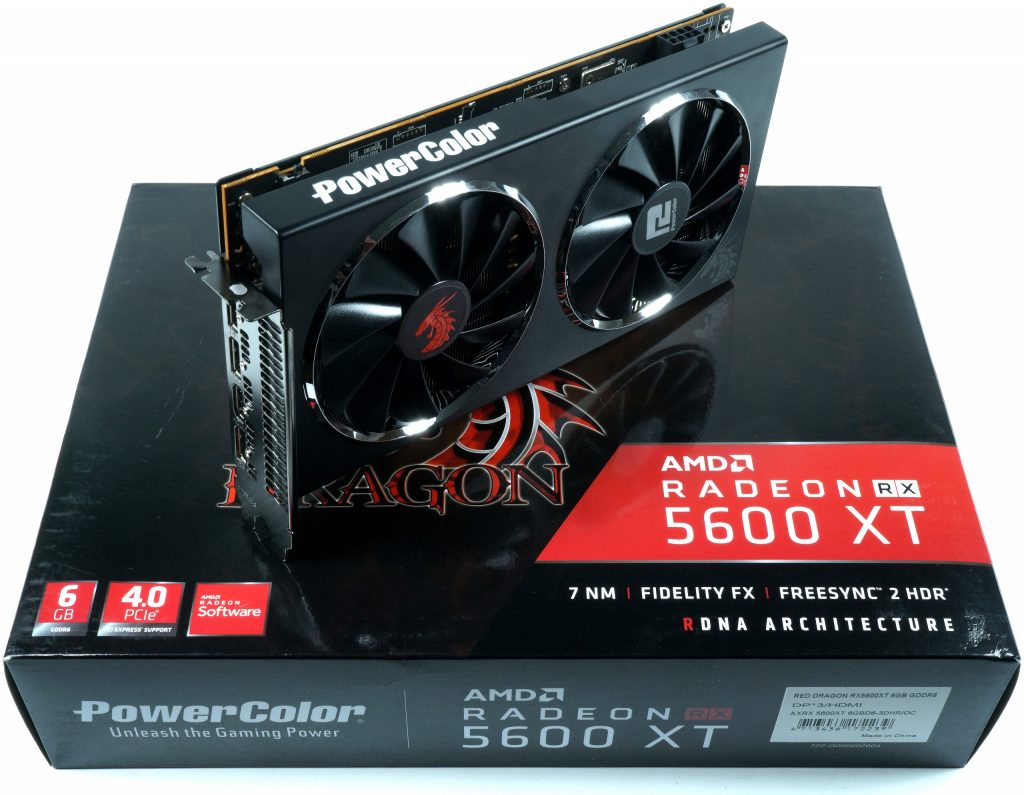
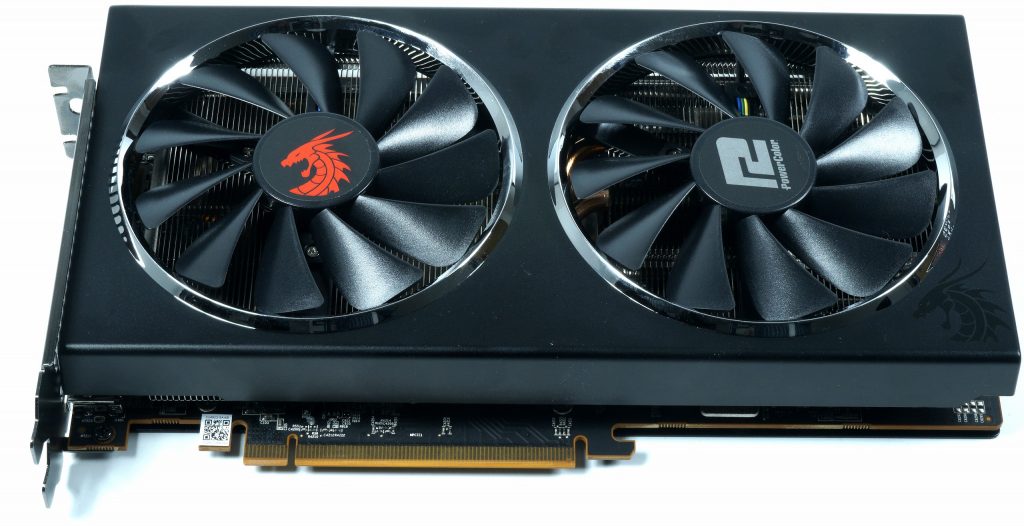
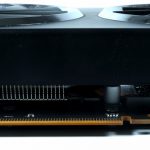
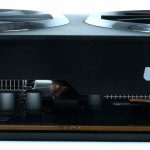
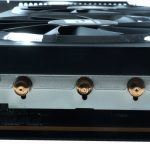
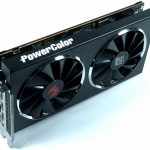
The design is kept very simple and is dominated by the two chrome rings of the fan mounts. There are no big design highlights, which rather speaks for this more timelessly designed card. It is a true dual-slot card and is also quite light, which simplifies installation.
Matching this, the overview of the most important features:
| Length (outer edge of slot bracket to end of card) | 24 cm |
| Installation height (top edge of PCIe slot to top of the card) | 12.5 cm |
| Installation depth at the front (cooler assembly to the underside of the board) | 3.5 cm |
| Rear mounting depth (board to outside of backplate) | 0.5 cm |
| Weight: | 800 g |
| Shroud: | Black with chrome applications Aluminium, powder-coated |
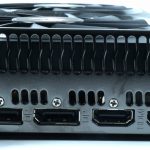
| Output: | 3x DisplayPort 1.4 1x HDMI 2.0 |
| Features | 1x 8-Pin |
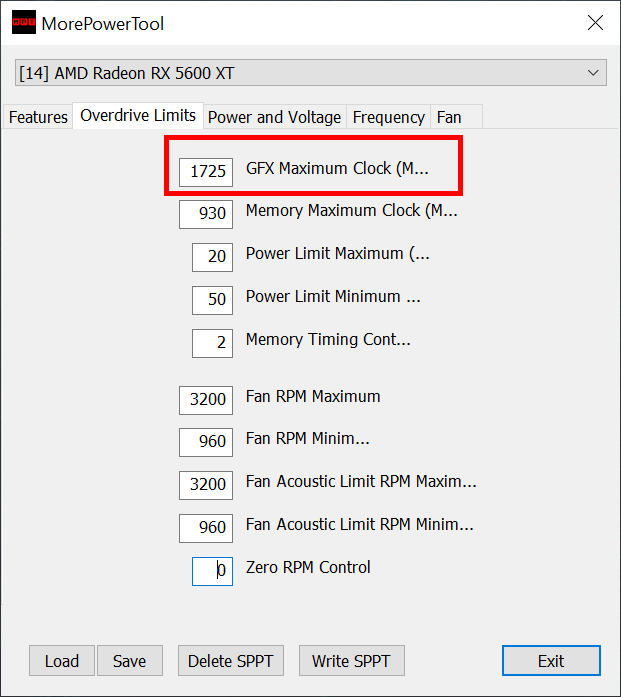
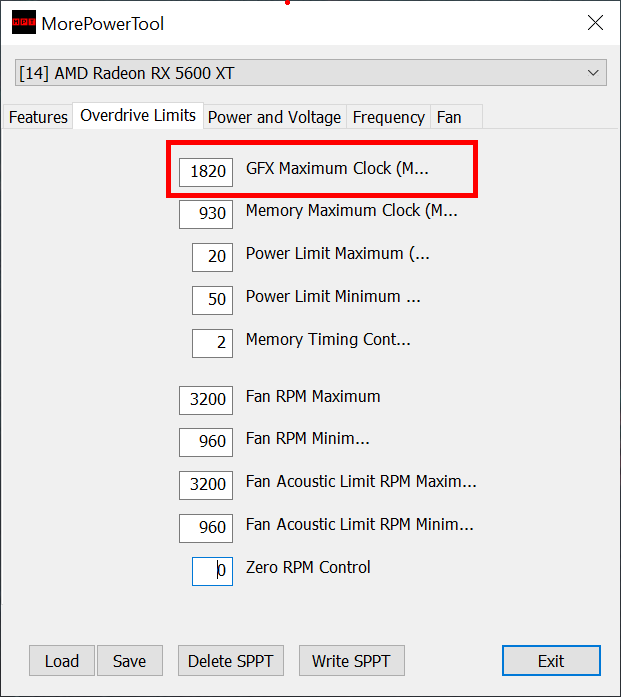
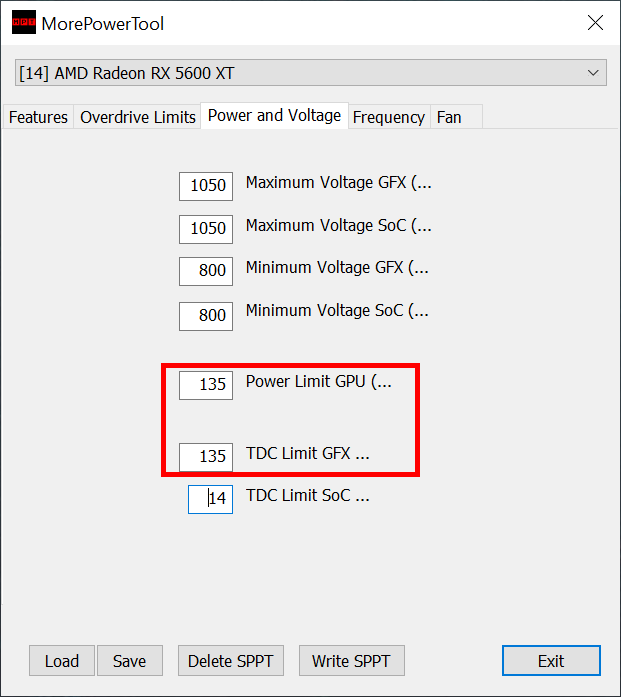
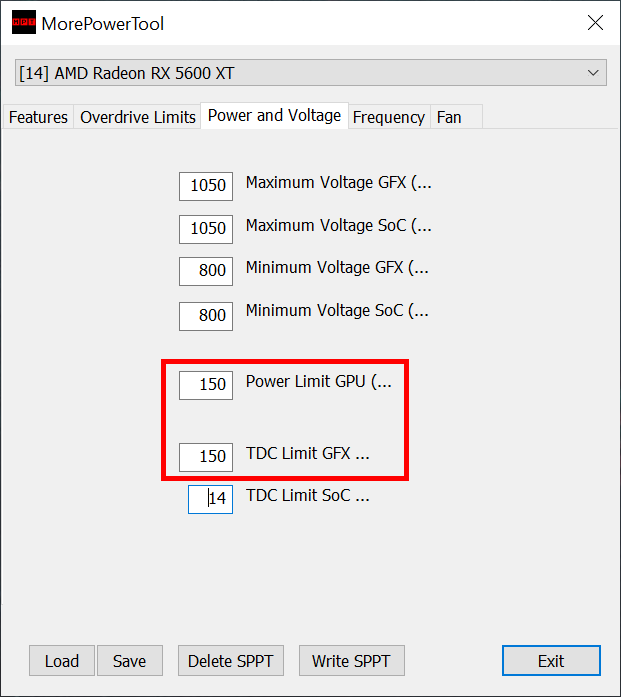
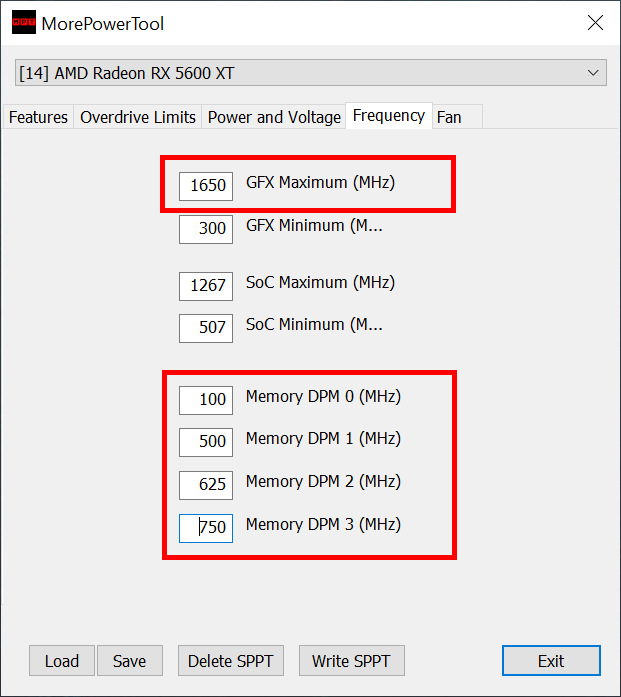
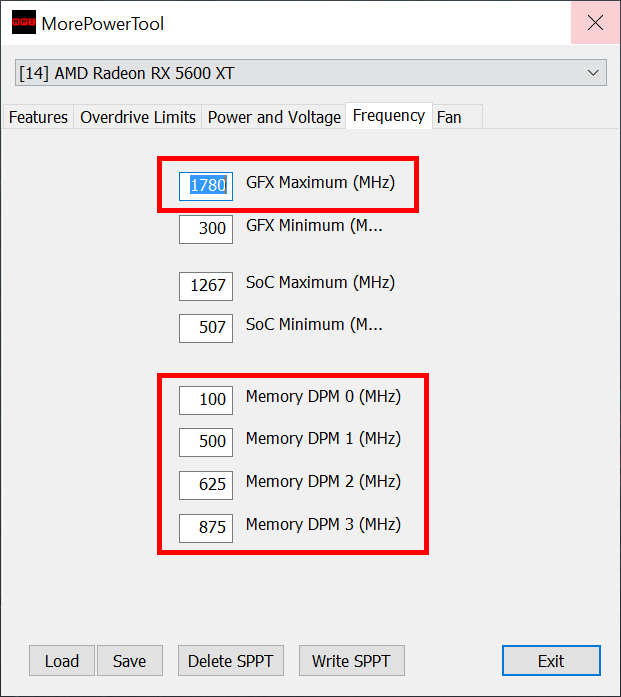
The four most important tabs of the MorePowerTool show a first overview of the individual BIOS settings:
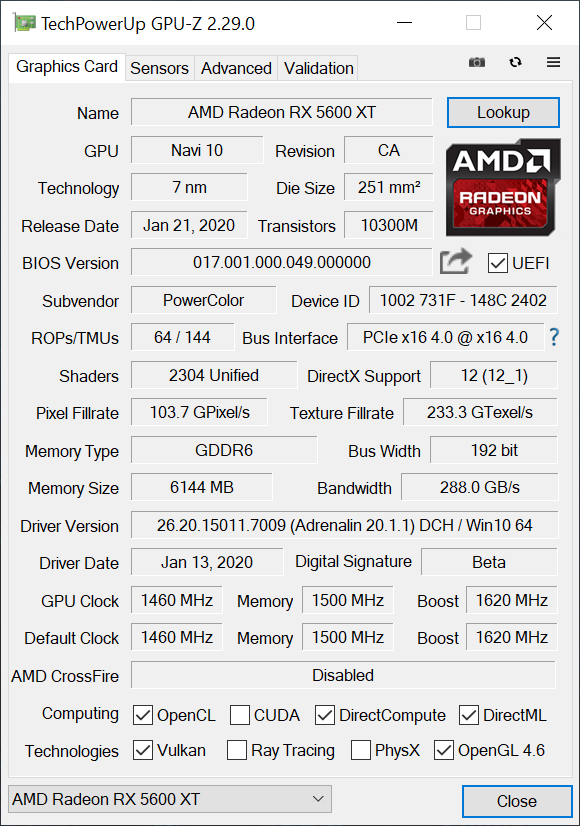
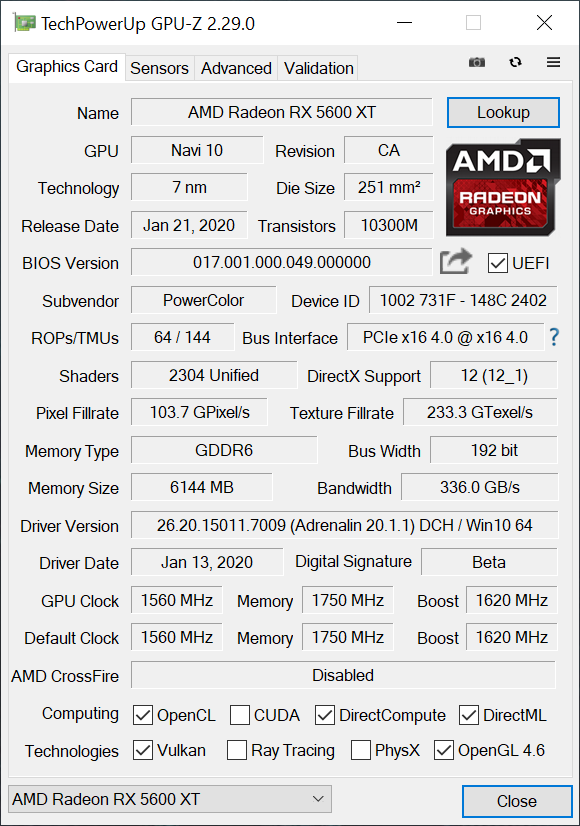
The obligatory GPU-Z screenshot of both BIOSes is also included:
Finally, the table gives a nice overview of the remaining technical data of the current and older comparison models:
| Karte | Powercolor RX 5600 XT Red Dragon |
MSI RX 5700 Gaming X |
AMD Radeon RX Vega 64 |
AMD Radeon RX Vega 56 |
MSI RTX 2060 Gaming X |
| Architektur (GPU) | Navi 10 | Navi 10 | Vega | Vega | Turing TU-106 |
| CUDA Kerne / SP | 2304 | 2304 | 4096 | 3585 | 1920 |
| (36 CU) | (36 CU) | (64 CU) | (56 CU) | 240 Tensor/ 30 RT | |
| Textureinheiten | 144 | 144 | 256 | 224 | 120 |
| Textur-Füllrate (Gtexels/s) | 233.3 | 248.4 | 395,8 | 330 | 330 |
| Basis-Takt (MHz) | 1560 | 1465 | 1274 | 1156 | 1365 |
| Boost-Takt (MHz) | 1620 (max.) | 1625 (typisch) 1725 (max.) |
1546 | 1471 | 1830 |
| Speicher | 6 GB GDDR6 12/14 Gbps |
8 GB GDDR6 14 Gbps |
8 GB HBM | 8 GB HBM | 6 GB GDDR6 14 Gbps |
| Busbreite (Bit) | 192 | 256 | 2048 | 2048 | 192 |
| Speicherbandbreite (GB/s) | 336 | 448 | 483,8 | 410 | 336 |
| ROP | 64 | 64 | 64 | 64 | 48 |
| L2-Cache | 4 MB | 4 MB | 4 MB | 4 MB | 3 MB |
| TGP/TBP | 135/150 W | 185 W | 295 W | 219 W | 160 W |
| Mrd. Transistoren | 10,3 | 10,3 | 12,5 | 12.5 | 7.2 |
| Die-Fläche (mm²) | 251 | 251 | 495 | 495 | 314 |
| Node | 7 nm | 7 nm | 14 nm | 14 nm | 14 nm |
Test system and software
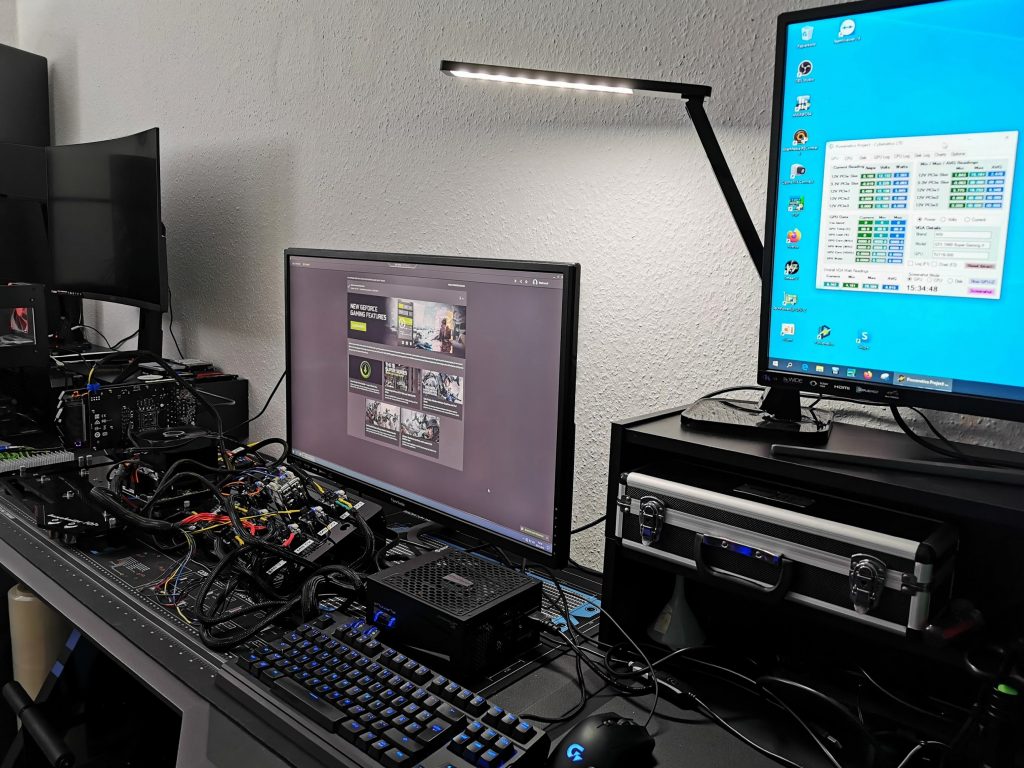
As always, I benchmark with my own PresentMon GUI and interpreter software, which fills the Excel charts and extrapolates the graphical output (and only that one) in such a way that all graphs are exactly long and thus a uniform and comparable time line is created. The remaining evaluations up to percentiles and bar graphs are based on the real raw data from the measurement. The benchmark system is new and has been upgraded in some areas. Also because of this I have all games and cards once again completely new measured and tested.
I have also summarized the individual components of the test system in tabular form.
| Test System and Equipment |
|
|---|---|
| Hardware: |
AMD Rayzen 9 3950X 4x 8GB G.Skill FlareX DDR4 3200 |
| Cooling: |
Alphacool Eisblock XPX Pro (AM4, 2066) Alphacool Eiswolf (modified) Thermal Grizzly Kryonaut |
| Case: |
Lian Li T70, Raijintek Paean Closed cCse / Open Benchtable |
| Monitor: | BenQ PD3220U |
| Power Consumption: |
Non-contact direct current measurement on PCIe slot (riser card) |
| Thermal Imager: |
1x Optris PI640 + 2x Xi400 Thermal Imagers Pix Connect Software Type K Class 1 thermal sensors (up to 4 channels) |
| Acoustics: |
NTI Audio M2211 (with calibration file) Steinberg UR12 (with phantom power for the microphones) Creative X7, Smaart v.7 Own anechoic chamber, 3.5 x 1.8 x 2.2 m (LxTxH) Axial measurements, perpendicular to the centre of the sound source(s), measuring distance 50 cm Noise emission in dBA (slow) as RTA measurement Frequency spectrum as graphic |
| OS: | Windows 10 Pro (1909, all Updates) |
- 1 - Introduction and overview
- 2 - Tear Down - Board design and cooler
- 3 - Shadow of the Tomb Raider
- 4 - Wolfenstein: Young Blood
- 5 - F1 2019
- 6 - Grand Theft Auto V
- 7 - Total War: Three Kingdoms
- 8 - Far Cry 5
- 9 - Tom Clancy's The Division 2
- 10 - Metro Exodus
- 11 - Power Consumption and PSU recommendation
- 12 - Clock rate, temperatures and infrared analysis
- 13 - Fan speed and noise
- 14 - Summary and conclusion









Kommentieren