


For the first measurements I used the Unigine Valley Benchmark and stopped the camera ride. This ensured me a constant load, which is indispensable for comparative measurements. Concrete benchmarks will follow later. First, I wanted to measure with the constant load how reducing GPU voltage affects clock, performance, and power consumption. For the first two measurements, I have the presets “Balanced” or “Balanced” respectively. “Saving power” in the AMD driver selected, after which I gradually reduced the voltage of the P7 state by 25 mV in the Wattman and recorded the corresponding values in tabular form.
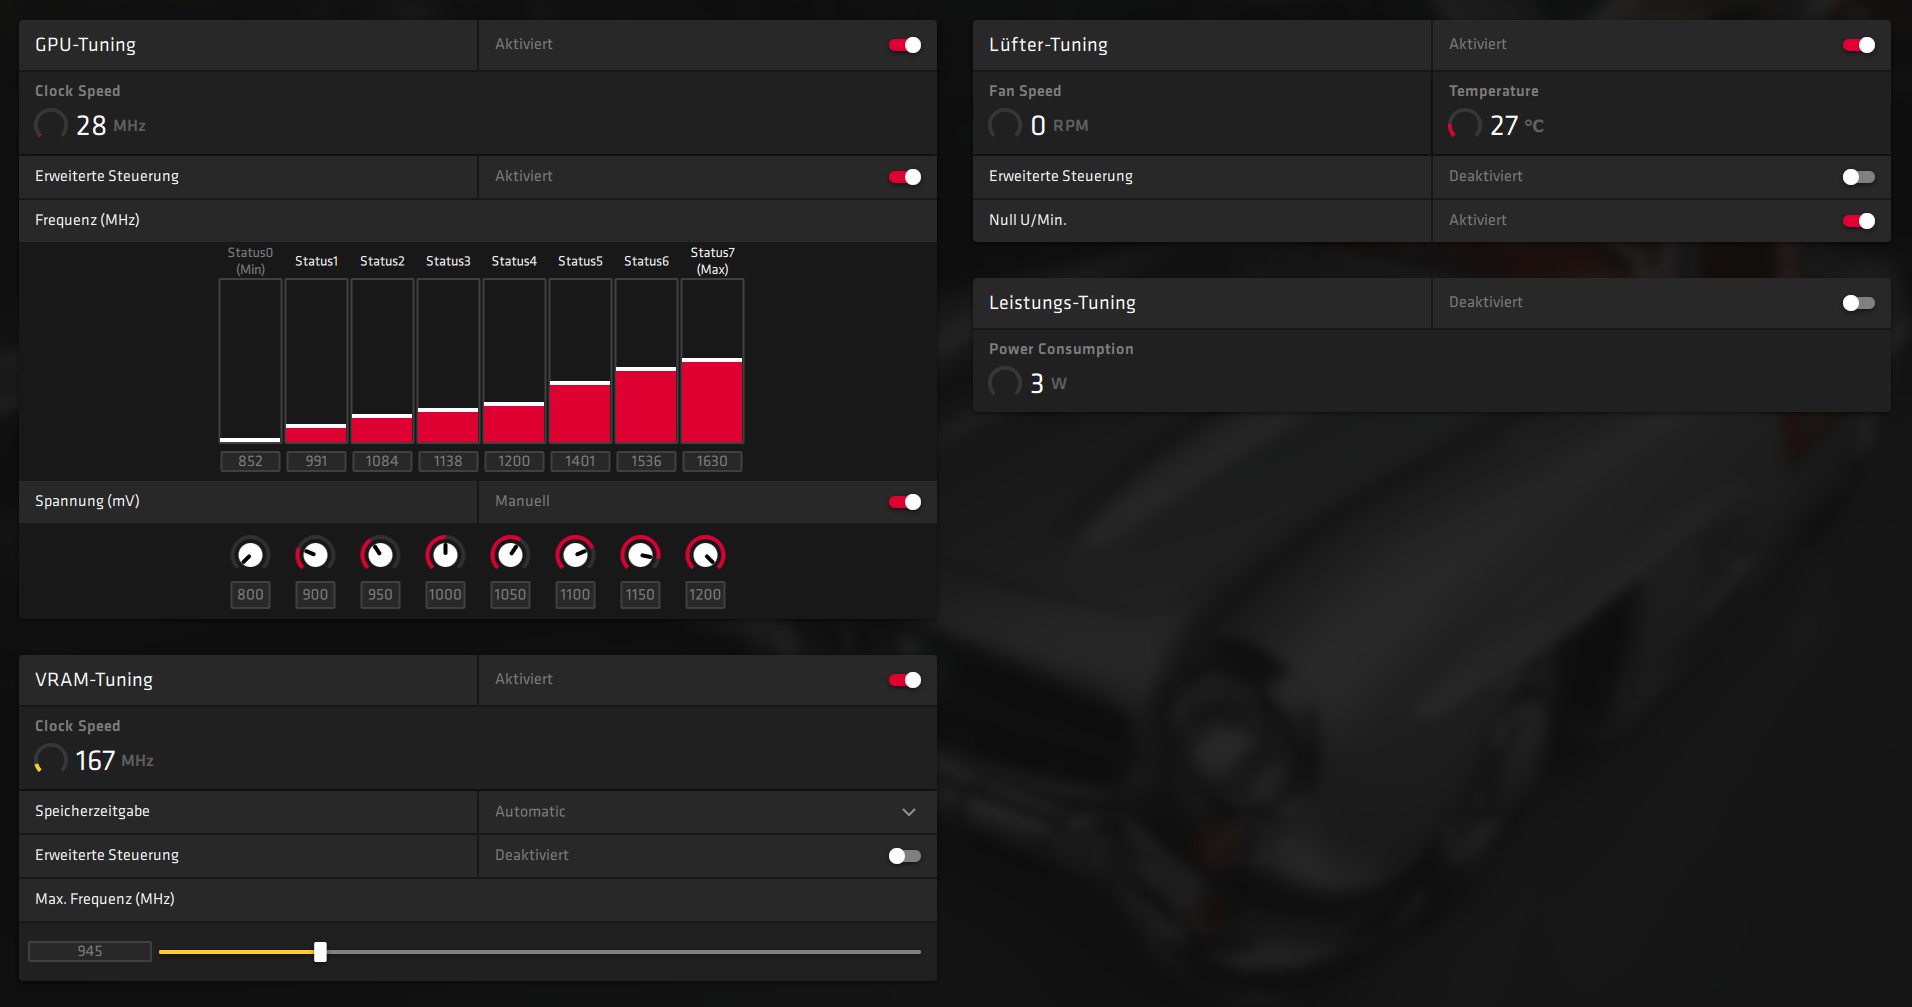
If the Wattman is too confusing, you can also use the OverdriveNtool…

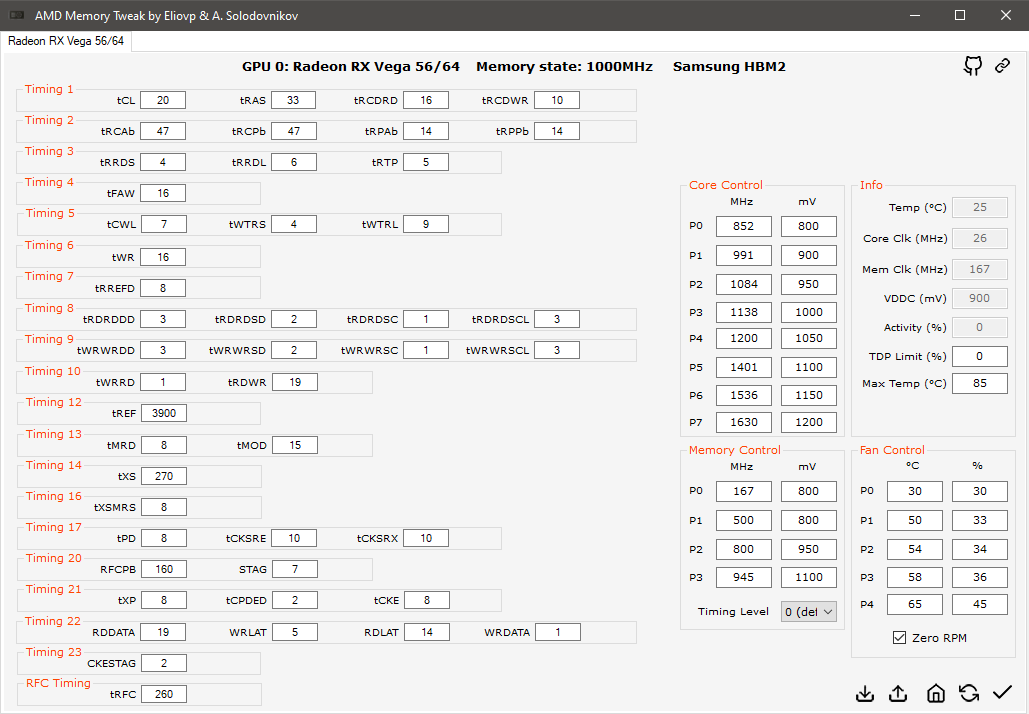
… or the HBM Tweak Tool.
The following table was used for the measurements:
| V set mV |
V read mV |
Clock MHz |
Fps | ASIC W |
System W | Setting |
| 1200 | 1144 | 1615 | 123 | 264 | 502 | Balanced = factory setting |
| 1200 | 1038 | 1514 | 118 | 199 | 410 | Power Saving Mode = -25% Powertarget |
| 1175 | 1125 | 1625 | 125 | 252 | 483 | Manual -25 mV |
| 1150 | 1100 | 1623 | 125 | 240 | 465 | Manual -50 mV |
| 1125 | 1081 | 1619 | 124 | 228 | 448 | Manual -75 mV |
| 1100 | 1056 | 1612 | 124 | 214 | 430 | Manual -100 mV |
| No matter how far I have reduced the voltage without changing the other values, the actual voltage does not go down further than 1056 mV. In order to lower the voltage even further, one could now lower the power limit, which would not be effective (explanation follows). The card should not be limited by the power limit for the measurement, but by the applied voltage. In the end, the lower power states had to be adapted. | ||||||
| 1025 | 988 | 1601 | 123 | 194 | 405 | |
| 975 | 938 | 1511 | 120 | 156 | 349 | |
At this point I stopped reducing the voltages because with higher load and falling voltage the clock would have to be lowered too far to ensure stable operation. The goal at the end of the day was to maintain a sufficient performance despite reduced power consumption. The energy savings of almost 150 W measured at the socket were already enormous and the standard cooler of the Nitro+ would probably already be able to cool the card almost silently. Considering the minimally reduced FPS, this is already a considerable increase in efficiency and now I wanted to investigate the claim that the graphics cards are even faster due to undervolting.
Does Undervolting bring more performance?
Since the load of the Valley benchmark is too low and the boost is generally very high, I used the much more demanding superposition benchmark (1080p Extreme) for the next test. The myth is that by reducing the voltage, the GPU clocks higher because it no longer runs as fast into its temperature and power limit. Is that true? Again, I created a consistent scene and gradually reduced the tension.
| V set mV |
Clock MHz |
ASIC W | |
| 1200 | 1484 | 264 | |
| 1150 | 1511 | 265 | |
| 1100 | 1594 | 256 | |
| 1025 | 1577 | 211 | Lower P-States modified |
| 975 | 1514 | 183 | Lower P-States modified |
Result: It’s true – the card actually clocks significantly higher when the voltage is reduced. But as you can see from the table, this game cannot be continued at will. A certain voltage must be concerned that the chip can keep its beat stable. How high the voltage must be for a certain beat depends on the quality of the present chip. I suspect that this quality varies greatly and amD has therefore generally applied a high voltage to ensure stable operation at the desired clock on all chips produced. Of course, this is pure speculation on my part – but I can’t explain the factory-high tension.
Optimization
After further measurements it turned out that the chip of my tested card has its “sweetspot” at about 1500MHz. This means that the combination of performance and power consumption in this area makes the most sense of use as a gaming graphics card. In order to achieve this, a target clock of 1597 MHz had to be set for P7 at a voltage of 975 mV. I’ve been using this setting for over 10 months and there hasn’t been any instability or driver crashes in any game. Although the card with the settings over 100 watts pulls less from the socket, in the worst case it is also lost up to 100 MHz core clock.
In order to avoid losing too much performance due to the reduced clock, something had to be optimized at another point and the unusual memory system of the card came into play here. If you haven’t dealt with the tuning of AMD cards before, you will have already noticed when reading this article that you have a lot of freedom when tuning Radeon cards and can adjust almost any parameter yourself. This also applies to the HBM2 memory. It is possible with freely accessible tools to manipulate every imaginable value – even down to the individual timings.
Vega thrives on its high memory throughput, and overclocking the HBM brings more performance growth in relative terms than overclocking the GPU itself. Unfortunately, the memory is not necessarily known for its high beat joy – but 50 to 100 MHz more are possible with most cards. In addition, further measurable performance growth can be achieved by tightening memory timings. However, memory tuning is a very complex topic and detailed explanations would go beyond the scope of this article as well as my competence. That’s why I’m going to do without it and instead show my final settings for 24/7 (“Eco”), lightweight OC and maximum OC and measure how they affect performance and consumption.
Final 24/7 setting (1500MHz GPU / 1000MHz HBM tREF 19500)
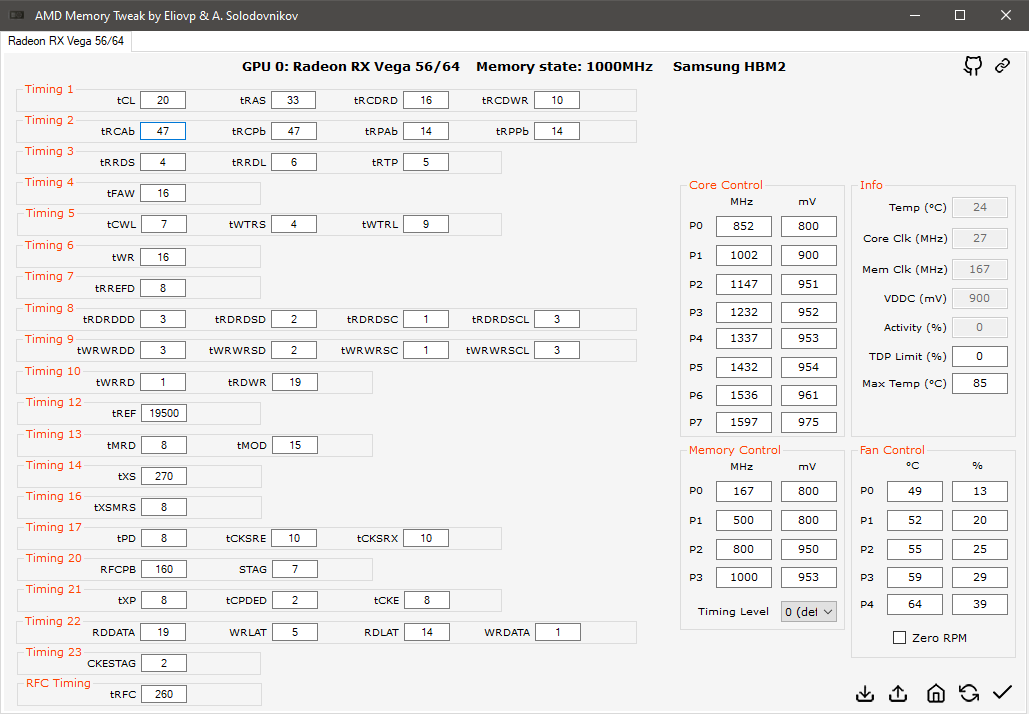
Final OC-Setting (1600MHz GPU / 1045MHz HBM – tREF 23400)
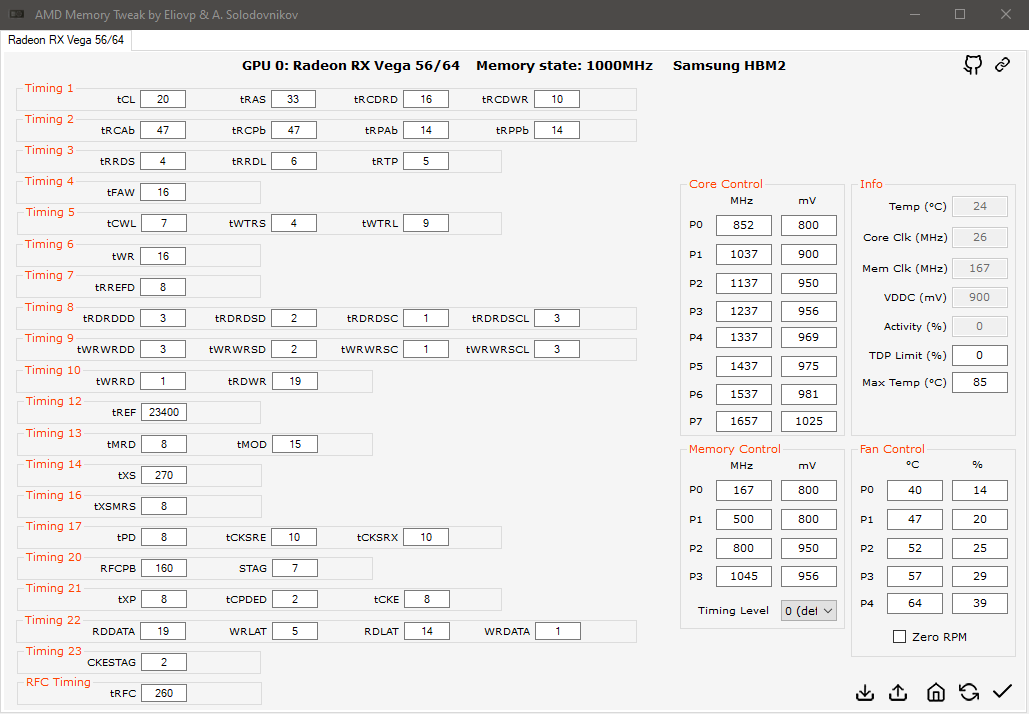
Max OC-Setting (1700+MHz GPU / 1075MHz HBM – tREF 31200)


Kommentieren