


Test systems and methodology
Let us now turn to the objective properties, the performance. First an overview of the test systems and the RAM configurations tested in each case follows. These differ between the test systems, firstly because the Maximus XII Apex only has 2 DIMM slots, secondly because the compatibility of the Hynix IC’s on the latest BIOS for the Maximus XII Apex seems to be limited at 4000 MHz, and lastly because with Ryzen, clocking over a 1:1 Infinity Fabric ratio effectively makes no sense, to spoiler a little.
Configurations with a 1:1 ratio between UCLK (memory controller clock) and MCLK (memory clock) are marked with “1:1”, those with an asynchronous ratio accordingly with “1:2”. With Intel, the identifier is logically omitted. Configurations with the prefix “DR” are dual-rank, i.e. they have two ranks per channel. All other configurations are single-rank, i.e. have only one rank per channel. The configurations with more than 4 specified timings have been extended with tRC and tRFC to show a simple additional tweak.

The configurations with “all-manual” were completely optimized by hand to the fastest settings that could pass a 24/7 stability test. For this purpose, the stability test tools used were TestMem5 with the “Extreme1@anta777” profile (one run) and Google Stress Test App via the Windows Subsystem for Linux 1.0 with Ubuntu 20.04 (gsat, 1 hour), where no errors were allowed to occur. The abbreviation “GDM” stands for Geardown Mode and describes the command rate, which is used by default when loading the XMP profile on the AMD system.
In order to be able to put performance and price in relation to each other, a Samsung B-Die RAM kit is also run through all benchmarks as a control sample. Specifically, it’s a single-ranked G.Skill DDR4-4000 kit with XMP timings 15-16-16-36 and 1.5V voltage, downclocked accordingly for a 1:1 Infinity Fabric connection. The kit can be recognized by the prefix “Control Kit”.
| AMD test system | |
|---|---|
| Hardware: |
MSI MEG X570 Unify motherboard (BIOS A82) Tested memory configurations: Nvidia GeForce RTX 3090 Founders Edition graphics card Superflower Leadex Gold 1600W power supply |
| Cooling: |
TechN CPU Waterblock AMD AM4 CPU block Alphacool NexXxoS ST30 480mm + HardwareLabs Black Ice GTX 240mm radiators |
| Housing: |
Open Benchtable |
| Periphery: |
Benq XL2720 monitor |
| Intel test system | |
|---|---|
| Hardware: |
Asus Maximus XII Apex (BIOS 1002) Tested memory configurations: Nvidia GeForce RTX 3090 Founders Edition graphics card Corsair HX850i power supply |
| Cooling: |
Supercool Computers Direct Core MARK 6 CPU block 2x 360mm HardwareLabs Black Ice GTX / Nemesis GTS radiators |
| Housing: |
Lian-Li O11 Dynamic |
| Periphery: |
Acer XB270HU monitor |
For better understanding, the 10900KF CPU is referred to as “10900K”. It should also be mentioned that both CPUs have been overclocked to their maximum performance possible with ambient Cooling, the 10900K with a static all-core OC, the 5950X with a dynamic OC using Precision Boost Overdrive. These settings were left the same for all benchmarks.
Synthetics – Aida64, Geekbench3
As in my last RAM review, let’s first look at the AIDA64 Cache & Memory benchmark and Geekbench 3. These benchmarks provide reliable theoretical indicators of performance, so that one can theoretically extrapolate performance in any other application on the basis of them, provided of course that one knows the relation of the two benchmarks to the respective real use case. Because at the end of the day, everyone uses their system a little differently, with different applications, different plugins, etc., in practice we can’t even come close to covering everything.
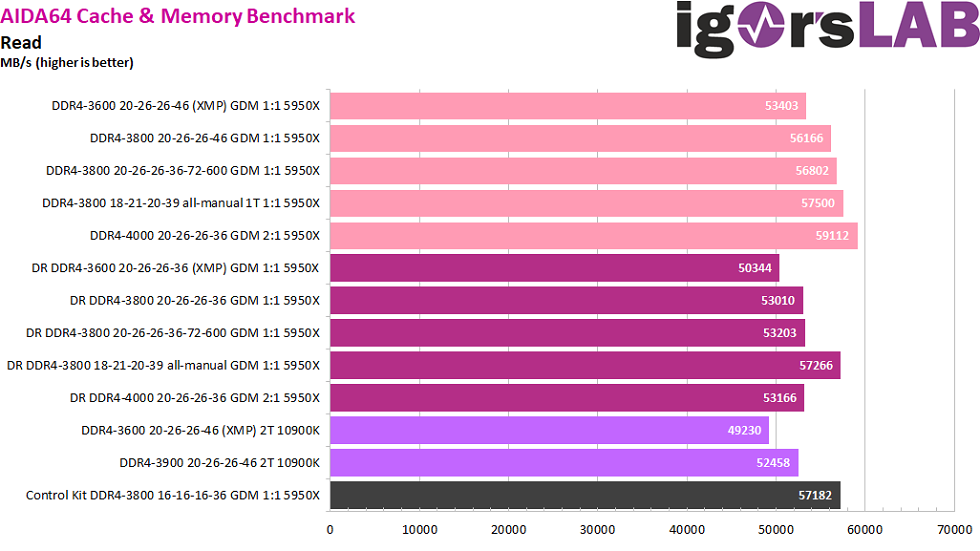
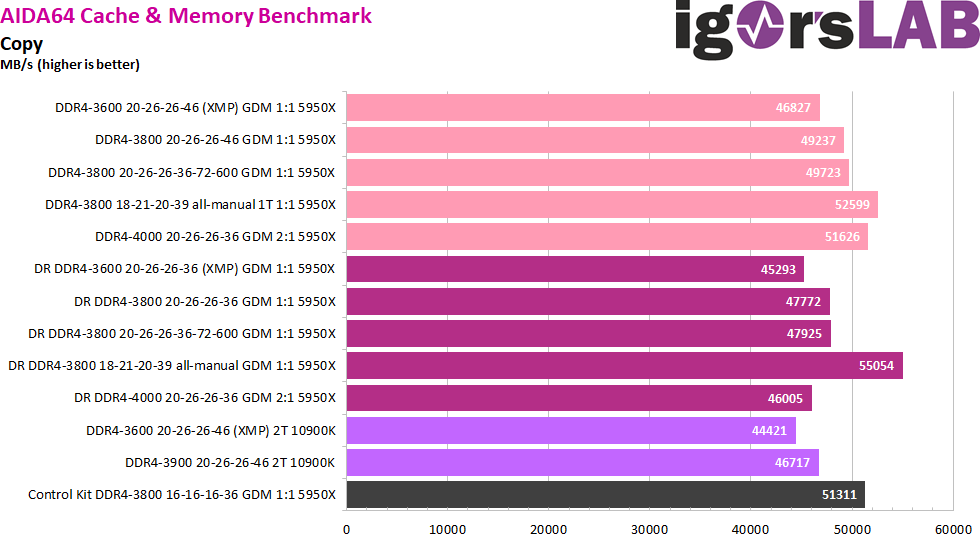
Due to the relatively loose XMP timings of 20-26-26-46 at a clock rate of 3600 MT/s, the performance initially turns out rather mediocre. Even with synchronous Infinity Fabric the kit only manages a good 50000 MB/s in read and write and about 5000 MB/s less in copy. The latency also suffers from the loose timings and Geardown mode active by default, resulting in a measured 67.6 ns.
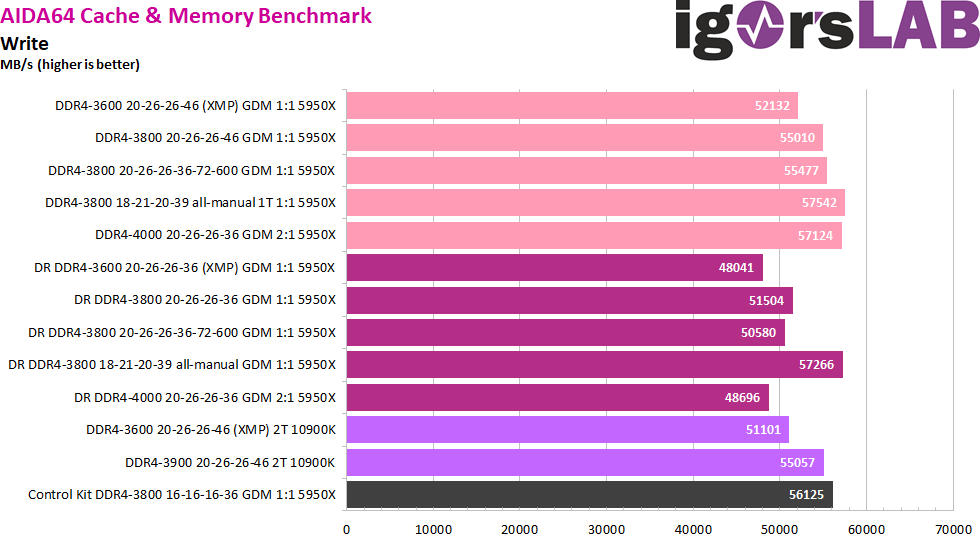
If we raise the Infinity Fabric Clock to the currently possible maximum of 1900 MHz and increase the RAM clock analogously to DDR4-3800, leaving the timings the same, throughput increases and latency shrinks proportionally. Also the voltages did not have to be adjusted for this, because the kit offers relatively large OC reserves outside of the XMP profile. If we now set the tRC to the value of “72” actually stored in the XMP profile and lower the tRFC to “600”, we get another small boost that can be achieved without much effort. The other secondary timings tFAW 40, tRDD_S 9 and tRRD_L 10 were already adopted or even undercut by both test systems on Auto.
The kit offers even more reserves to boost the clock to DDR4-4000 while maintaining the same timings and voltages. However, the 1:1 ratio of the memory connection to the Infinity Fabric (IF) must now be disconnected, effectively negating any previous performance gains. As mentioned at the beginning: With a Ryzen platform, any clock speeds that go beyond a 1:1 ratio don’t make sense in the vast majority of cases.
Currently the clock limit of the IF is 1900 MHz for mainboard and CPU of the test system with the latest BIOS and AGESA. Should the 2000 MHz promised at the Zen 3 launch be reached in the future by an update on the part of AMD or MSI, the kit at least has the corresponding reserves for DDR4-4000 up its sleeve already. Whether this is then also actually stable, one will have to test naturally again, of course.
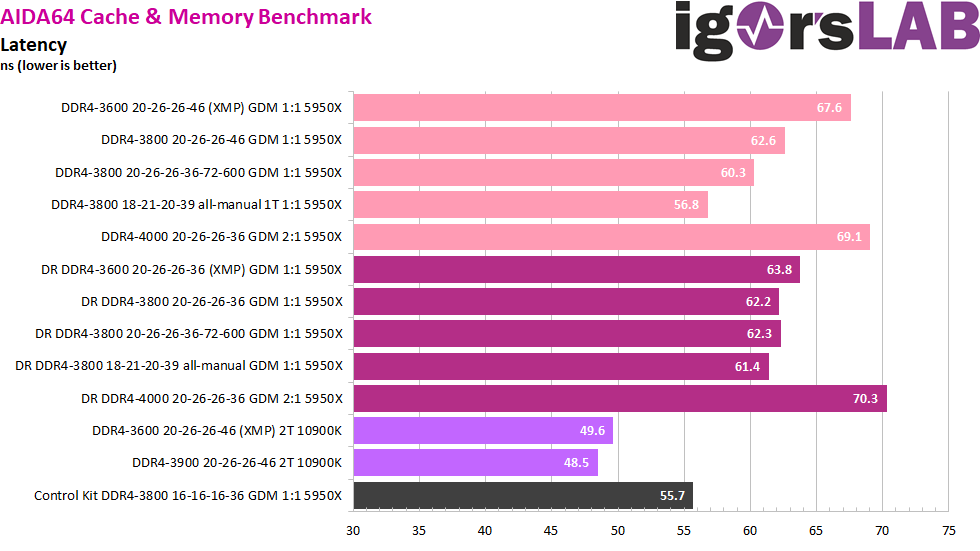
No big surprises await us in the latency test. The two 1:2 configs are clearly beaten off by the rest, again proving why you should stick with a 1:1 RAM connection with Ryzen. Due to its architecture, the Intel platform has a big lead in latency, which cannot be caught up even with maximum tweaking and tuning on Ryzen, not even with our Samsung B-Die Control Kit.
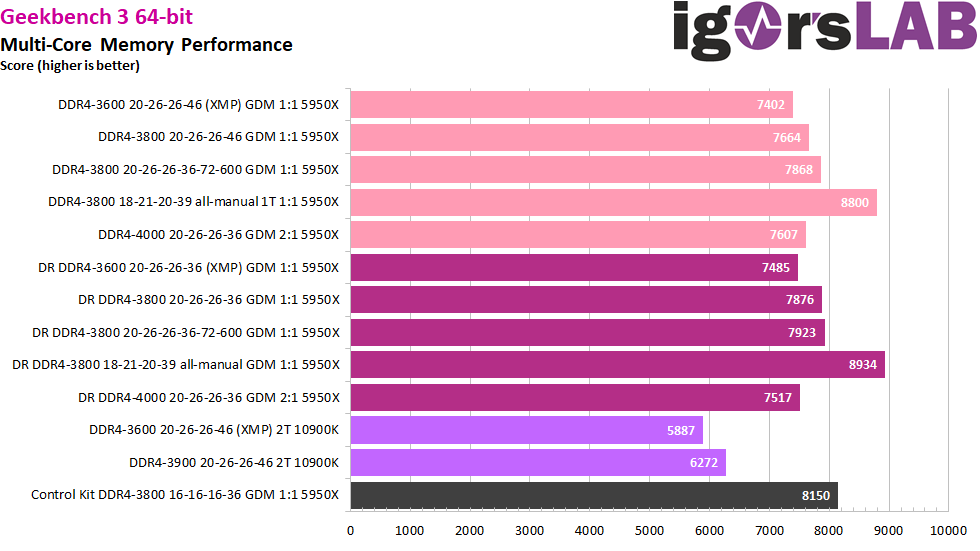
We can now only get more performance out of DDR4-3800 by manually adjusting the secondary and tertiary timings. Said and done a few hours later, having made sure it passed the stability tests. This has again resulted in small jumps in read and write bandwidths and, most importantly, large latency savings. As a result of the lower latency, which is mainly due to the 1T command rate, the measured copy bandwidth is also considerably higher. In fact, in Geekbench 3, we can gain more than double the performance increase on top of all previous single-ranked results. The kit and the installed ICs have a lot of potential under the XMP hood.
Hybrid Benchmark – Procyon Photo Editing
As a new member in our synthetic family we may welcome today Procyon from UL. Procyon uses the Photoshop and Lightroom Classic tools from the Adobe Creative Cloud Suite and measures the performance of the system based on the editing time of predefined project workflows in these programs. Thus, the UL Procyon offers an interesting hybrid of real-world application and automatic result calculation with weighting.
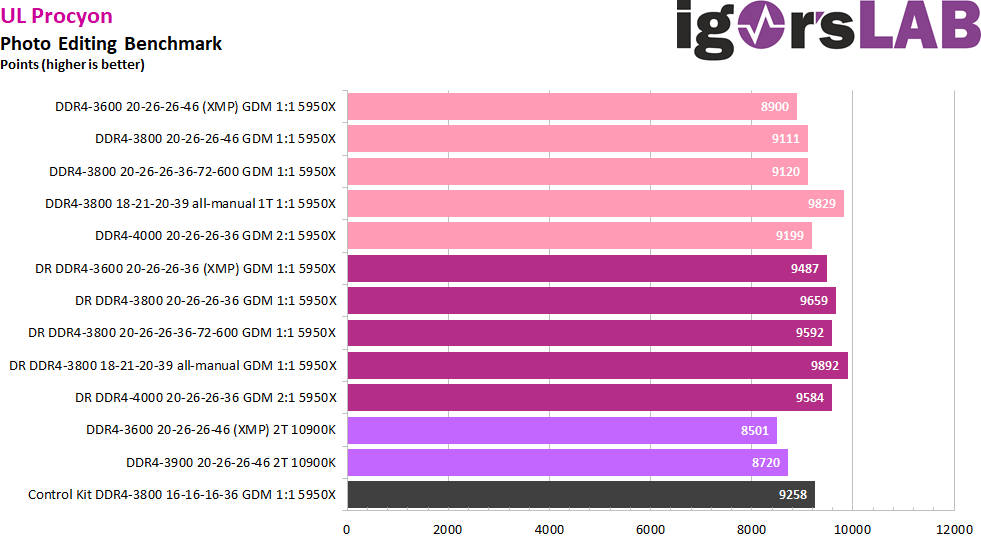
If we look at the results in points, it is especially noticeable that the dual-rank configurations, which seemed rather inconspicuous in the previous benchmarks, make a decent gain here, with a performance increase of about 6% compared to the respective single-ranked configuration. Intel is again at the bottom of the list, although to be fair we can only use the single-ranked results of the AMD system for comparison and the gap has also become smaller.


Kommentieren