


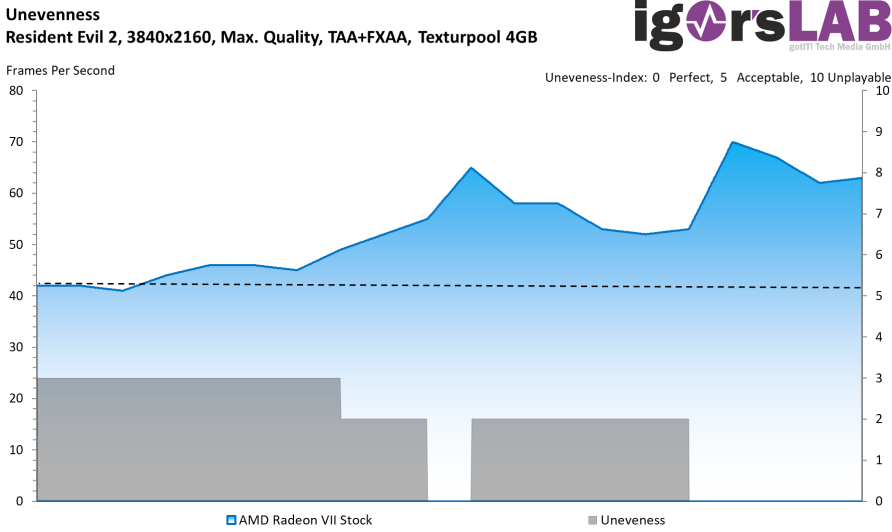
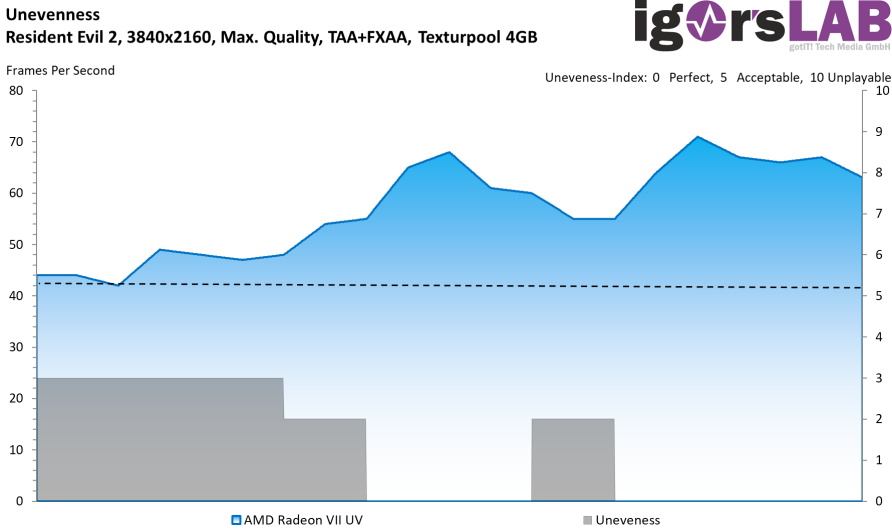
Resident Evil 2 with 3840 x 2160 pixels (UHD)
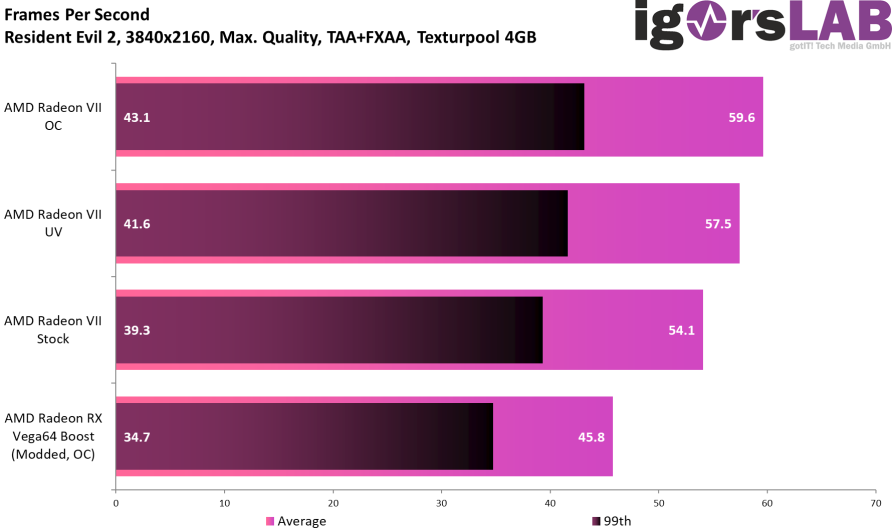
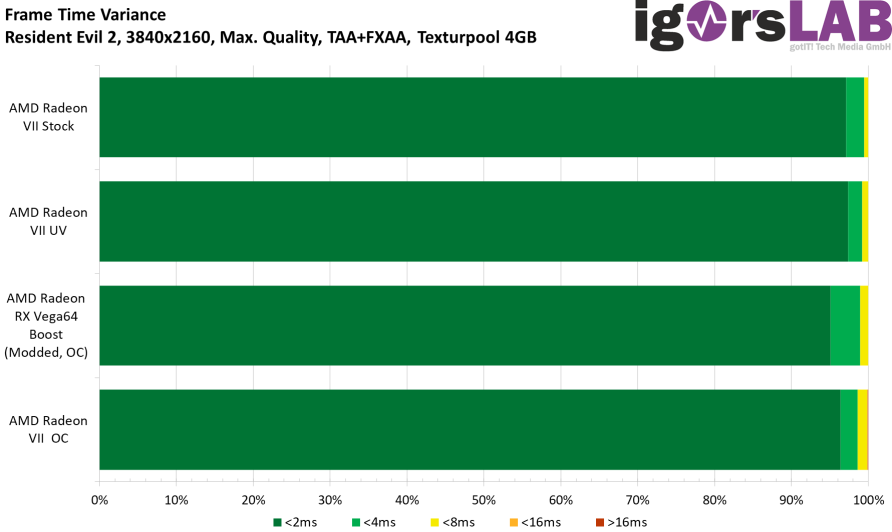
Three times Radeon VII and the Vega64 – all four cards remain in UHD on average below 60 FPS, but the overclocked card is only delicate. The performance in FPS is highest for the overclocked Radeon VII, closely followed by the UV version and the factory map with slightly more backlog. Interestingly, the variances of the factory map are best, which is hardly noticeable in the overall picture.
Evaluation in detail
Consider the average number of rendered frames per second (FPS) and compare it to the 99th percentile. However, this statement is only the beginning of the realization, because the details are not (yet) seen.
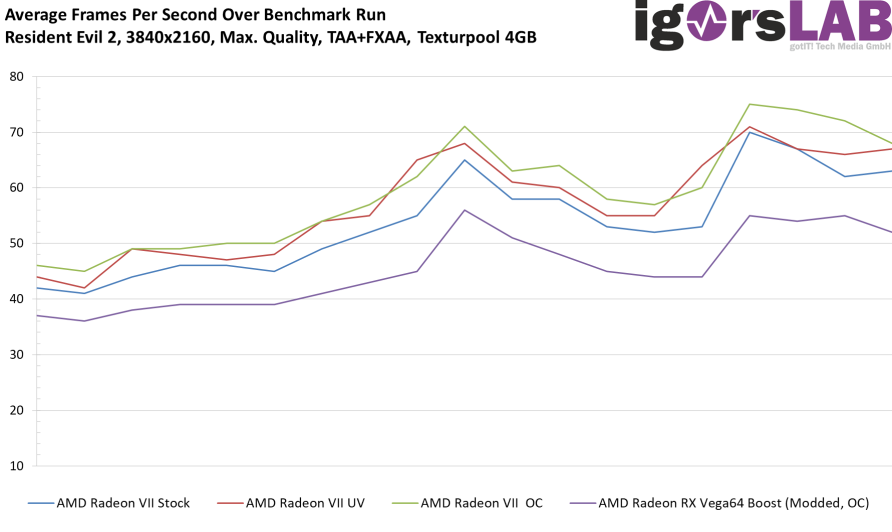
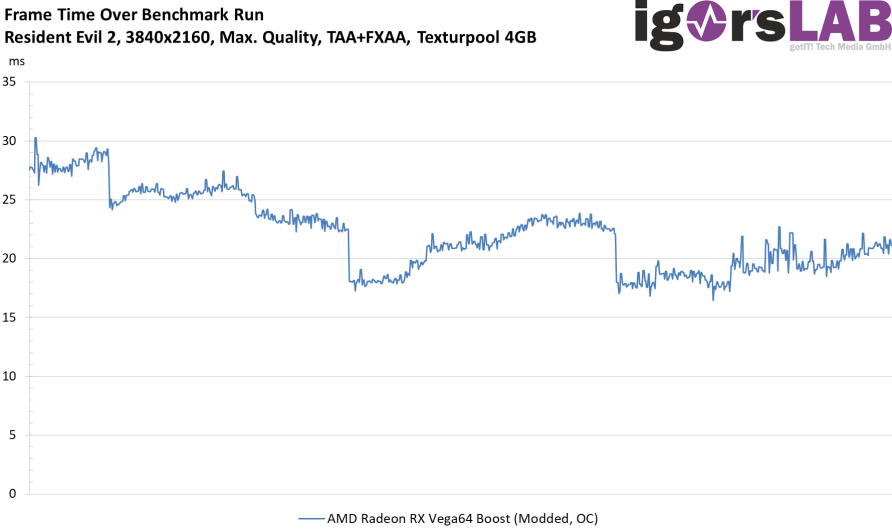
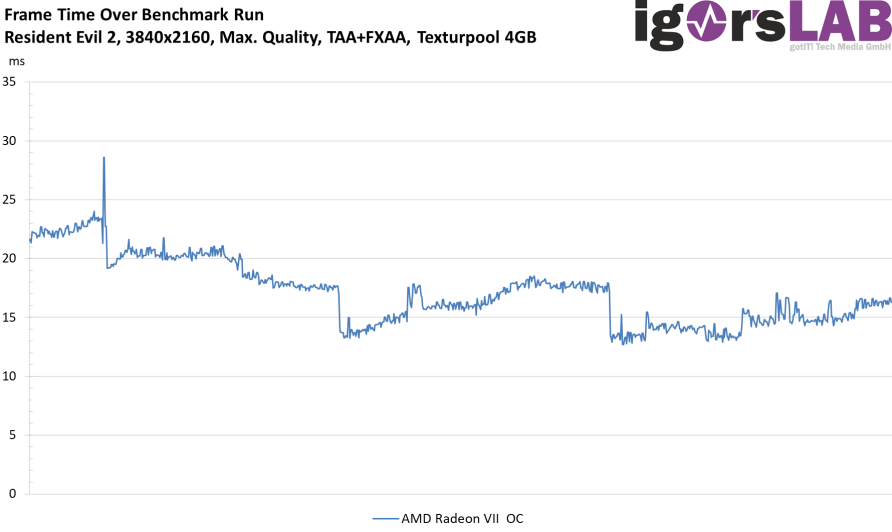
The next curve shows the FPS history over the entire time of this test run. Better, but still not detailed enough.
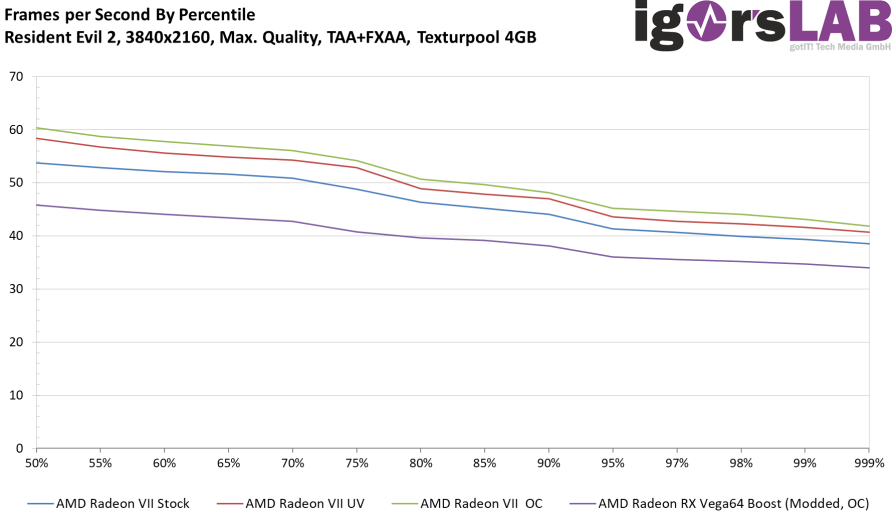
The percentile values help us to more or less ignore individual outliers in the recorded Frame Times. The full 99th percentile means that 99 percent of all readings in FPS are faster than the respective axis value in FPS. However, this can now also be broken down and presented as a curve, which one can finally calculate the 50th percentile, of which one can then claim that 50% of all FPS values are above this limit. The rest is in between and so you can generate a nice curve with stepwise calculation.
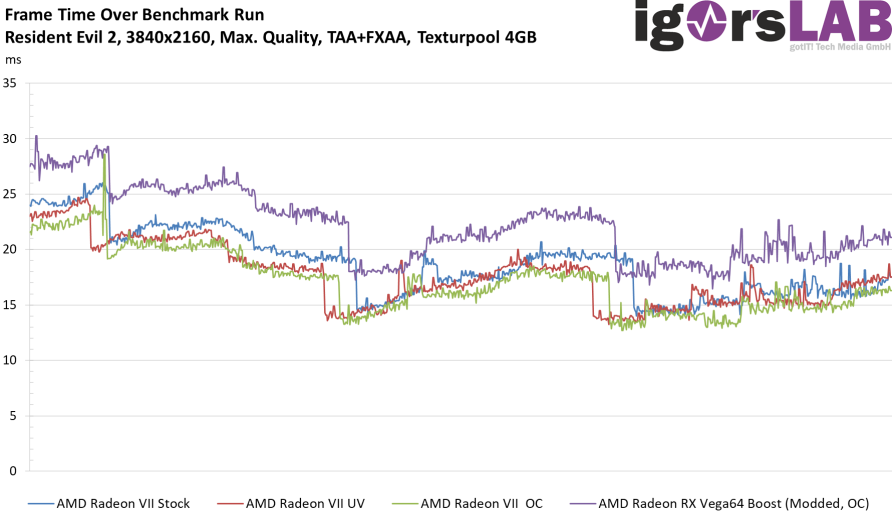
However, all these calculations with the FPS are based on an interval of one second, which is, however, rather broad. Because 60 FPS does not have to be 60 FPS when considering the consistency of rendering times for each single frame. We are still talking about the so-called variances. First, we lay all curves on top of each other for the rendering times of the single frames. The trick here is that different fast cards render a different number of frames over the same period and you have to take this into account.
The task is to find out the data set with the most frames and to interpolate all other measurement series in such a way (i.e. to supplement missing intermediate values) that the number of measured values at the end is the same. This means that you don't lose any data, you don't generate false results, but you can now set all measurement series to a uniform timeline (total benchmark duration) and display them graphically. This is important if, for example, all (or certain) cards show uniform behavior in the same place, because this also allows clear conclusions about the render load. This also detects software-related "outliers".
Now, of course, such closely overlapn curves are not very good to compare and analyze, which is why I have to resort to another bar chart, which now compares me to the percentage of real rendering times.
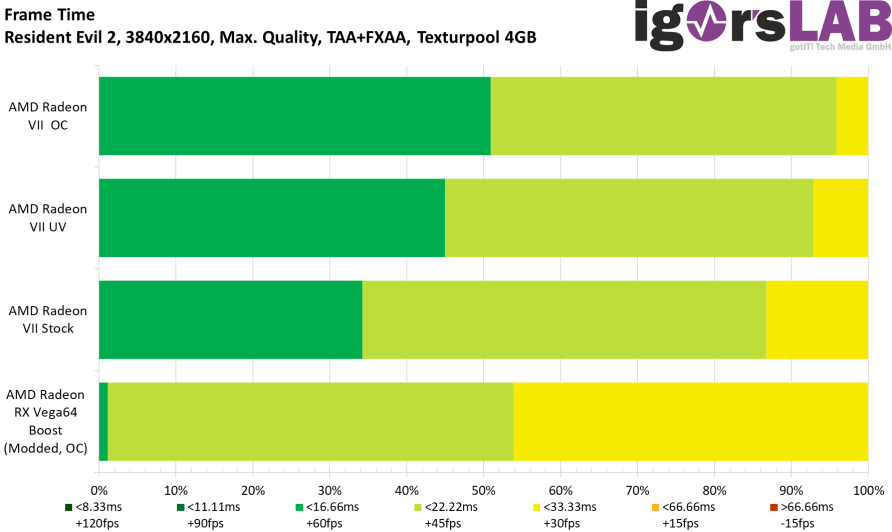
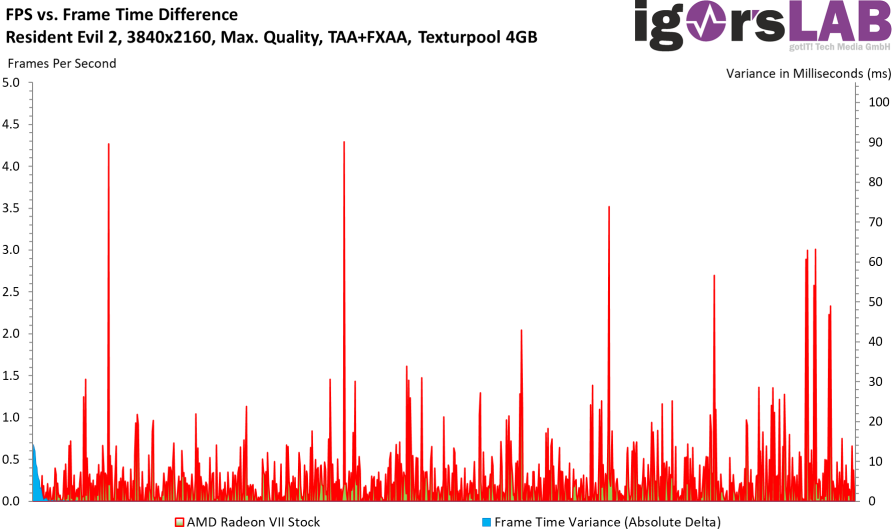
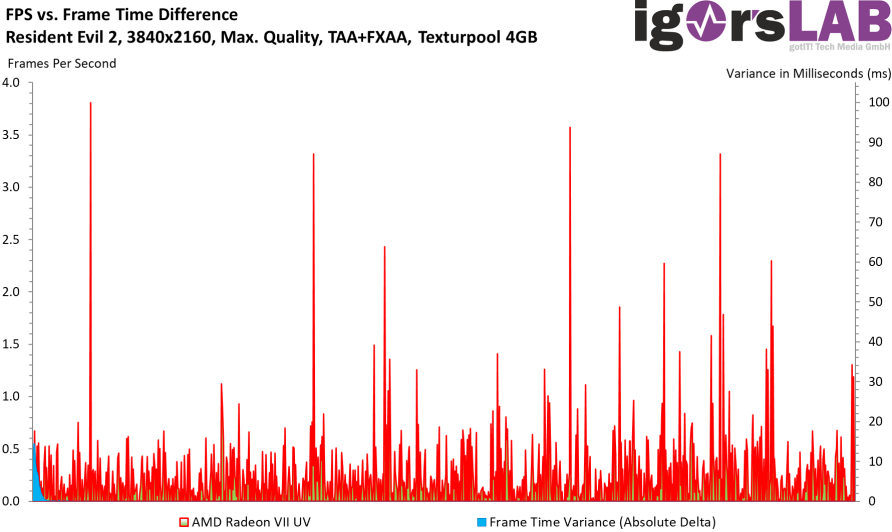
Which would have brought us to the rendering quality and the so-called variances. Here we are similar to the percentiles, but with much higher accuracy and expressiveness, because it marks the time differences in the rendering times of successive frames! The more balanced the result, the more "round" and "softer" a game runs. It doesn't bounce or jerk. For the recurring outliers, which sink into the average values of such a long second interval, are mercilessly exposed here.
The following gallery now shows us the real rendering times (Frame Times) of each card in a separate graphic. It can't be clearer, because you can scroll through and compare, but now nothing covers up or Overlaps.
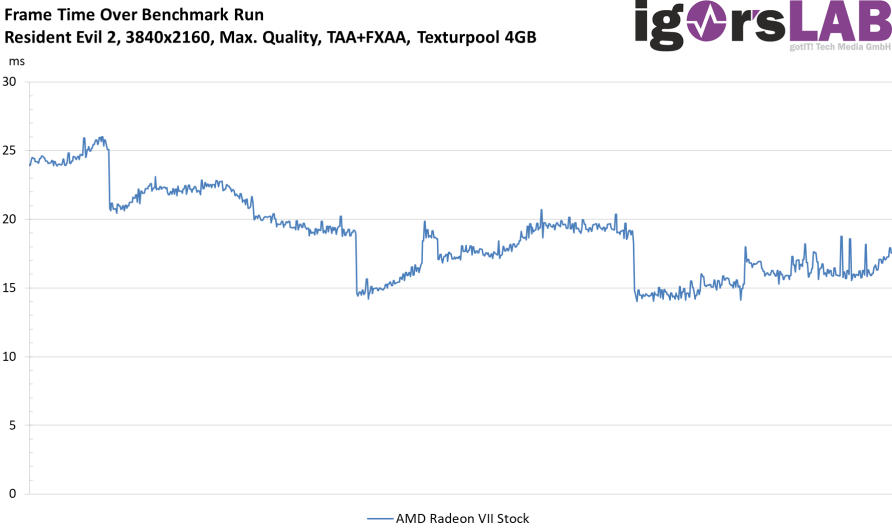
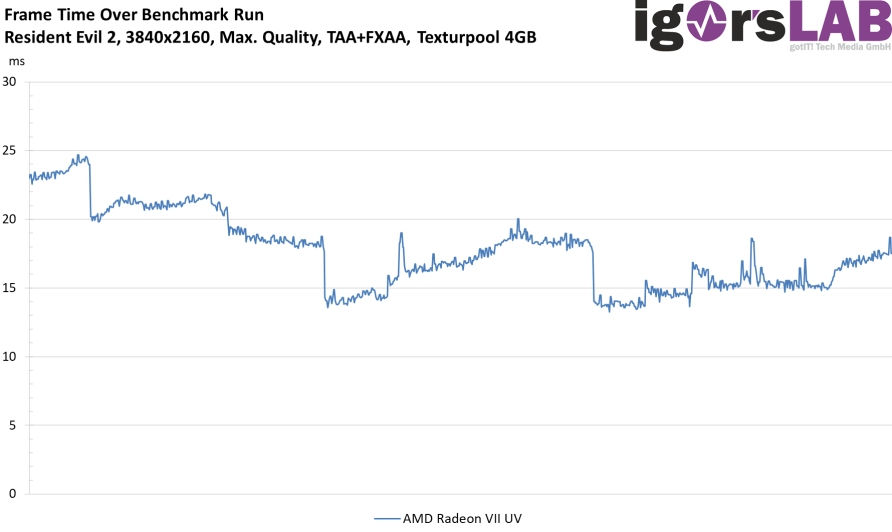
The following gallery shows the curves of the variances, which could also be called a jerk curve.
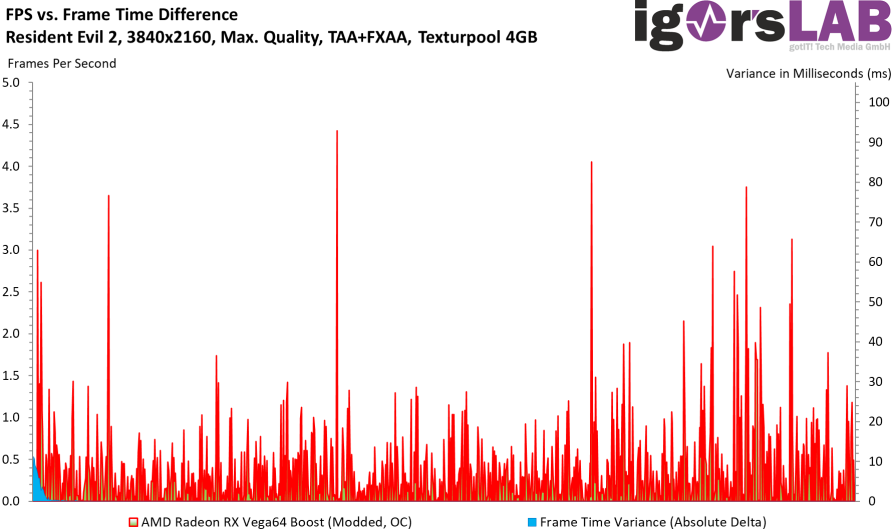
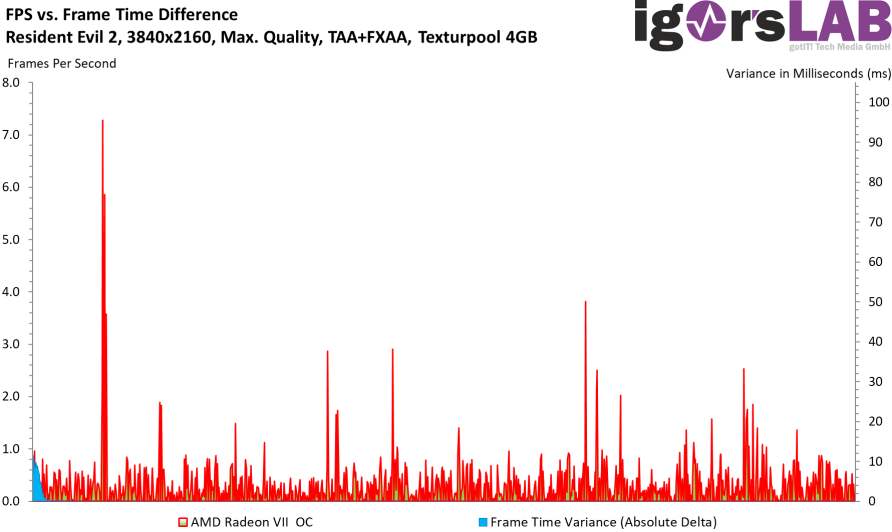
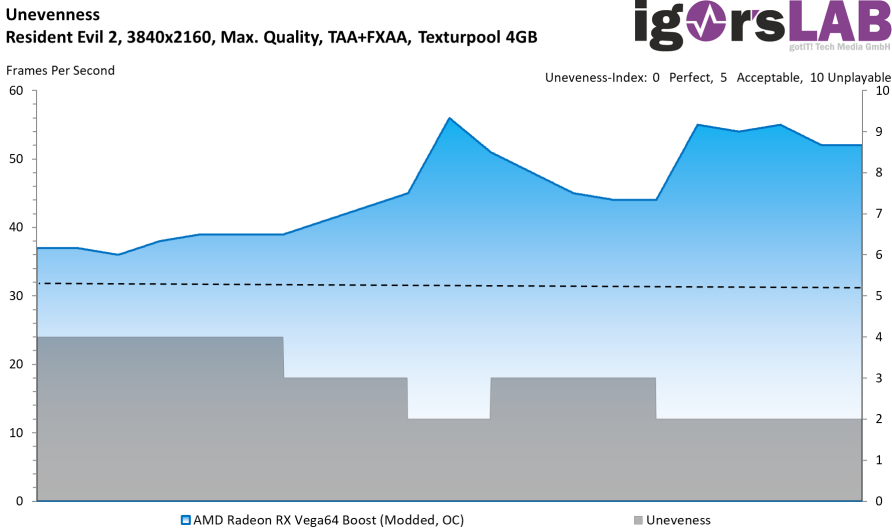
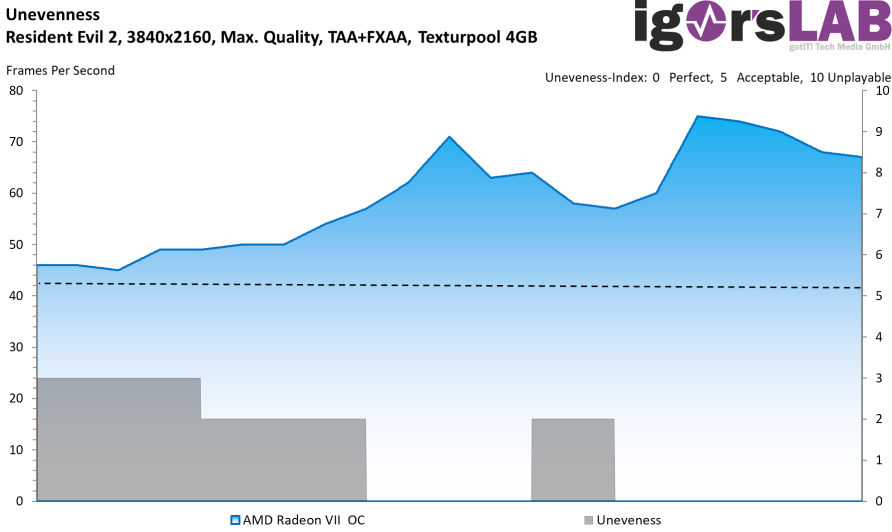
And in order to summarize this again and to link it with the FPS, I still have the so-called Unevennes index, which shows me how playable such a long second really was, if one assumes the subjective feeling of "roughness". The higher the so-called "unevenness" value, the more jerky the impression within this second. So I compare the FPS curve history shown at the beginning with the analysis of the detailed rendering curve of each frame in the FPS values. Ideally, you don't see a second curve and the index value is zero.
Sapphire Radeon VII, 16GB HBM2, HDMI, 3x DP, full retail (21291-01-40G)
- 1 - Einführung und Testsystem
- 2 - Wolfenstein II - UHD
- 3 - AC: Odyssee - UHD
- 4 - Prey - QHD
- 5 - Prey - UHD
- 6 - Resident Evil 2 - QHD
- 7 - Resident Evil 2 - UHD
- 8 - Sniper Elite 4 - QHD
- 9 - Sniper Elite 4 - UHD
- 10 - SW Battlefront - QHD
- 11 - SW Battlefront - UHD
- 12 - Sudden Strike 4 - QHD
- 13 - Zusammenfassung und Fazit


Kommentieren