


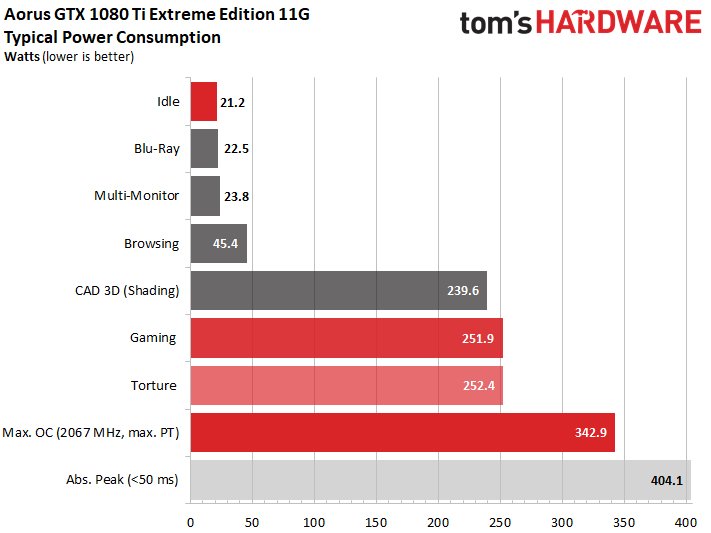
When it is up to the power, we first need to know that the card with the factory settings at 250 watts has been set a very reasonable limit. This Power Target is of course fully exploited in gaming and stress testing. The increase in the afterburner to the real-actionable maximum of approx. 340 to 350 watts (or up to the theoretical upper limit of 375 watts) is almost too much, because the card gets really faster up to a target of 330 watts. The rest is suitable for the global warming category, as long as you can't press the GPU temperature well below 40°C with a very potent water cooler. But with an AiO solution, that's not going to happen.
We must point out at this point that our sample has a special feature that manifests itself at very low voltages per clock, so that the average required voltage is almost 80mV lower than with an average map with rather moderate Chip quality. However, the boost clock does not increase excessively due to the enormously high chip quality, but the card only needs slightly lower voltages.
Thus, the benchmark behavior is largely identical to "normal" maps. Only power consumption and temperatures can be slightly better. However, it is a normal retail card from the distribution, not a press copy specially selected by the manufacturer for us. We finally got lucky with the CPU lottery!
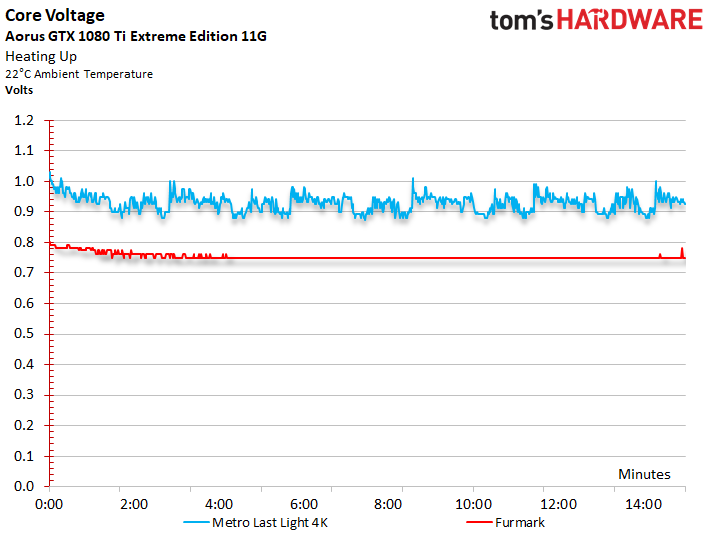
With the tensions, we see the reason in direct interaction with the warming of the map. If the initially already noticeably low 1.012V is at the beginning, the value drops further in the course of the heating to a maximum of 0.95 volts, but can be even more significantly lower if the utilization of the GPU increases sharply in places. This effect can also be seen in the Torture Loop, which is much, much deeper. This is not typical, but it also shows how well a chip can act when you draw the big lot.
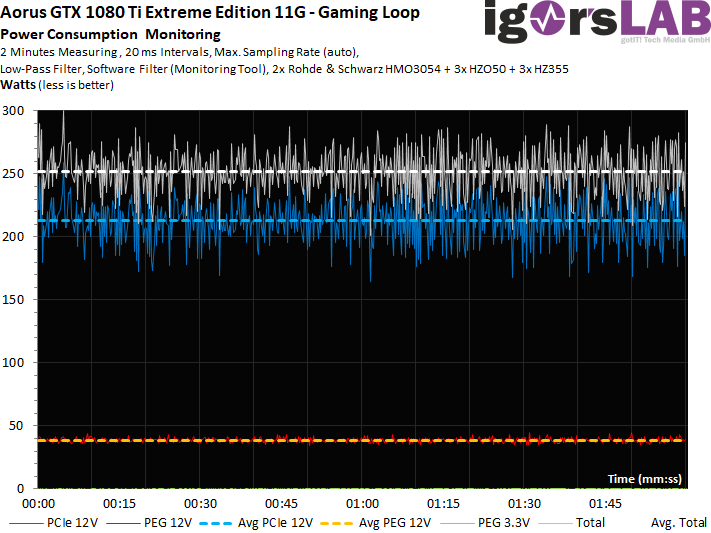
More about the gaming loop
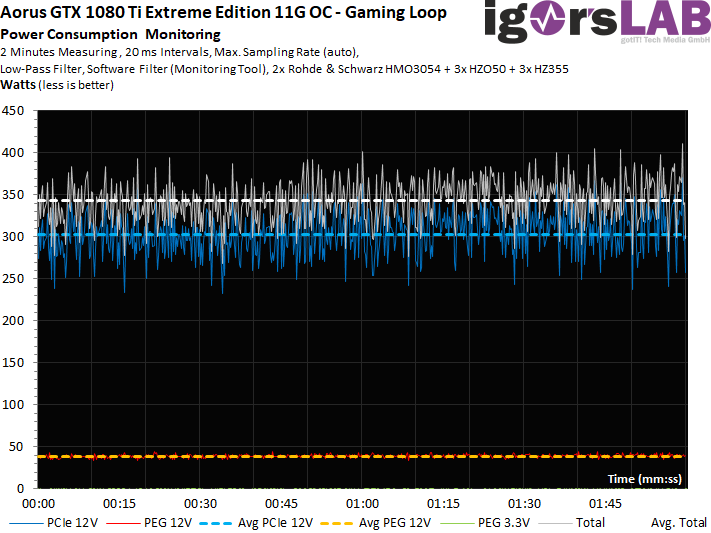
Let us now consider the curve for the power consumption separately according to the individual supply rails (rail) in a higher resolution over the period of two minutes. Despite our intelligent low-pass filter, some spikes remain visible, which can then be used up to approx. 300 watts. On average, however, the card is at the level of the reference card, despite the higher boost clock.
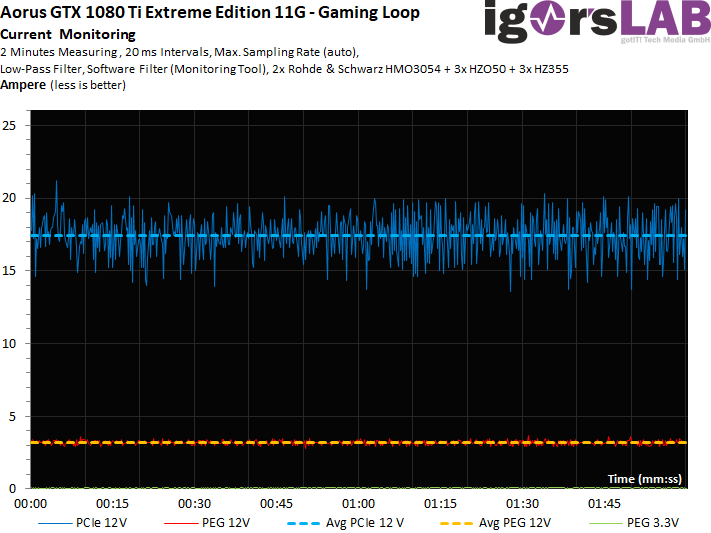
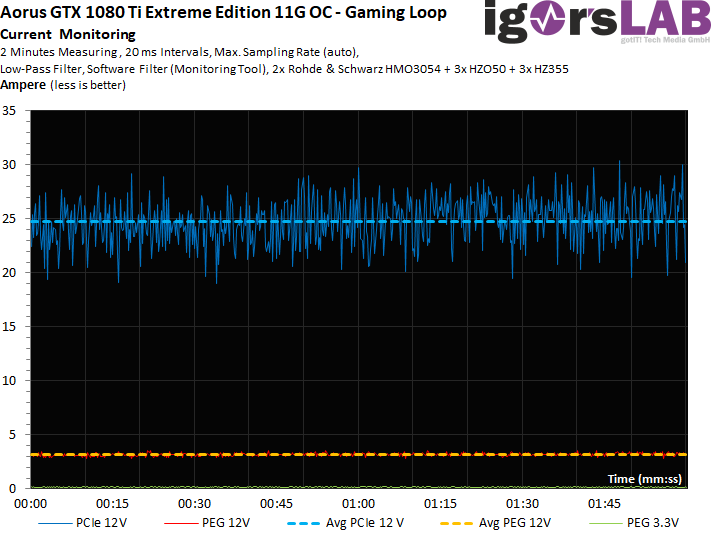
For this purpose, the curves of the currents look identically hectic:
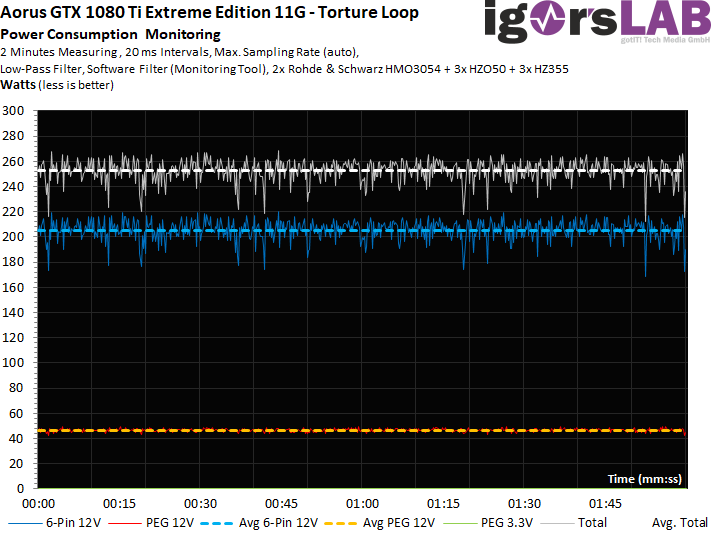
Torture test in detail
Since the load is more constant, the power consumption increases again somewhat as an average value, but the peaks are almost completely eliminated. We see very nicely where Boost is already starting to reduce the power consumption.
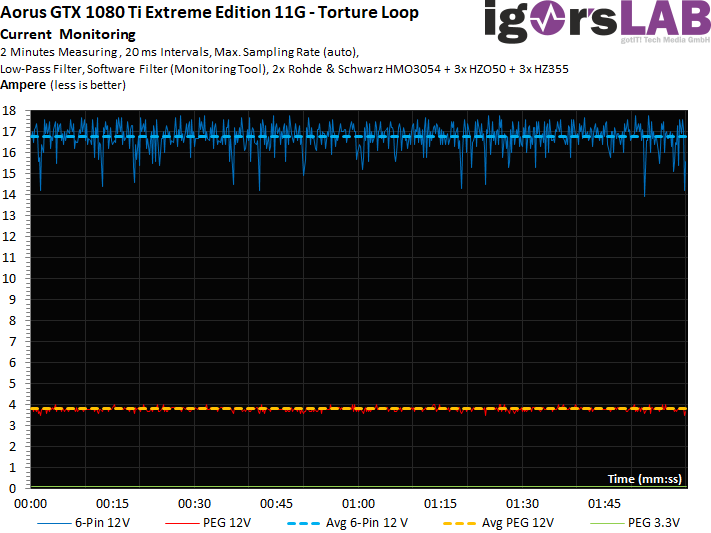
Again, analogously, only the view of the flowing currents:
Limits: Maximum OC and Stress Test
If you increase the Power Target to the set maximum of 375 watts, it will be just over 340 watts (depending on GPU quality and temperature). Then the curves become a bit more hectic and you can also see besides the tips also many incisions, which are due to limitations by Boost. After all, it can now go up to just over 400 watts, whereby the very short-term peaks of usable power supplies should still be handled easily.
The currents also show no abnormalities in terms of load distribution on the rails.
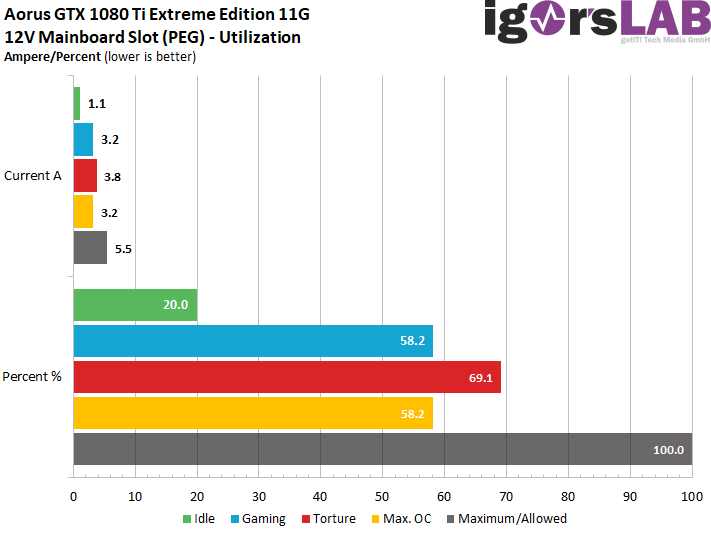
 Utilization of the motherboard slot
This point has been repeatedly demanded by readers since the launch of the Radeon RX 480 (also for Nvidia cards), so we will now include this point in every test. With the card tested today, however, the concern is unfounded, because the slot is used only very moderately and Gigabyte also bent to take the standard recommendations of the PCI SIG consciously seriously. From the point of view of balancing and the very expandable power target, this is certainly a good decision.


Kommentieren