


Rendering times of the single frames
The subjective feeling now becomes the focus of our considerations. In order to get as undisturbed a gaming experience as possible, players naturally want the possible smooth and delay-free output of the individual images. And although you have to evaluate both – that is, the performance and the smoothness – in the context, we can also look at both statements separately for good reason. So let's start with the simple frame times, which is the rendering time for each frame.
Variances
Many roads lead to Rome, including this one. The differences of the rendering times shown are not a simple difference between the individual frames, but the result of a more complex calculation, in which unimportant spikes are filtered a little (smart low-pass) and at the end only the values which could affect immersion. This observation shows us very clearly that increasing FPS numbers do not necessarily contribute to immersive well-being, because outliers up to well over 100 ms are to be regarded as jerkers and dropouts and not only micro-jerks – and are also perceived as such.
Uneveness: The incorruptible "Ruckel-Index"
First, we take our determined frame times and calculate the real FPS (including the pro rated rendered frames within that second). This is virtually the foundation of our index listing. Because if there are only less than 30 FPS, you don't have to consider any of the frames of this second as playable. The same applies to the staggering up to 60 FPS, where the good to very good playability is important.
Of course, all this is still far too crude, but it shows the direction in which it could end up. Nevertheless, even in a really nice 70 FPS interval, a medium or larger rendering disaster in the form of a few, but grotto-bad frames can hide, which submerge in the rough FPS data, so to speak in the collective, but then the player into the Eye-jumping.
Therefore, we add an evaluation layer to the top and examine the rendering times of the individual frames as well as the differences between the respective frames for further evaluation. Aspects such as the first derivation of the functions for the creation of our curves (frame times, differences) as well as a kind of intelligent filter, which for example largely detects and filters out hard transitions in the game sequence, are used.
In fact, neighboring frames are also used as a plausibility check in case of doubt. Thus, a fairly accurate forecast can be made to what extent such an exception could also be visually perceptible (ruckler, whole dropouts). If this rating is higher than the base that we had already set for the second interval, then this one frame (or the affected frame sequence) with a higher, worse index value within its exact duration.
In the end, the assessment of the subjective sensation as an integer "disturbing or jerkindex" without flowing intermediate values in the form of decimal places is available. This rating ranges from level 0 (perfect, no disturbing influences), to level 5 (acceptance limit) to level 10 (real jerks, dropouts). More sensitive minds will be able to perceive micro-jerks from level 3 or level 4, which can become more and more amplify.
GeForce RTX 2080 Ti vs. GeForce GTX 1080 Ti
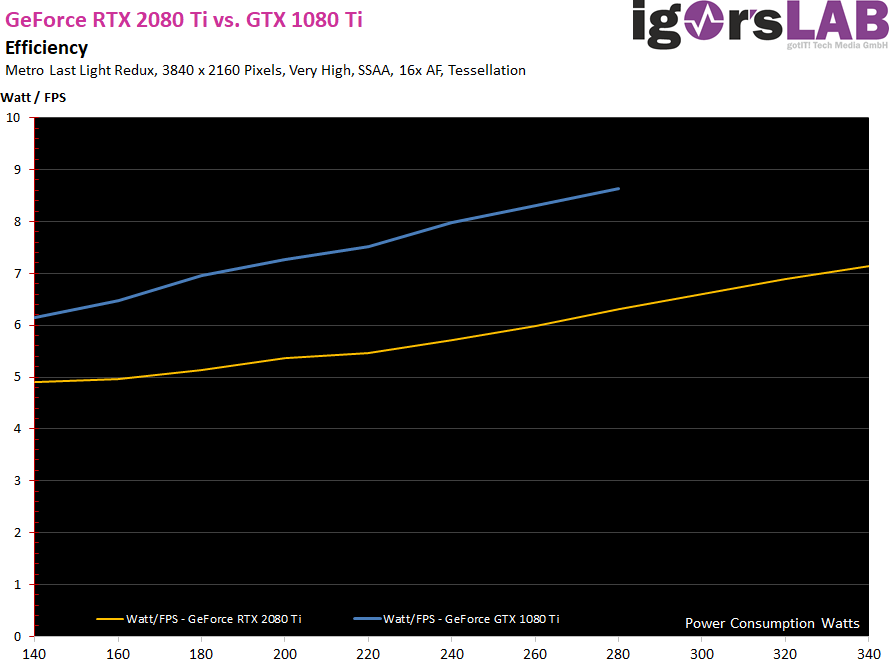
Pascal is not the topic today, but I had already taken the trouble to write down the settings for the afterburner and also saved them. With the current drivers, I quickly let it all go through again for each watt stage and then made a comparison of how much watts you actually need per average FPS. What you can see very well from the graphics now is that the performance of the Pascal card does not scale as well with the increasing power consumption as the large Turing card.
Summary
If you really measure longer full-load sequences and then compare these measurements for power consumption with the actual performance values achieved, then you can document the progress from Turing to Pascal quite visually. The curve for the watts used per FPS increases much more slowly at Turing and in addition to the performance advantage, you also have a significantly lower power consumption even with identical performance.
The difference is of course greatest in Ultra HD (which is why I chose this resolution) and I also dare say that measurements of the Turing card in WQHD or even Full HD would show significantly more disadvantageous results, because then the test system in begins to limit any form. A GeForce RTX 2080 Ti in Full-HD would be something like the infamous pearls before… Well, you know. The suggestion for this test came from the test of the Quadro RTX 4000 with the TU104, which was completely dimmed to 130 watts.
By the way, you could have taken an RTX 2080 for this review, but the bandwidth up to 340 watts would not have been useful and I would also have had significantly less memory available.


Kommentieren