


Important preliminary remarks and setup
At the beginning, of course, there was the consideration of how I should measure the whole thing as reproducibly and plausibly as possible. Do I take a mix of multiple games or just one with consistent results and a longer runtime? In the end, after many attempts, I opted for the latter, because it also reliably covers different loads over a longer period of time. The power consumption, graded in 20-watt increments, would have almost broken my neck, because it is really the average over the measured 170 seconds in Metro Last Light (Redux) and not just a snapshot.
In order to get this right, countless runs were needed, taking the trajectory of a benchmark to approach and touch at least faster by estimating. But the rest was still pure try and error and so the whole test for only one card took two whole days. But I think it was worth it. What was also important to me was avoiding any thermal limits and influences, so that I could stay consistently below 36 °C for the GPU to always achieve the highest boost step.
In the end, it all boiled down to the VGA test system with the core i7-8700K .5 GHz, with the DDR4 memory running at 4 GHz. And I run Metro Last Light (Redux) on Ultra HD and maximized settings to generate maximum GPU load. The CPU and substructure can thus be confidently excluded as a limiting factor. This must be enough as an introduction and we shall now come straight to the results, which give some interesting insights.
I run the memory of the card with 2150 MHz instead of 1750 MHz, in order to soften bottle necks a bit when overclocking. Various stability problems, however, have set the limit for the memory OC to 400 MHz addition, because it would be more, but the memory then also becomes increasingly unpredictable.
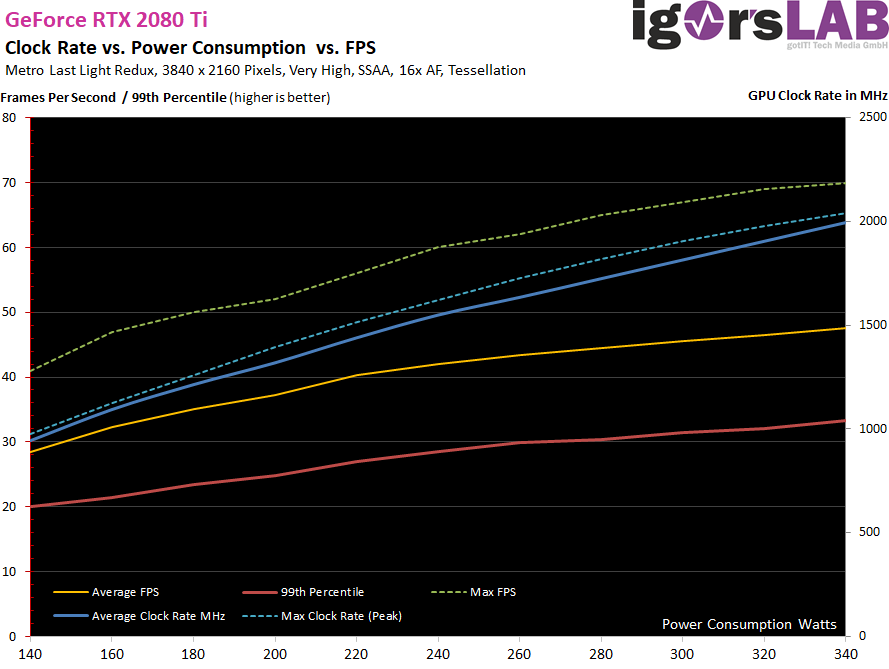
Performance and clock under maximum load between 140 and 340 watts
We see in the curve chart very nice ly that FPS and 99. Percentile from approx. 240 to 260 watts start to scale less than great with the average dread, which can still increase almost linearly over the entire power consumption range. What can also be seen beautifully is the fact that the boost clock to the top breaks down a bit in direct comparison. of course you could have pushed the game even further up, but that becomes rather unproductive.
Why I write this shows the bar chart almost more beautifully than the gradient curves. In this test I also hung my watered GeForce GTX 1080 Ti into the system and was then quite disappointed. With the 280-watt setting, I also achieve 2 GHz stable as an average over the entire run, which is what the GeForce RTX 2080 Ti also achieves at 340 watts. But in the end, this power consumption is exactly where the GeForce RTX 2080 Ti is located with approx. 160 watts. That, in turn, was more than just sobering. But I will also draw an efficiency comparison with Pascal on the next page, promised.
![]()
The history chart for the average FPS shows that there were no real outliers across the entire test tracks. The respective extreme values coincide with each card.
![]()
You can also see the whole thing very nicely by the percentiles, because the 99. Percentile alone doesn't make you completely happy.
![]()
The frametimes are always an interesting story, but here the curve chart is rather confusing due to the many entries. But there is a remedy for this on the next page, where I have inserted all the individual graphics for each setting and the GeForce GTX 1080 Ti.
![]()
But also the bar chart for the frametime sectors offers some interesting content. Above all, one can see nicely that the area below 22.22 ms grows almost linearly here, the increase of the extremely short rendering times of less than 16.66 ms would be rather small.
![]()
This of course also affects the sensation of smoothness and the "round" flow. Especially at low frame rates below 60 FPS, these differences can be seen subjectively from stage to stage more clearly than you might like.
![]()
For the individual graphics and the summary, you only have to turn around now.


Kommentieren