Normally, KFA2 positions itself with the cards of the respective performance classes rather in the most favorable range and thus shows some Pixel pharmacists the cold shoulder and where it can go long in the customer search, because many of these models have been among the absolute price/performance winners for years. But Asia is now ticking quite multi-layered and one cannot and does not want to close one's eye to the call of the RGB-believing community forever.
Of course, such a somewhat elaborately designed offshoot has its (slightly higher) price, but KFA2 still managed to reach the actual target group such as Aorus (i.e. Gigabytes Gaming Brand of the slightly better equipped cards) once again cheeky to annoy and undercut significantly in terms of price. The name "Work The Frames" has been chosen almost sarcastically and even somehow program, because in the end many competitors probably only a (badly) moody WTF gets stuck in the throat. Improved board, other fans on a slightly more powerful radiator – KFA2 has actually shoveled a decent everywhere, not only visually, but also. Especially at the back.
It is also interesting that this even puts you in direct competition with the products of the parent company (Palit/Gainward), whose products, however, are significantly less luminous, are priced on one level and yet are hardly significantly better in the end. With the WTF offshoot of the GeForce RTX 2070 Super, KFA2 is settling in this area in this country that others have identified for some time as an illuminated comfort zone and it will be exciting to see how KFA2 can hold its own here in the end – if. But you even have two independent RGB controllers on board, more on board later.
The TU104-410 of the GeForce RTX 2070 Super
The TU104-410 of the GeForce RTX 2070 Super is reduced to 2560 CUDA cores, 320 tensor cores, 40 RT cores, 160 TMUs and 64 ROPs compared to the full version TU104-400 on the RTX 2080. The number of GPC (Graphics Processing Clusters) varies between 5 and 6 depending on the chip and type of recovery. The card will have clock frequencies in the range of 1605 MHz (base clock) and 1770 MHz (boost) and can thus simultaneously deliver up to 9 TFLOPS computing power. The 40 RT cores can deliver about 7 giga-rays per second in ray tracing performance.
Like the RTX 2080, the RTX 2070 has super 4 MB L2 cache. Otherwise, everything I have already written in the launch articles for the GeForce RTX 2070 FE and the GeForce RTX 2060 FE applies. And if you want to find out more about all the RTX features in detail, please refer to my long basic article "Nvidia GeForce RTX 2080 Ti and RTX 2080 – what is really hidden behind Turing" on the subject of RT. This, too, is read-proof and certainly worthwhile.
The TU104-410 also receives the same 256-bit memory bus as the TU104-400, which has eight 1 GB GDDR6 memory modules with 14 Gb/s data rate, resulting in bandwidth of up to 448 GB/s. As with the GeForce RTX 2080, NVLink support is at least active with one link, which makes the card a little more attractive, because the RTX 2070 was not allowed to use this feature. The 545 mm2 chip chip contains 13.6 billion transistors. Compared to the GeForce GTX 1080 Ti with its 12 billion Transistors on 471 mm2 may seem like a lot, but we must also remember that the chip is cropped and large parts lie fallow.
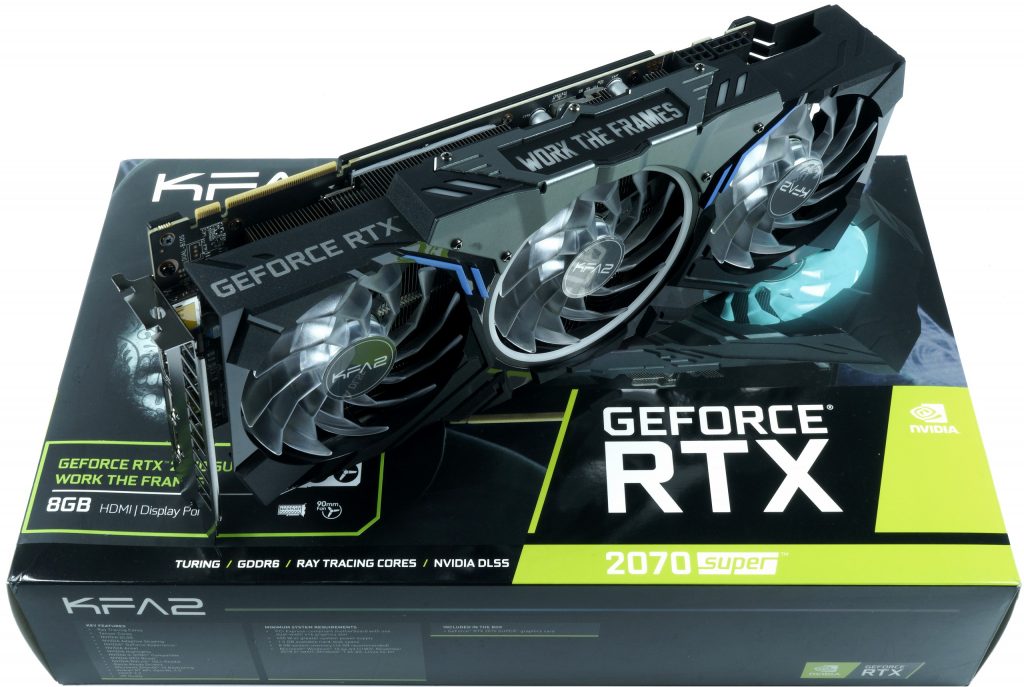
Die KFA2 RTX 2070 Super Work The Frames
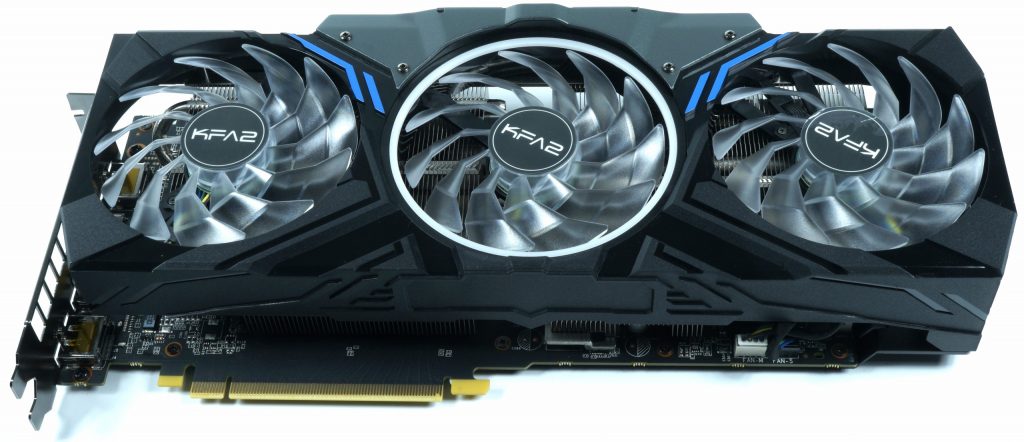
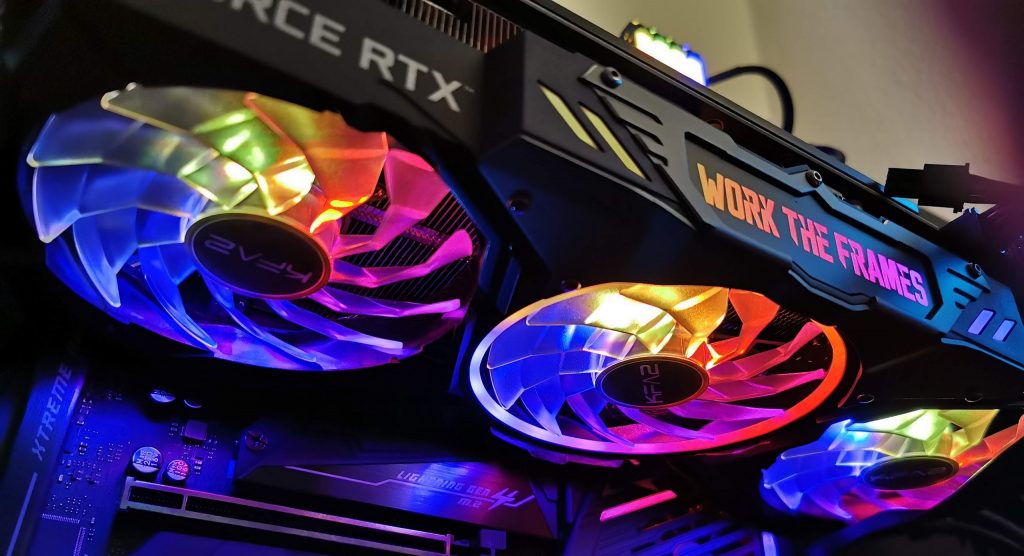
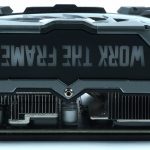
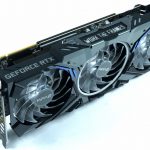
The map tested today, despite or because of the whole beacon, also made it to Europe. And i will go into these details in more detail in a while. Let us first of all stick to the facts and data that are visible even without electricity. Because they are also interesting. The radiator cover is made of black ABS with piano lacquer surfaces and a light metal application in the upper middle. All three fans are illuminated (aRGB), the label with the "Work The Frames" logo on the top of it is of course also. Here, a separate RGB controller (GM006, ARM Cortex) modified for KFA2/Galax offers 4 independently controllable channels.
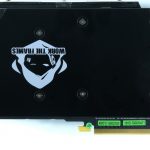
The 1173 grams are not really a small amount now, but there are also much thicker ships. The card measures 31.7 cm from the outer edge of the slot panel to the outer edge of the radiator cover. With the 12.5 cm from the top of the motherboard slot to the top edge of the cover, it is significantly higher than the slot bezel and the installation depth ("thickness") of 5.2 cm makes it a 2.5 slot card. The backplate made of ABS is purely optical in nature and is not actively involved in the cooling concept, as well as. Plastic unfortunately does not give this, but it shines like a starry sky.
With the GM001, which is also installed, the manufacturer uses another custom controller, which only masters simple RGB. But this is quite sufficient for the starry sky of the backplate.
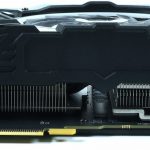
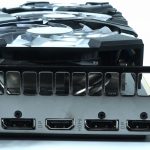
The slot bezel does not allow any warm exhaust air directly, as the cooling fins are vertically aligned due to the three fans. So everything disappears as usual only in the depths of the housing. With one HDMI 2.0 port and three DisplayPort 1.4 connectors, there are plenty of variants to connect to the monitor.
| Installation length (gross) | 31.7 cm |
| Installation height (gross) | 12.5 cm |
| Installation depth front (gross) | 5.2 cm |
| Installation depth rear (gross) | 0.6 cm (backplate) |
| Weight: | 1173 g |
| Connections: | 1x HDMI 2.0 3x DisplayPort 1.4 8-pin + 6-pin PCIe power supply |
| Cooler cover: | ABS injection moulding, black with light metal applications |
| Fan: | 3x 8.5 cm rotors with 11 rotor blades each |
The latest version of GPU-Z gives us an initial overview of the electrical data, where Gigabyte has raised the base clock to 1685 MHz, but the "boost" corresponds to that of the competitors. However, this does not affect the overall performance, as the final bar is again, as with all other cards, on average in the boost specification:
Let's quickly compare some of the relevant maps in table form. The overview of the relevant comparison maps then looks like this:
| KFA2 RTX 2070 Super Work The Frames |
GeForce RTX 2070 FE | GeForce RTX 2070 Super | GeForce RTX 2080 FE | |
| Architecture (GPU) | Turing (TU104-410) | Turing (TU106-400) | Turing (TU104-410) | Turing (TU104-400) |
| CUDA Cores | 2560 | 2304 | 2560 | 2944 |
| Tensor Cores | 320 | 288 | 320 | 368 |
| RT Cores | 40th | 36 | 40th | 48 |
| Texture Units | 160 | 144 | 160 | 184 |
| Base Clock Rate | 1605 MHz | 1410 MHz | 1605 MHz | 1515 MHz |
| GPU Boost Rate | 1815 MHz | 1710 MHz | 1770 MHz | 1800 MHz |
| Storage expansion | 8GB GDDR5 | 8GB GDDR6 | 8GB GDDR6 | 8GB GDDR6 |
| Storage bus | 256-bit | 256-bit | 256-bit | 256-bit |
| Bandwidth | 448 GB/s | 448 GB/s | 448 GB/s | 448 GB/s |
| Rops | 64 | 64 | 64 | 64 |
| L2 Cache | 4 MB | 4 MB | 4 MB | 4 MB |
| Tdp | 215 W | 185 W | 215 W | 225 W |
| Transistors | 10.8 billion | 10.8 billion | 13.6 billion | 13.6 billion |
| The size | 445 mm2 | 445 mm2 | 545 mm2 | 545 mm2 |
| Sli | No | No | NVLink x8 | NVLink x8 |
Test system and evaluation software
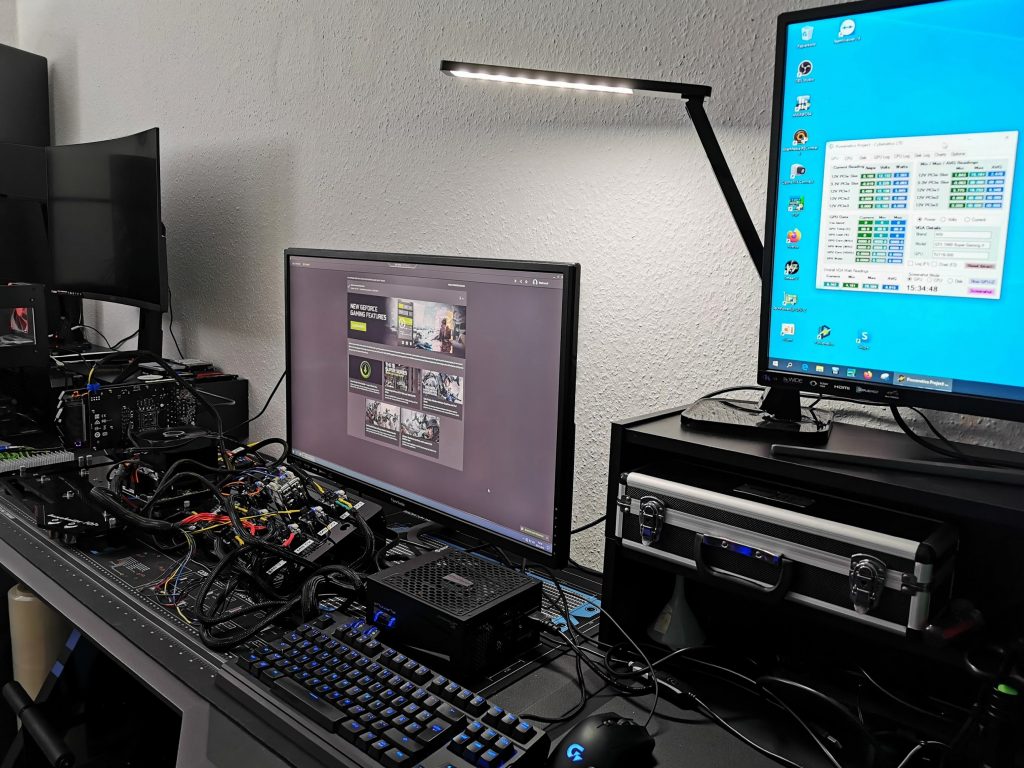
As always, I benchmark with my own PresentMon GUI and the interpreter software, which fills the Excel charts and the graphical output (and only the) so extra- or so. interpolates that all graphs are exactly long, creating a uniform and comparable time line. The remaining evaluations up to percentiles and bar graphics are based on the real raw data from the measurement. The benchmark system is new and has been upgraded in some areas. That's one of the reason why I've completely re-benchmarked all the games and cards.
I have also summarized the individual components of the test system in tabular form.
| Test System and Equipment |
|
|---|---|
| Hardware: |
Intel Core i9-9900 K 4x 8GB G.Skill FlareX DDR4 3200 |
| Cooling: |
Alphacool Ice Block XPX (1151), XPX Pro (AM4, 2066) Alphacool Ice Grinder (modified) Thermal Grizzly Kryonaut |
| Case: |
Lian Li T70, Raijintek Paean Open Benchtable |
| Monitor: | BenQ PD3220U |
| Power Consumption: |
Non-contact direct current measurement on PCIe slot (riser card) |
| Thermal Imager: |
1x Optris PI640 + 2x Xi400 Thermal Imagers Pix Connect Software Type K Class 1 thermal sensors (up to 4 channels) |
| Acoustics: |
NTI Audio M2211 (with calibration file) Steinberg UR12 (with phantom power for the microphones) Creative X7, Smaart v.7 Own anechoic chamber, 3.5 x 1.8 x 2.2 m (LxTxH) Axial measurements, perpendicular to the center of the sound source(s), measuring distance 50 cm Noise emission in dBA (slow) as RTA measurement Frequency spectrum as graphic |
| Os: | Windows 10 Pro (1909, all Updates) |
KFA2 GeForce RTX 2070 SUPER Work The Frames Edition, 8GB GDDR6, HDMI, 3x DP (27ISL6MD24WF)












Kommentieren