


The subject is almost as old as lignite and I have not only written an article about it in recent years. However, the feedback of those who are looking for help and would like to see everything clearly summarized and updated again is piling up again. Of course, I will not close myself off from this and restructure the whole issue and also revise it in a more general way. However, I cannot avoid any theory, even if I try to reduce all this to a tolerable minimum.
Of course, some details will be lost here and there, but often many things only confuse that one believes to be indispensable. But based on all the questions that reach me again and again by mail and messenger from readers and YouTube consumers, I have been looking for a viable compromise of depth and comprehensibility and hope to have done this reasonably well.
Because you know and hate it, the beloved moment when a power supply suddenly switches off in the middle of the game, even though it is new and shows no other abnormalities. The annoyance of the users becomes even greater if one believes that the power supply size has also been calculated correctly. But is that enough for the manufacturers of graphics cards or power supplies to indicate as the performance value? With power supplies you can be relatively sure, but what about the graphics cards?
And in return, you are always amused by the power supply computers of the graphics card providers, which often spit out much higher values than what one finds in the normal measurements. Anyone who knows my graphics card tests knows, however, that I always also use the so-called spikes (<20 ms) mit angebe, diese deutlich höheren Werte aber auch gern relativiere. ms)=”” mit=”” angebe,=”” diese=”” deutlich=”” höheren=”” werte=”” aber=”” auch=”” gern=””></20 ms) mit angebe, diese deutlich höheren Werte aber auch gern relativiere.> Because modern power supplies should be able to put away such very short load peaks easily. Should. But can they really?
And above all, we are touched by a question: how long? And what please distinguish a game from a permanent load such as Calculations or a stress test? This is exactly the question I am now looking into, because apparently and unfortunately no one else really cares about it in detail. And what about the protective circuits installed in the power supplies?
The telemetry of current graphics cards
Nvidia’s Boost and AMD’s Power Tune are highly complex entities designed to achieve maximum graphics performance with minimal power consumption and side effects such as to reach the waste heat. Although there are some considerable differences in the details and technical implementation, the two mechanisms are quite similar in their schematic structure. Unfortunately, the graphics cards are no longer the patient “consumers” they were a few years ago.
The main concern for both vendors is to adjust the core voltage of the GPU in real time in such a way that only as much power is supplied as is needed for the current load of the GPU and the optimal clock rate. Let’s just call it a stress curve. With Nvidias Boost, we have stored the individual boost steps with the default voltage, whereby the clock of the lowest boost stage is shifted by a so-called offset or and the rest is then derived from the arbitrator’s calculations. AMD sets the clock rates and voltages for some predetermined DPM states, which is much less accurate, but works in a similar way in the end.
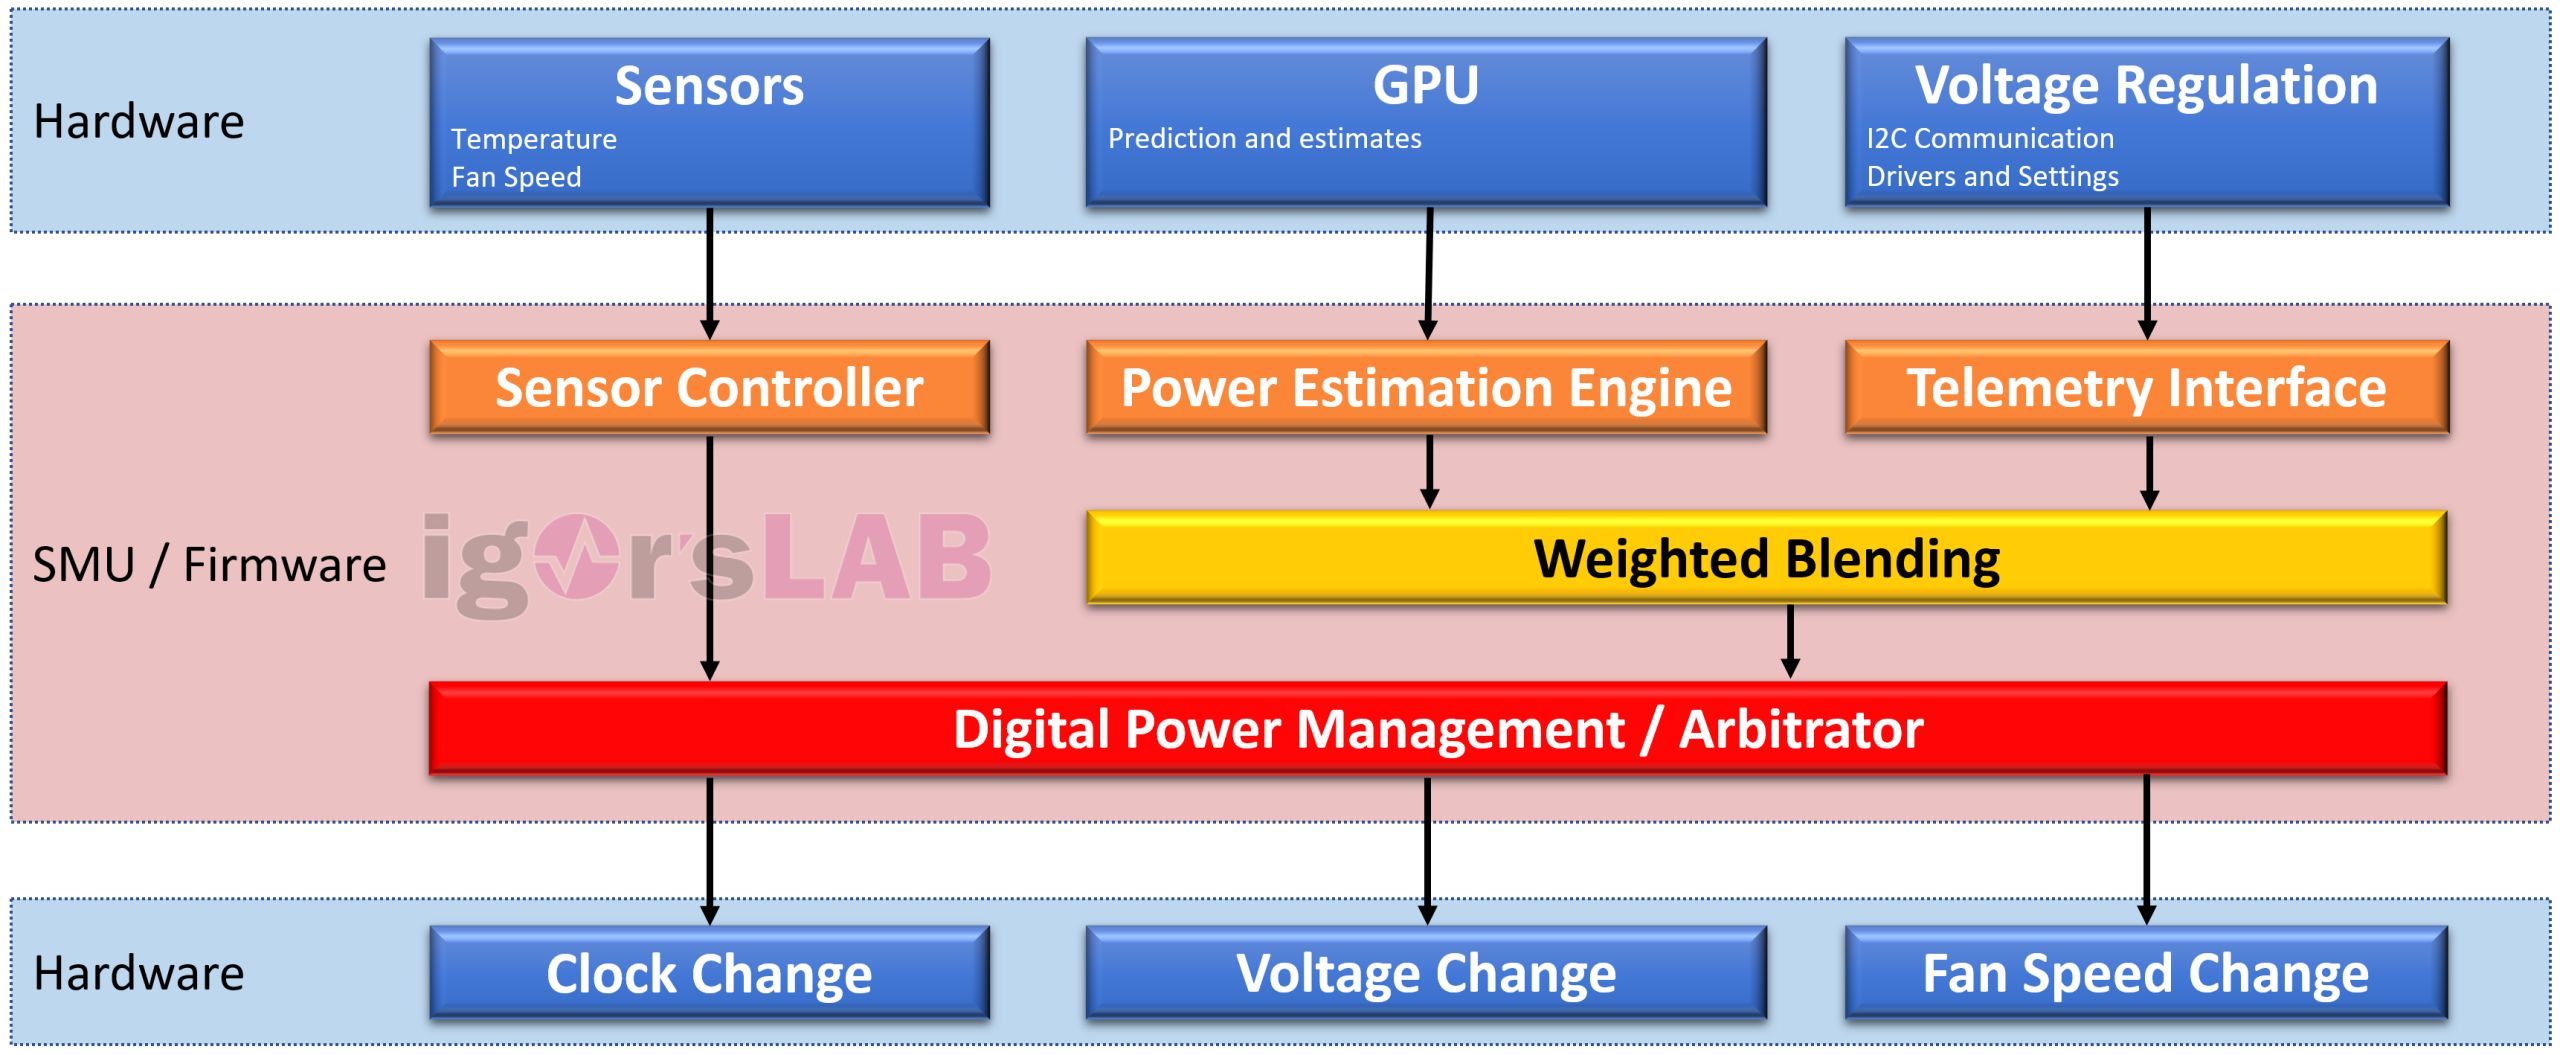
The firmware constantly estimates the energy consumption (quasi in real time) at very short intervals, simultaneously queries the entire sensors as well as the GPU prediction and includes the telemetry data of the voltage regulator. These values are sent to the pre-programmed DPM (digital power management) arbitrator . This control complex also knows the power, thermal and current limits of the GPU (BIOS, drivers), which it can read from the respective registers. Within these limits, it now controls all voltages, clock frequencies and fan speeds, always trying to get the maximum performance out of the card. If even one of the input sizes is exceeded, the middle can retract voltage or clock.
Ful cranmy: the voltage converters and their control
Now, of course, I don’t want to get stuck in technical details that most would probably get bored anyway, but we have to dive a little bit for a better understanding. But don’t worry, it remains understandable enough. Let us therefore now come directly to the so important voltage converters (scheme above, right)! No matter how many phases need to be controlled and perhaps intelligently balanced, a PWM controller needs a value as feedback from each individual control circuit (each phase): the current current flow.
One catchphrase I had already teased with balancing, the second comes now: DCR (Direct Current Resistance). In the end, each component has very specific characteristics in this respect. But to shorten it. DCR is the basis for calculating temperatures and currents. But how does the controller know exactly which currents flow in which control loop? Monitoring can be different, because there are – who wonders – different methods for doing so. One often reads something about the so-called Smart Power Stages (SPS) and the so-called MOSFET DCR.
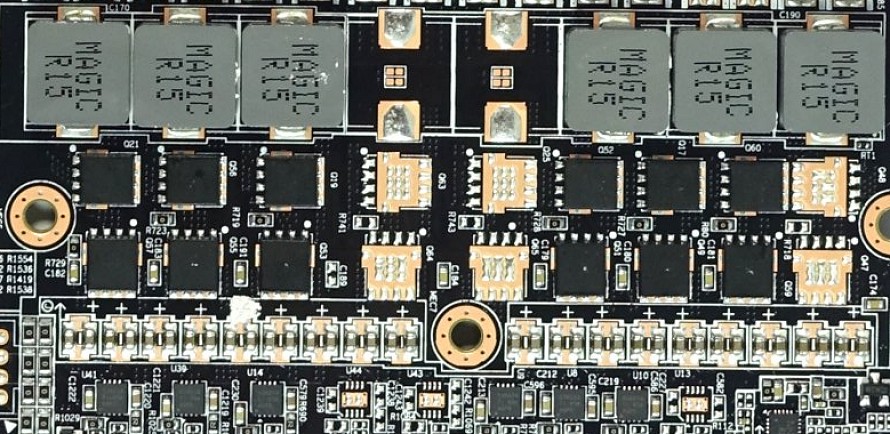
The picture below shows the typical layout with the intelligent PLC, which for each individual control circuit with IMON provide the value for the current current that is so urgently needed for the perfect balancing, i.e. the balance between the phases. How do the PLC determine this value? The drain currents of the MOSFETS are measured in real time and these values are also extremely accurate (in the example above 5 A/A signal).
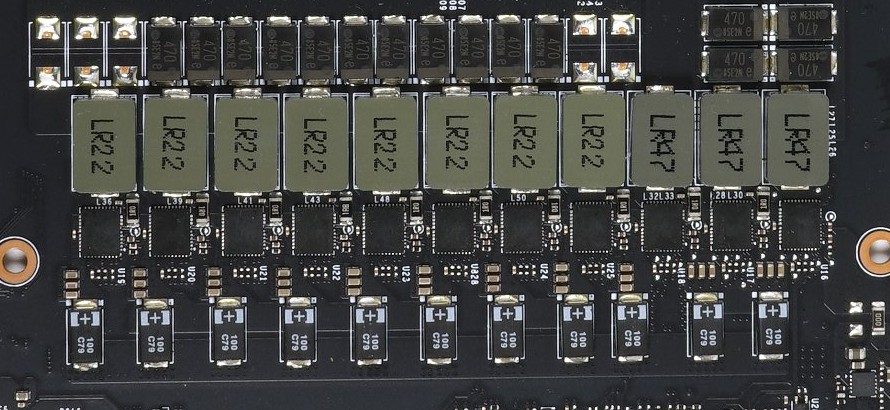
This very cost-intensive solution replaces the significantly cheaper Inductor DCR, i.e. a current measurement via the inductive resistance of the respective filter coils in the output range. For example, Nvidia uses such a solution for inexpensive maps (symbol image below), where it is a little more leisurely when it comes to the flow of electricity. However, the accuracy of this solution is significantly lower and is also strongly influenced by fluctuations in the component quality.
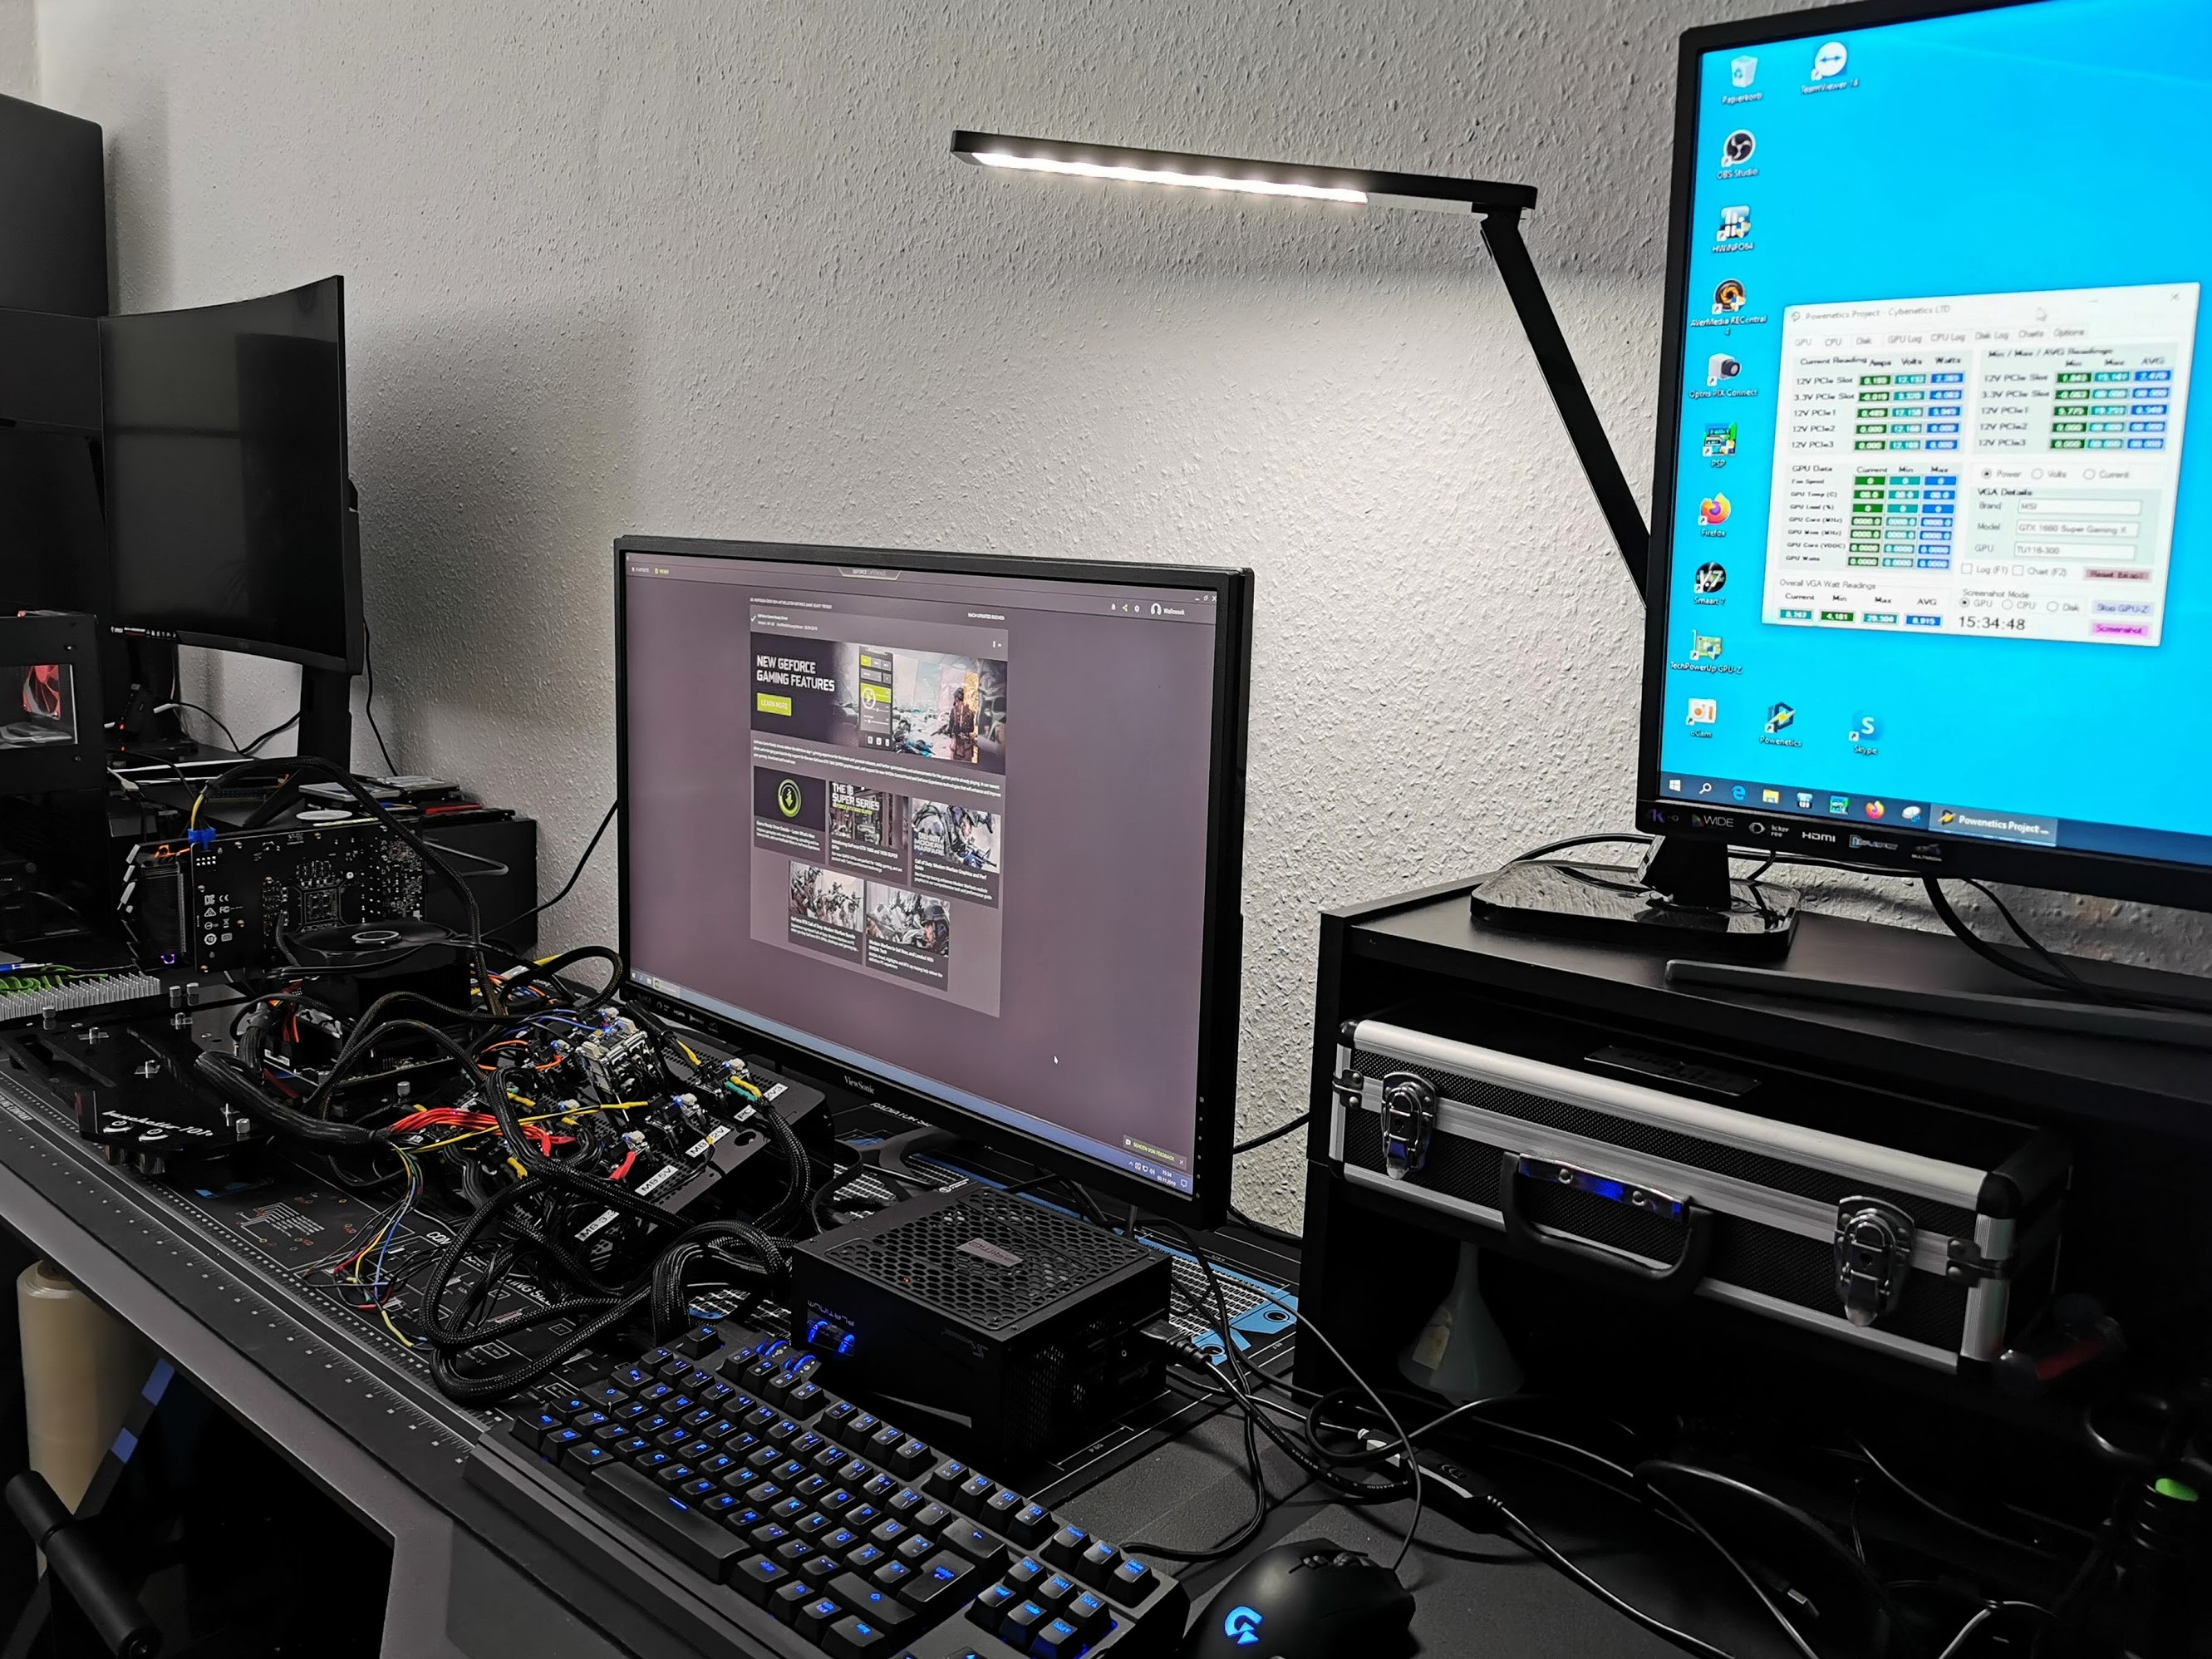
For those interested, there is the measuring equipment in advance, which accompanies me every day during the trade fair:
Test system and setup
Elegant transition and also a view of the test system, which still relies on the base 1151 and Z390. From this point of view, everything remains the same.
The 32 GB extension is new and fits the velvet system. I have listed this tabularly again in detail:
| Test System and Equipment |
|
|---|---|
| Hardware: |
Intel Core i9-9900 K 4x 8GB G.Skill FlareX DDR4 3200 |
| Cooling: |
Alphacool Ice Block XPX (1151) Alphacool Ice Grinder (modified) Thermal Grizzly Kryonaut |
| Case: |
Lian Li T70, Raijintek Paean Open Benchtable |
| Monitor: | BenQ PD3220U |
| Power Consumption: |
Non-contact direct current measurement on PCIe slot (riser card) |
| Thermal Imager: |
1x Optris PI640 + 2x Xi400 Thermal Imagers Pix Connect Software Type K Class 1 thermal sensors (up to 4 channels) |
| Acoustics: |
NTI Audio M2211 (with calibration file) Steinberg UR12 (with phantom power for the microphones) Creative X7, Smaart v.7 Own anechoic chamber, 3.5 x 1.8 x 2.2 m (LxTxH) Axial measurements, perpendicular to the center of the sound source(s), measuring distance 50 cm Noise emission in dBA (slow) as RTA measurement Frequency spectrum as graphic |
| Os: | Windows 10 Pro (1909, all Updates) |


Kommentieren