


Clock rates and overclocking
Of course, you can't compare the direct clock rates of both maps 100 percent, but that's an important indicator. With the Wattman, the RX 5500 XT could easily be overclocked from Gigabyte to 1985 MHz in the top, with the MorePowerTool (download) even more 100 MHz. However, the whole thing quickly becomes tough like honey in the freezer and you will have to consider whether this is worth it at all. A GeForce GTX 1660 will still not be able to catch or overtake, only the energy supplier can cold the shampoo. Although it is more moderate than expected, which in reverse also means that this navigation card is already operated well above the sweet spot.
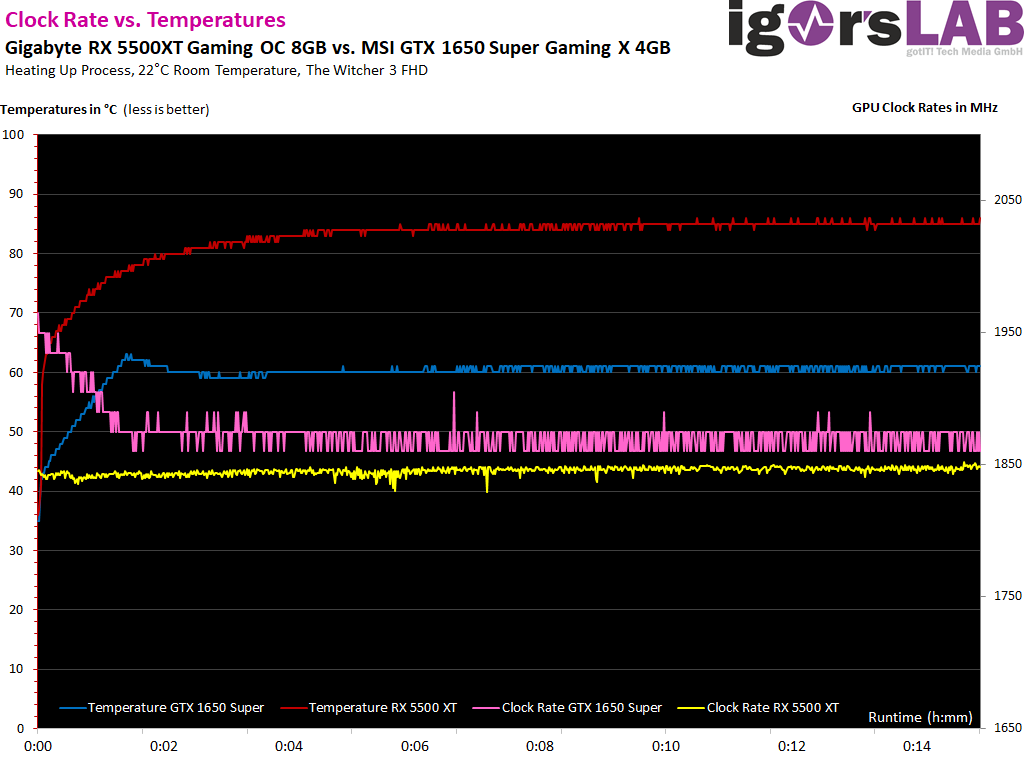
Normally with normal factory OC without manual intervention, temperature curve and clock rates are then beautifully recognizable as in the diagram. Despite the simpler cooler, the GeForce stays much cooler and you can see what the up to 40 watts more can make up on the cooling tasks. Interestingly, however, the gigabyte card can keep the clock more constant than the test card from MSI at launch. However, the mean is the same.
And now the whole thing again in sober numbers in table form:
| Gigabyte RX 5500 XT Gaming OC 8GB |
MSI GeForce GTX 1650 Super Gaming X 4GB |
|
|---|---|---|
| Closed Case | ||
| GPU Temperatures |
84-85 °C | 61-62 °C |
| GPU clock | 1842-1852 MHz | 1860 – 1875 MHz |
| Air temperature in the housing | 45 °C | 40 °C |
Board analysis
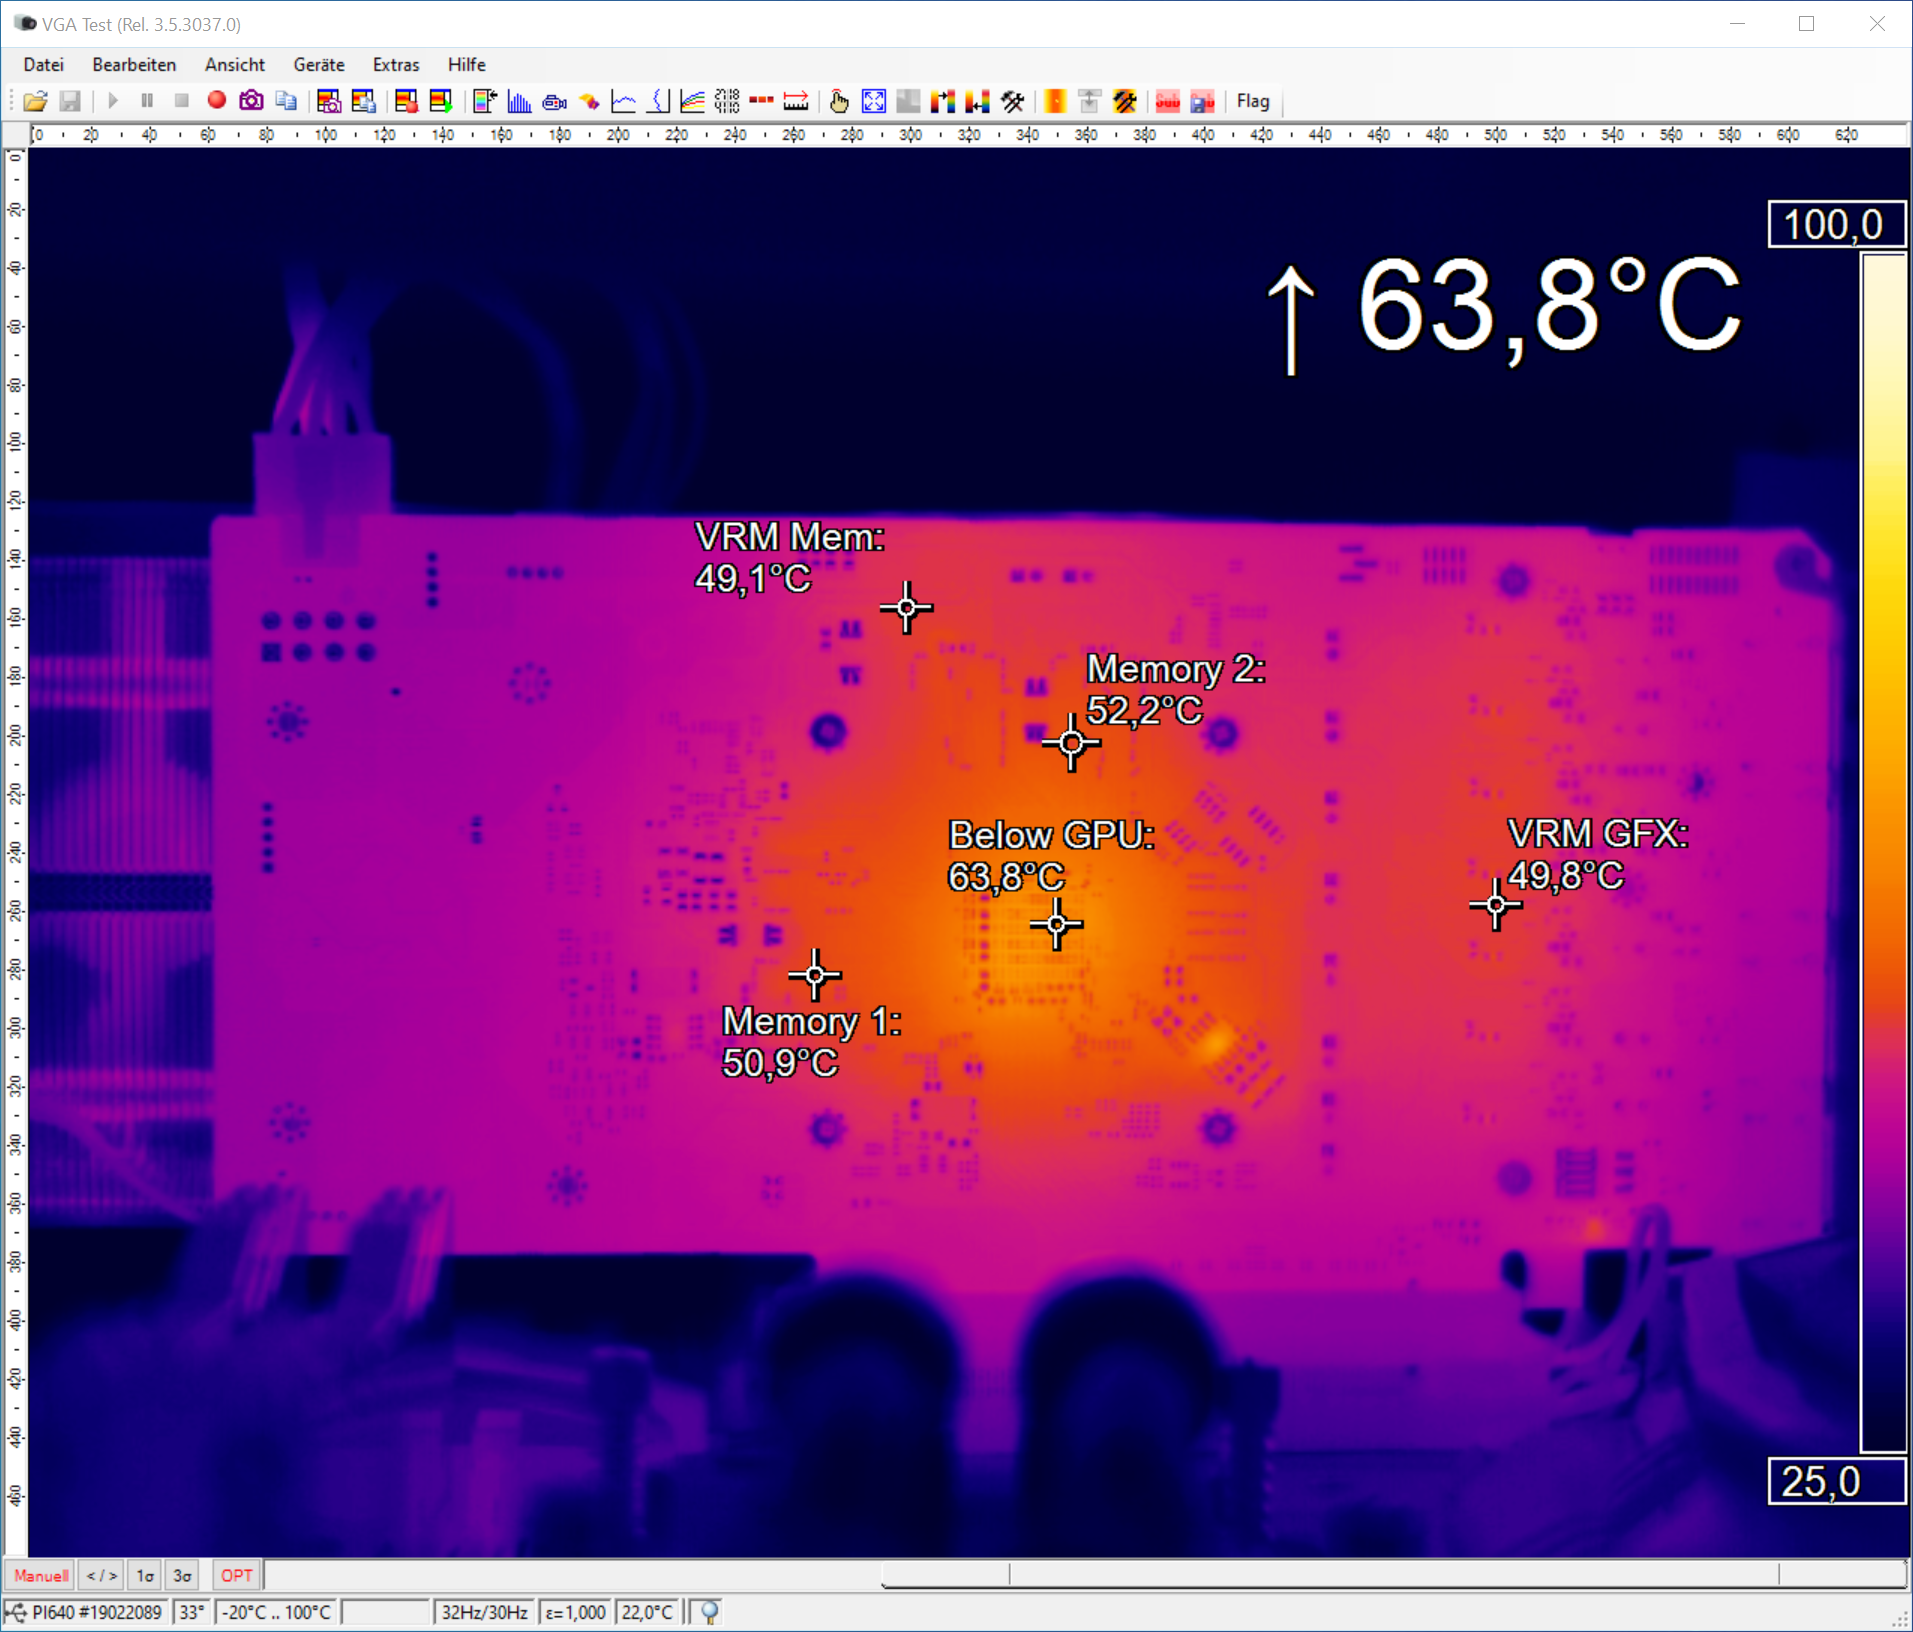
The infrared images below show the gaming and torture loops of the map. You can see a very uniform temperature distribution over the entire board, which can be well liked. Only the middle with the GPU is significantly warmer, which should be due to the slightly weak cooler with the DHT principle:
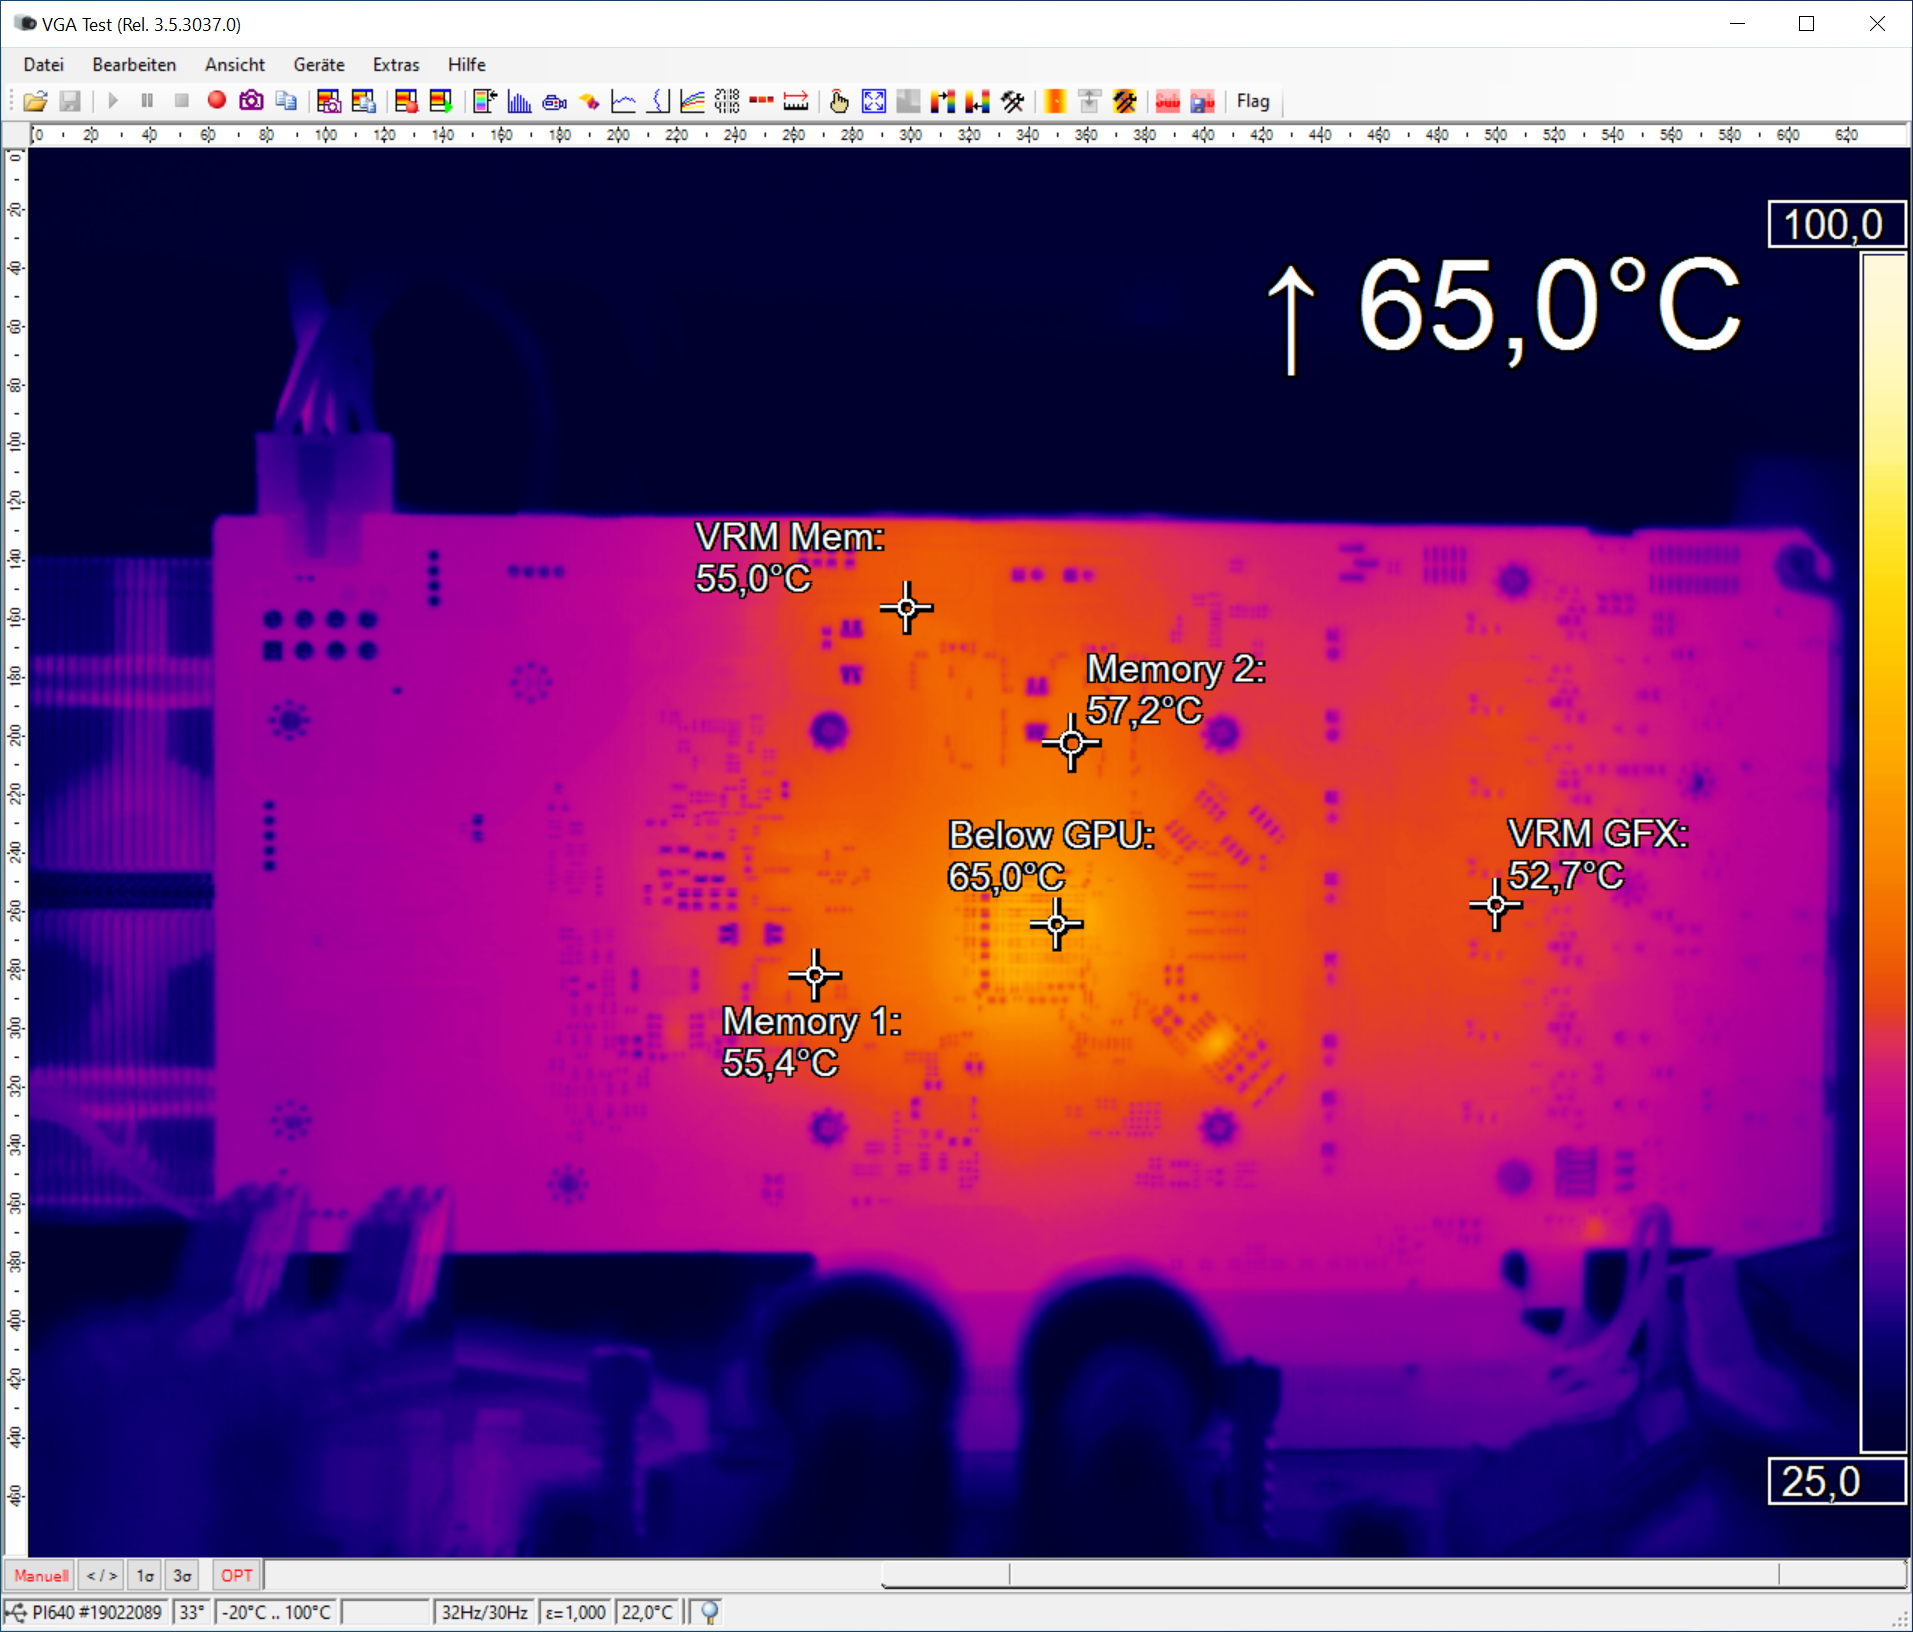
Even with the Torture Loop with significantly higher power consumption, the board makes a very good figure, only the fans now have to shovel a little more air. But it's all still in the green area.
GIGABYTE Radeon RX 5500 XT Gaming OC 8G, 8GB GDDR6, HDMI, 3x DP (GV-R55XTGAMING OC-8GD)


Kommentieren