


Temperature curves and boost cycle in detail
The cooler works very well and again I completely renounce the values of the open setup, which is unrealistic anyway. The fact that the temperatures in the torture loop are so much higher is also due to AMD’s messed up fan controller, which is no longer aligned to the GPU temperature, but to the ominous hotspot (SoC?). What AMD internally calls the duty cycle and what in the end also influences the fans significantly as the set target temperature leads to such situations that the card gets hotter in the torture test because the fans rotate lower. We will see this in the next chapter.
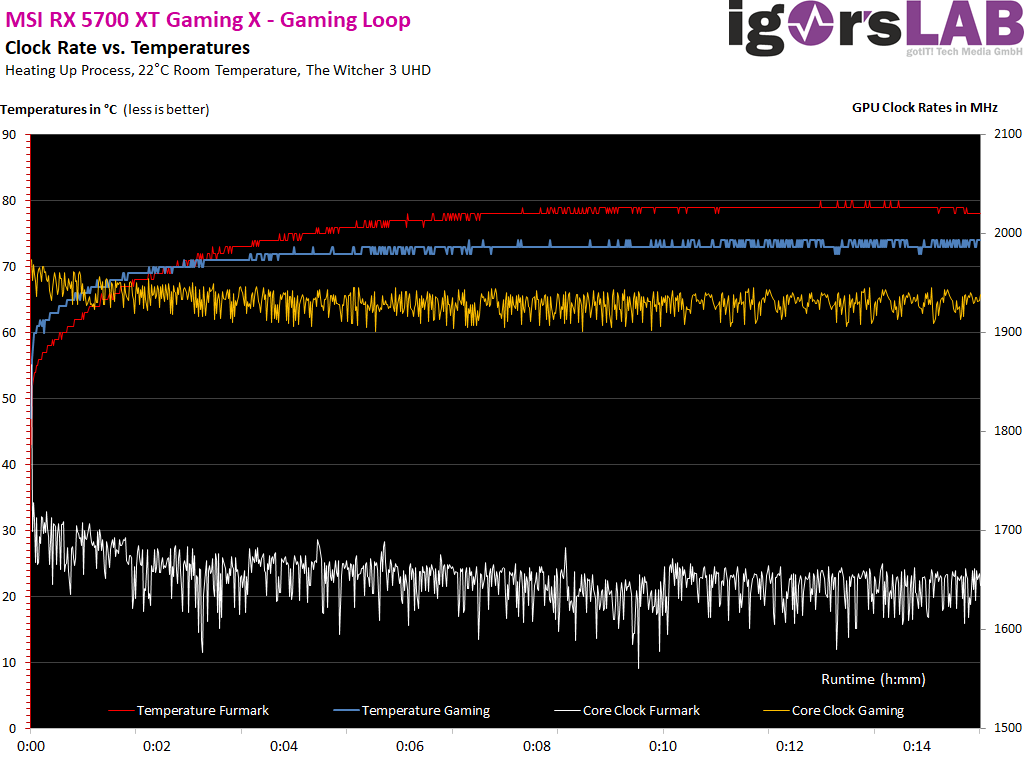
And now the whole thing again in sober numbers in table form, whereby I compare both modes in the closed case:
| Initial Values |
Final Values Factory BIOS |
Final Value ECO Mode |
|
|---|---|---|---|
| GPU Temperatures |
33 °C | 72-73 °C |
74 °C |
| GPU Clock Rate |
1925 MHz | 1925-1985 MHz |
1 792- 1845 MHz |
| Room Temperature | 22 °C | 22 °C | 22 °C |
| Air Temperure Inside Closed Case | 25 °C | 44 °C | 42 °C |
Board Analysis: Infrared Images
The following picture gallery shows all infrared images for the gaming and torture loop in a closed case, but with both versions as comparison. The pictures are self-explanatory and speak a clear language. And I would like to point out once again that the sensor values for the memory are absolute nonsense, as the temperature under the flip-chip modules of the memory is also measurably lower on the board side:
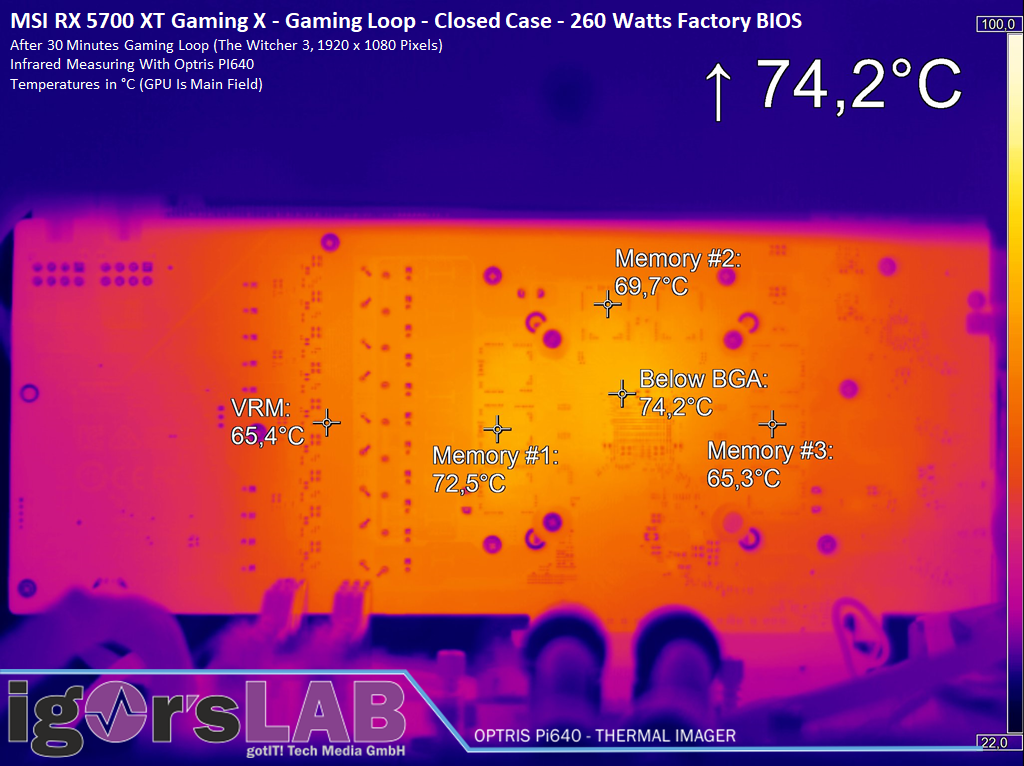
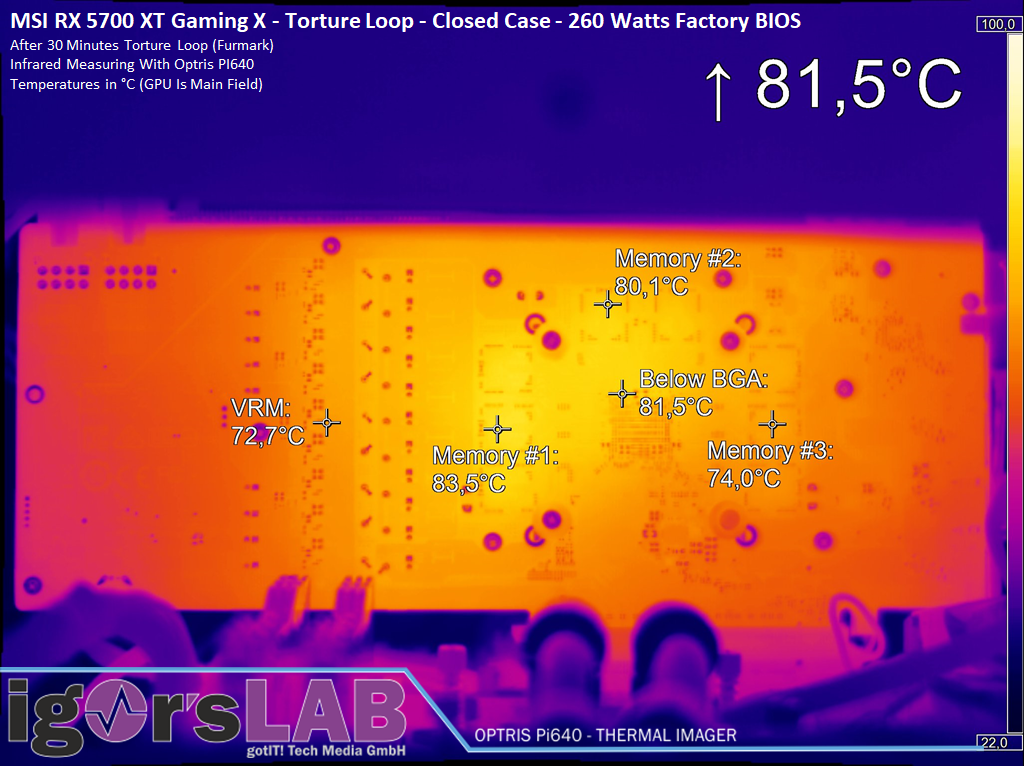
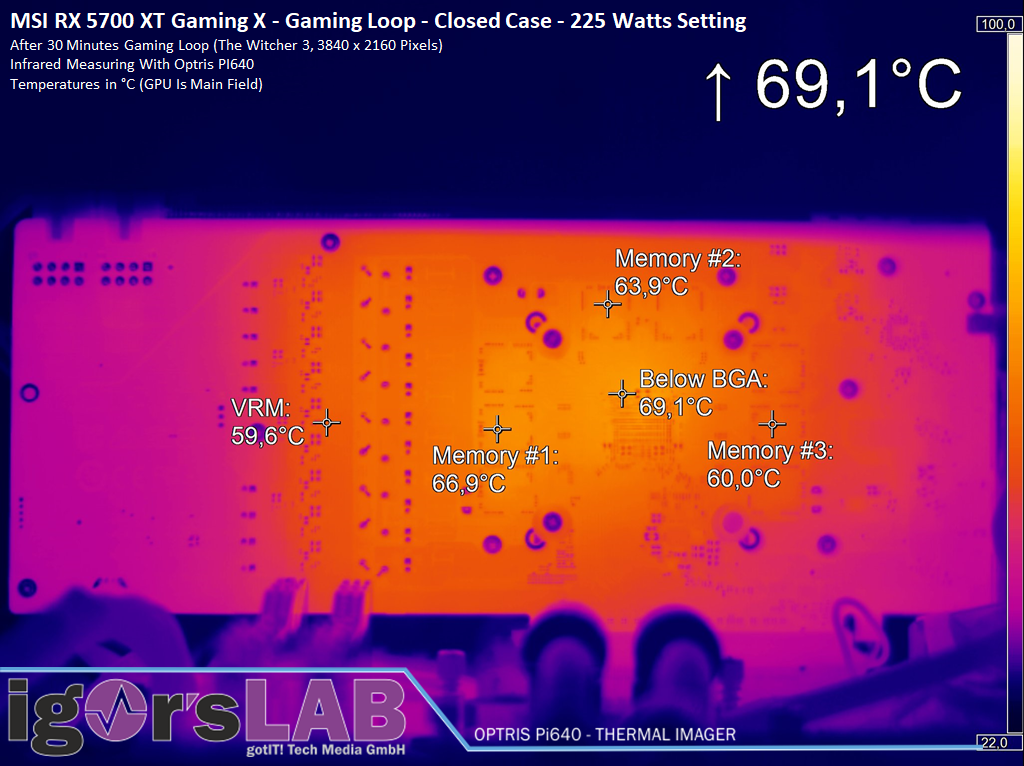
If you now calculate the 3 degrees in the area of the memory that the backplate can decrease when it is mounted, then all in all this is a very decent performance.


Kommentieren