


With the revision 456.55 NVIDIA wants to fix most of the problems of the new GeForce RTX 3080 and RTX 3090 and solved it. In addition to the power supply shutdowns that repeatedly occurred at the beginning with power supplies that seemed to be nominally sufficient, it was mainly the crashes of certain cards within the 3D environment that caused a lot of commotion. At least with the power supply problem I was one of the affected people, but a crashing card could be obtained afterwards.
Read: NVIDIA GeForce RTX 3080 and RTX 3090 and the crashes – Why capacitors are so important and what’s behind them
Read: The possible reason for crashes and instabilities of the NVIDIA GeForce RTX 3080 and RTX 3090
Especially the sporadic CTD errors (Crash to Desktop) were in the focus of my interest a few days ago, whereby it turned out that Boost itself and the somewhat too hectically acting power supply led to exactly those error patterns which one could recognize and which, if one thinks logically, can even be traced back to a common cause. If extreme spikes meet a not quite optimal layout, then capacitors chosen rather unsuitable for such extreme scenarios come into play and the whole thing collides with the chip quality and lack of quality control or binning due to lack of suitable drivers, chaos is actually pre-programmed. This is a pity, because it is unfortunately somewhat detrimental to a good product in itself. And then there is the Internet community, which clings to every straw to get attention.
To get around the problem with the CTDs, it was previously possible to either lower the power limit slightly or to reduce the offset for the clock slightly (50 to 100 MHz), which could certainly be used as a relief. NVIDIA has made an intervention in the power management with the current drivers, which of course affects the firmware and the control mechanism of the telemetry. It is interesting to note that no clock rate reduction in the conventional sense was implemented here, because the picture that emerged under full load and during the measurements is slightly different. Sure, the very high clock rates are, perhaps, no longer achieved, but they still could be, if telemetry would allow it due to external circumstances (sensor and state values).
Problems with the load peaks on the power supply
With my older Seasonic power supply, I was able to make a very interesting observation, which was reproducible at least from time to time. Whenever the short-term spikes caused the power supply to switch off, the GPU was also at the stability limit shortly before or at the same time. Switching to a PSU with a protective circuit that was triggered a little later revealed the CTD problem with the card in question, which did not occur with the old PSU. A feat, because everything was always switched off. That’s exactly why I hung myself once again with a microsecond resolution between graphics card and power supply and tried to document the moment of horror here.
Programs and hardware such as PCAT or readout software such as GPU-Z are simply much too slow to be able to detect or document the actual time of the collapse. I was able to get one of the affected cards at short notice, but unfortunately I was not able to make any physical changes to this borrowed card. But it is also enough to capture the moment of the crash. According to the GPU-Z protocol, you were NOT on the highest clock at that moment, but you were probably already in the step below. It’s not possible to check this exactly, because GPU-Z is unfortunately simply too slow for this, even if you set the sensor loop in the settings to maximum shortness in the interval.
So exactly at the moment when the maximum peak of about 600 watts occurred, now the sudden graphics card was the victim of the complete overpowering and no longer the PSU. One could therefore be inclined to see a causal connection here. This was actually confirmed to me once again by the use of the new drivers, so that I now see the partly absurd boost behaviour as the actual trigger. The rest was then the evaluation of the circumstances and their consequences.
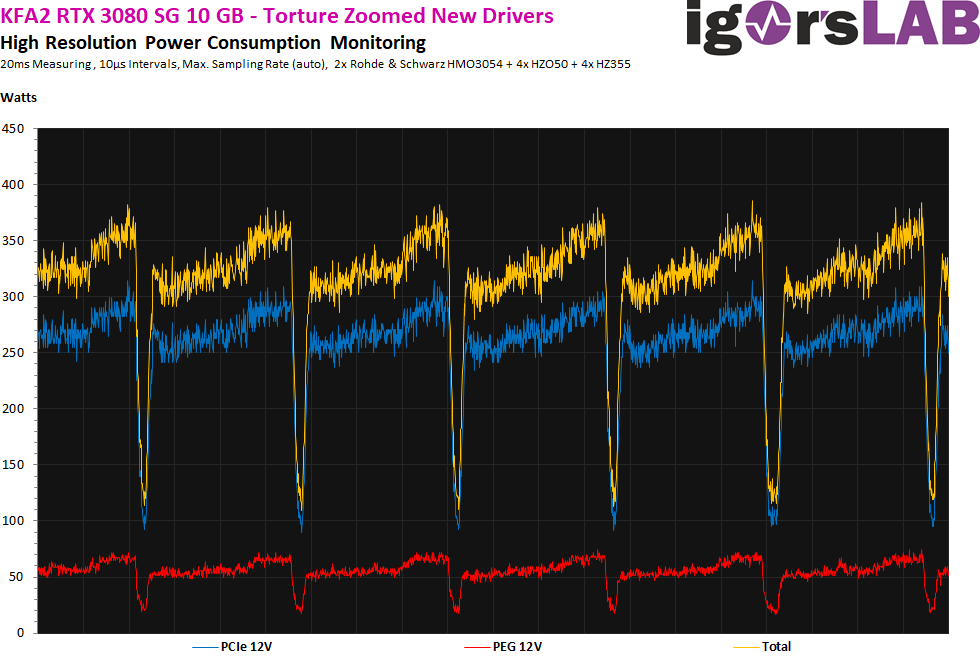
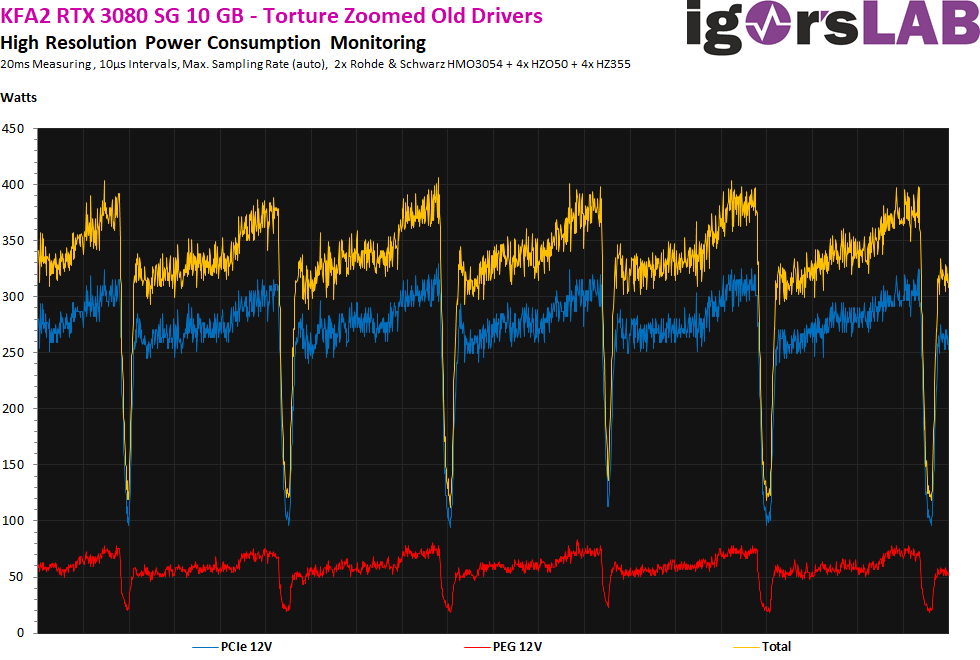
The load change behaviour with old and new driver – Problem solved!
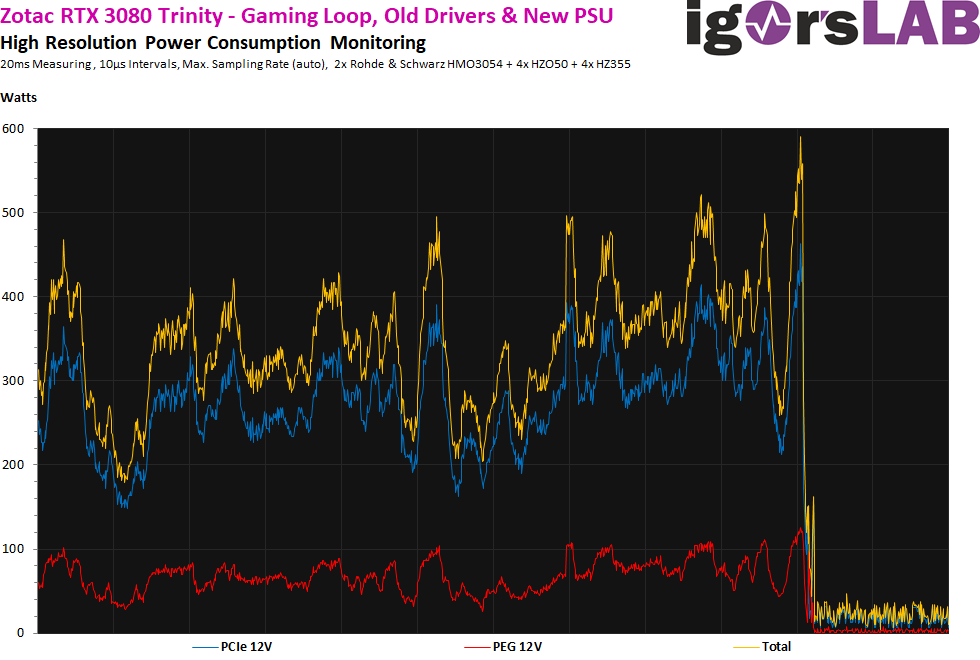
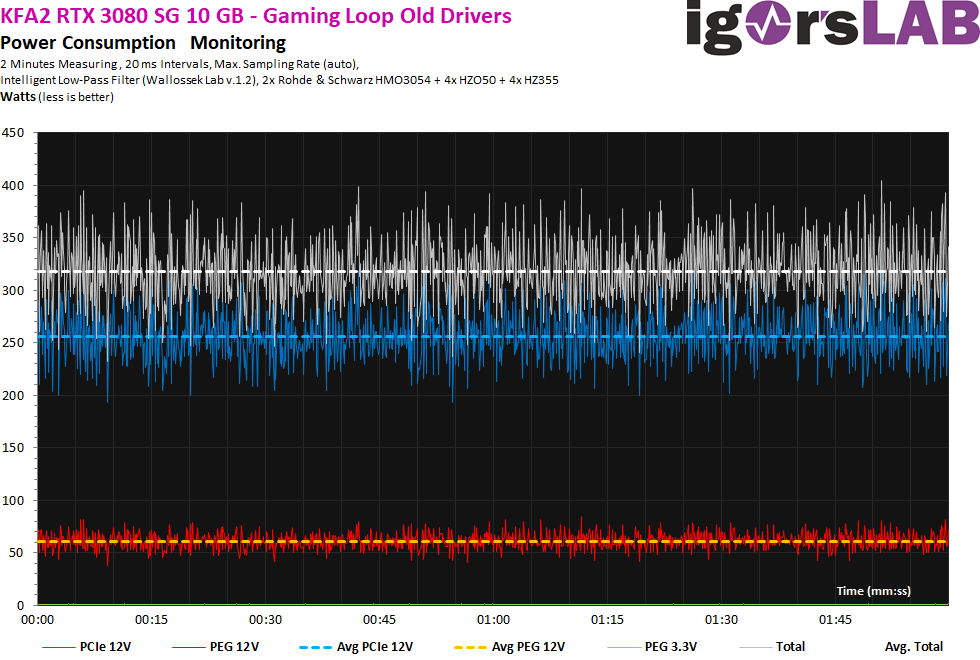
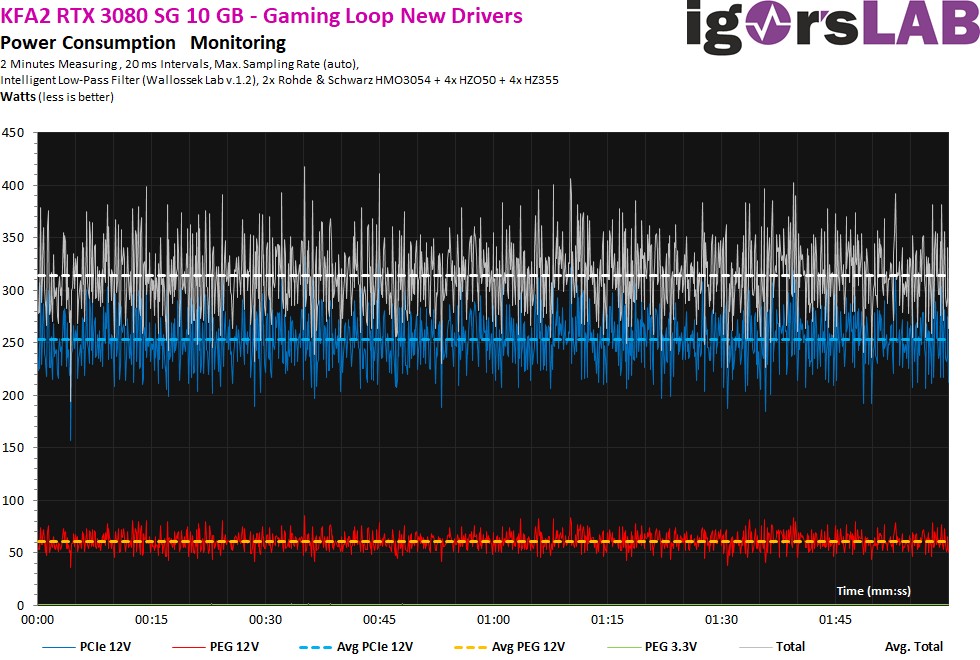
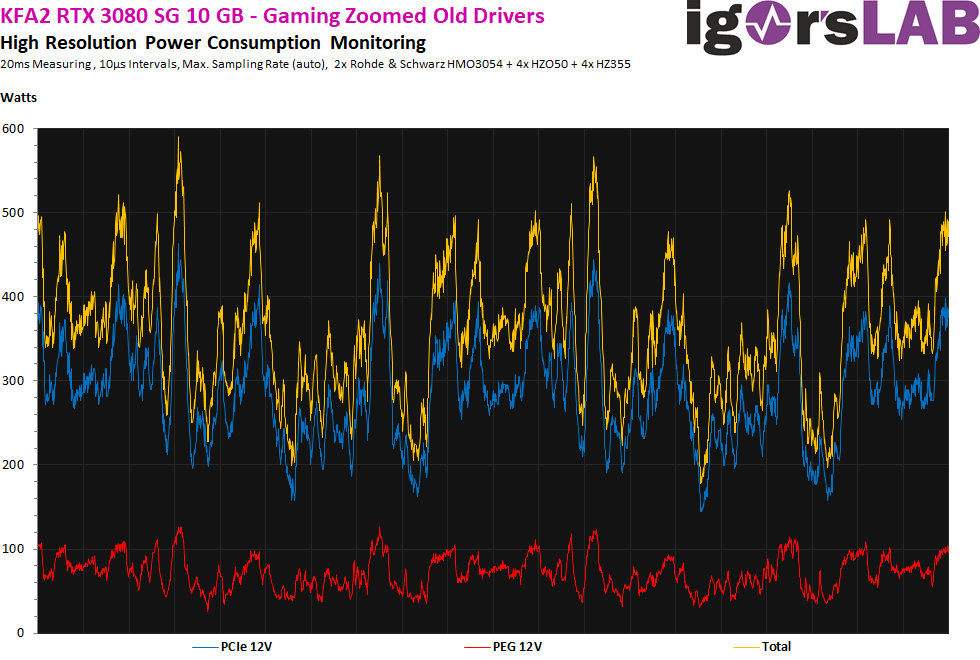
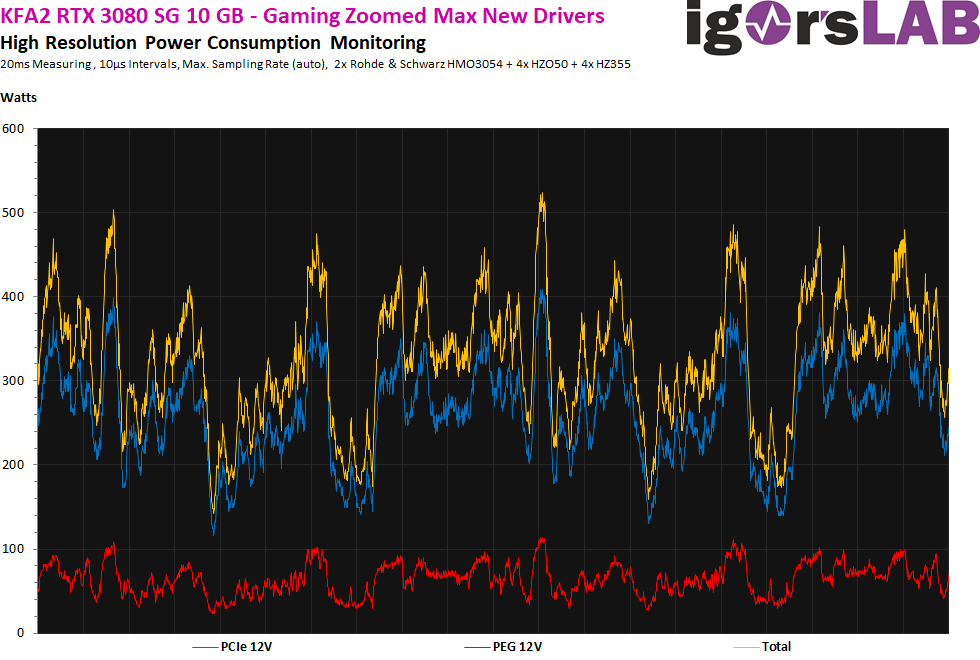
In order not to crash, I now made all tests with a stable running KFA2 RTX 3080 SG 10GB, whereby the Trinity with the new drivers then also ran (almost) continuously. First I compared the power consumption during the Gaming Loop. The power limit of the graphics card is 320 watts, I reached 318 watts with the old driver. With the new driver it was then 4 watts less with 314 watts. This is less than expected as a difference, but really requires proper equipment that really records almost all load values. The higher the resolution, the more fluctuating were the measurements with the same card in the same savegame. Everything from approx. 10 ms as interval limit was simply no longer clean to be able to speak of proper tolerance ranges.
The problem with this resolution of 20 ms is that you can’t see the right spikes either, because they get lost in the averaged acquisition and are simply accumulated broken. Let’s therefore change to the microsecond range, where NVIDIAS Boost also operates. And wow, the spikes are now also clearly visible. Exactly here we see the real difference with the spikes! While with the old driver it was often between 580 and 600 watts, it is now suddenly at least 70 watts less and also the characteristic and frequency decreases strongly! So we can see very well where the missing 4 watts have gone. Not on average, no, but predominantly in the maximum peaks! This is also one of the reasons why the loss of performance should turn out to be manageably small in the end. Control rage slowed down, visible.
You can see the differences in a different way in the stress test, because the 20 ms intervals help us even better optically, interestingly enough. In direct comparison, we see that the intervals of power limitation have become significantly smaller, so the card reacts much faster to supposed or real overloads. Let us first compare the large intervals and pay attention to the distances and shape of the dips:
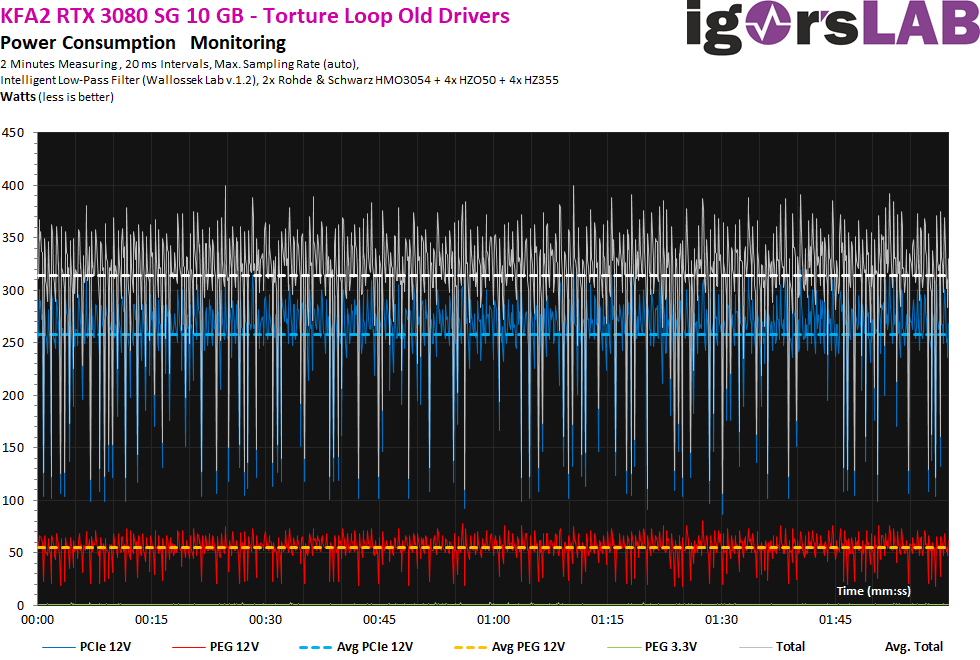
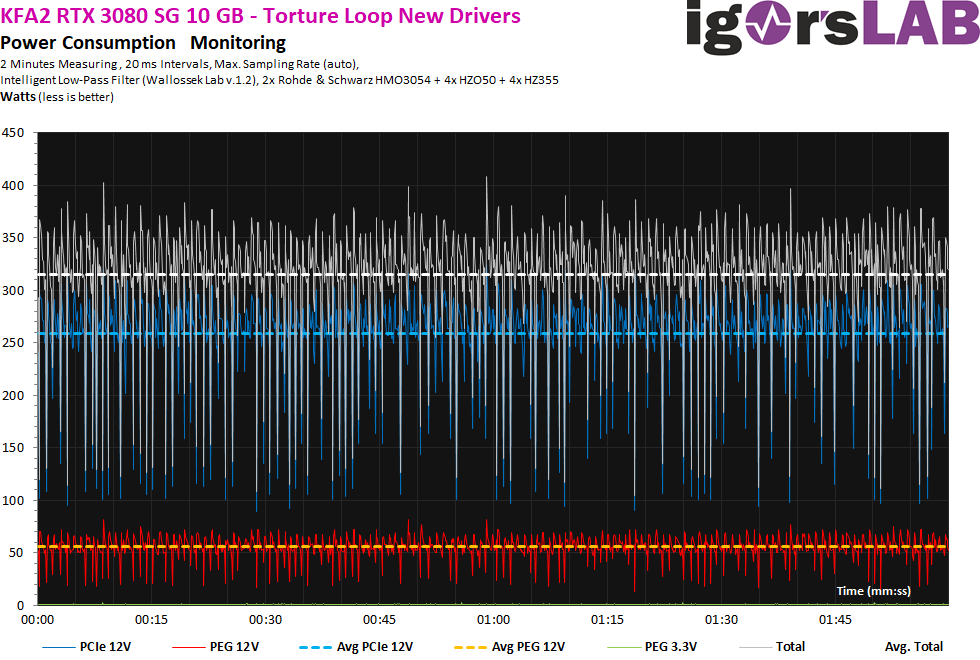
Where these dips come from, shows and the analogous to the Boost running measurement in the microsecond range, where you can also see the self-protection very nice:
And what does this cutback cost us in terms of actual performance? You will find out exactly that on the next page!


Kommentieren