


Let’s start with the card, which is also available from the power supply manufacturer and in various speeches such as reddit, the AMD Radeon RX Vega. I even measured two cards and in the end, in fairness, decided on the “worse” variant with the slightly higher load peaks (AMD RX Vega64 reference card).
However, the Gigabyte RX Vega64, which was also tested, was only marginally “better”. But none of this affects the result anyway. By the way, an RX Vega56 was again far below the values listed below!
Measurements under maximum game load
The game with the highest load peaks and also the longest load states in the maximum range is, who is surprised, Witcher 3 in Ultra HD. That crystallized after the first comparison measurement with 10 games. The average power consumption over a measuring room of one second is approx. 250 watts, so fully in the norm.
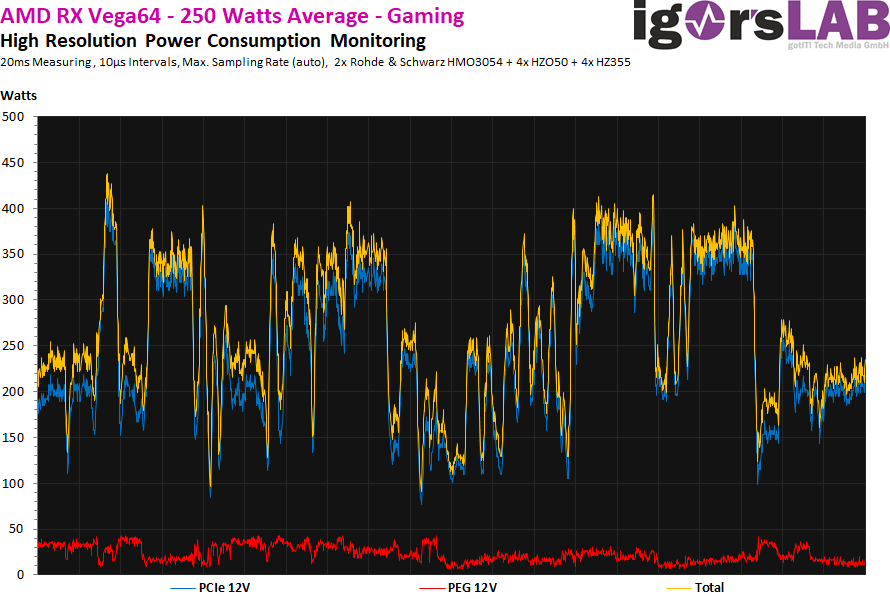
But let’s get to the measurements. What the end customer understands most best is the power consumption (“consumption”), i.e. what effectively goes over the counter in energetic form. Out of a total of 100 automatically logged measurements for gaming (the other 100 are for the stress test) over 60 ms each (6000 measuring points in the interval of 10 s each), I filtered out the ones with the highest single load >= 1 ms and only a time window of 20 ms with 2000 ms measuring points cut out (zoom).
For better orientation, I set the guides to display a 1-ms grid. A box is equivalent to one millisecond. The longest contiguous peak load here was approx. 370 watts over 1.7 ms. The highest peak load in this measurement was approx. 420 watts in 0.3 ms. An RX Vega64 does not generate more, as long as the current supply is constant and the voltage remains constant. The yellow curve represents the total power consumption of the card on the two 12V rails.
Let us therefore take a closer look at currents and voltages. If one excludes the voltage fluctuations from the curve calculation, one sees that the currents flow much more “evenly” (graphic below). The hibercy thus comes from the multiplied voltage to represent the power consumption (graphic above). The supply voltage varies between 11.8 and 12.3 volts, which is a really good value considering the high resolution.
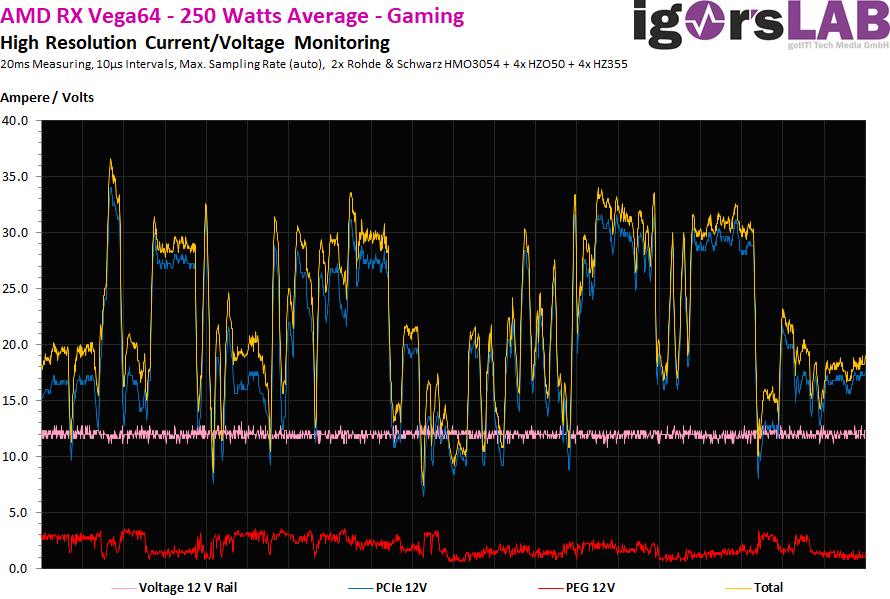
Load peaks of more than 600 watts / 50 amperes over 10 ms are thus already somewhat part of the land of the imagination, because more than 40 amperes on an RX Vega64 (not Vega56) were not included in any of the measurements (here approx. 38 ampere). The measurement with 102 amps for 2 smaller cards published by the power supply manufacturer should never have been done directly on the graphics card itself. Then the curves would look different. The actual construction site is therefore not the AMD graphics card.
Measurements during the stress test
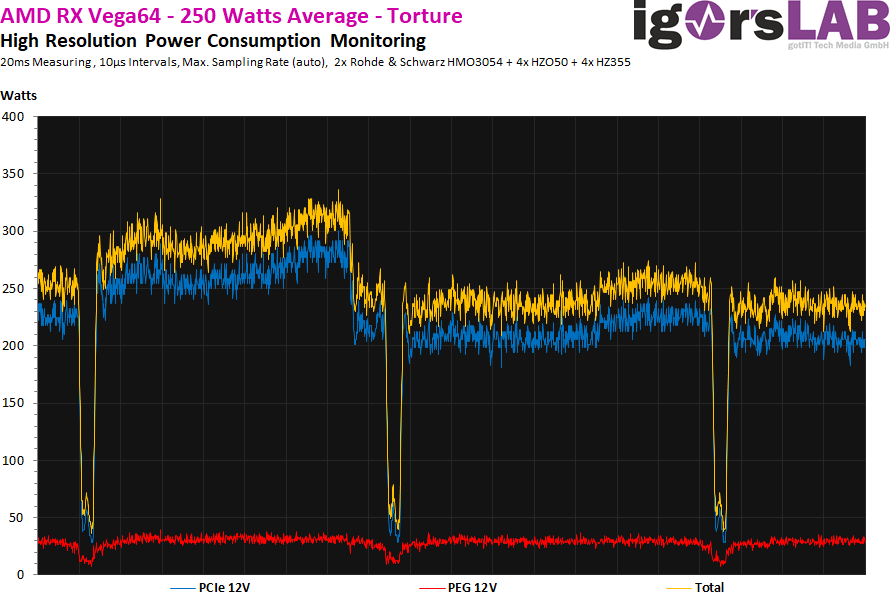
The reason why graphics cards get hotter during the stress test, even though the power consumption as an average value often does not even increase significantly over a long second, is due to the type of loads generated. This can be imagined as with a finger and the short touch of a hot surface. A periodic, very short tap is much easier to survive than the permanent laying on a not so hot surface!
The same applies to the loads. I’m still measuring here. 250 watts as an average, but the intervals of the load peaks are much longer! The longest interval with 237 watts above 7.7 ms is even below the TBP (Typical Board Power)! The highest interval here is about approx. 8 ms and also up to 338 watts in the peak, but then drop to 242 watts within this interval. Here, the arbitrator of Powertune is already reaching for approx. 8 ms restrictively and caps the power consumption.
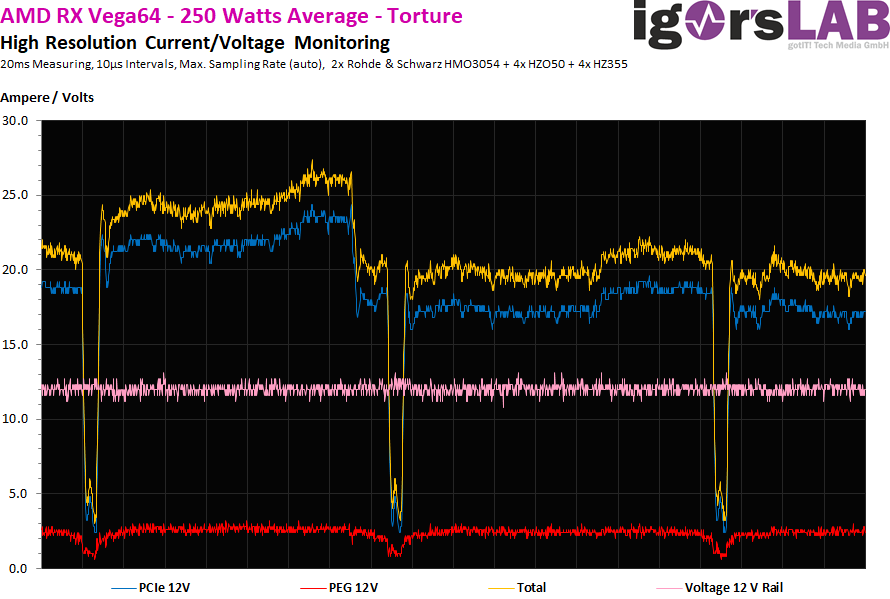
Tensions fluctuate even slightly. Incidentally, I never measure more than 28 amperes for the maximum current over all individual tests, even if I move the measuring intervals to less than 1 s in the nanosecond range.
Intermediate conclusion
I really would like to know where the over 50 amperes for the significantly less powerful RX Vega56 were really measured and in which application. I’ve spoken to board developers of board partners and AMD itself, not just now and now. Such extreme outliers and peaks have never been observed by anyone at such long intervals, which then – I would like to insinuate nothing to the engineers without a precise knowledge of the circumstances – makes me doubt the result.
What you have to consider when selecting and designing a power supply, however, is a good and functional secondary side, which is at least 400 watts over 2 to 3 ms and approx. 350 watts over 10 ms to be quite safe. But then the 550-watt power supply should have been enough. So I will have to say something about it in the summary, after we have also looked at the other test candidates.


Kommentieren