


Our fan measurement chamber and claim
Since there is currently no source that offers realistic and usable data even in direct comparison, we invested a lot of time and money and simply developed our own fan measurement station with the advice of a large German cooling and air conditioning manufacturer and then calibrated it on site in the laboratory. Our colleague Pascal Mouchel did a great job and the result is quite impressive. The heavy and massive body with two chambers made of thick MDF boards was calculated in cooperation with the manufacturer’s engineering, planned in the implementation and of course also soundproofed.
Of course, what we can measure from now on doesn’t meet any ISO standard, but the differences to the million-dollar original chamber of the supporting manufacturer are in a range where the manufacturing tolerances of the fans already start. Thus, the ideal can be approached quite well, especially since the installed measuring devices were individually selected from a larger quantity and then also professionally calibrated at great expense. This makes such an investment, including hardware and software, almost worth a five-digit amout, but you don’t have to spend a six-digit amount to be able to objectively evaluate a fan in the end. That’s because we measure a total of 4 installation scenarios in 100-RPM increments, then create a high-quality long-term audio recording over the entire speed band in each case and offer a frequency analysis. In addition, we provide all DC and PWM controlled results up to the respective power consumption.
Since a lot of know-how, time and also money is involved in the setup, we will only describe the things that are really necessary to understand the tests here. This is not a blueprint for rebuilding. A very simplified version with a long tube instead of the chamber would have been much cheaper, but it is so inaccurate due to the design that the values can only be considered as a rough estimate with many errors. The pressure drop is immense and a serious sound level measurement is simply impossible due to the resonant body thus created. Values below approx. 30 CFM can hardly be evaluated in a meaningful way. There have also been such tubes as a promo action of various fan manufacturers to measure, but more than nice toys, these are all not.
Tests as case fans and on radiators
Currently, the question always arises as to what characteristics a 120 or 140 mm fan really has. Not every model is suitable for all radiator thicknesses, and some supposedly powerful fans lose so much pressure on radiators that they can hardly be considered suitable. The specifications for airflow (“throughput”) and static pressure in the data sheets are of little help when something works well on a slim radiator but completely fails on a 45 mm radiator. For use, both 120 mm and 140 mm use a thin ST30 from Alphacool, which in terms of characteristics closely matches the typical 25 mm radiators of AiO water cooling systems, especially in terms of measurement data, an XT45 for the medium-thick radiators with very tight fins, and a thick UT60 for the heavy models.
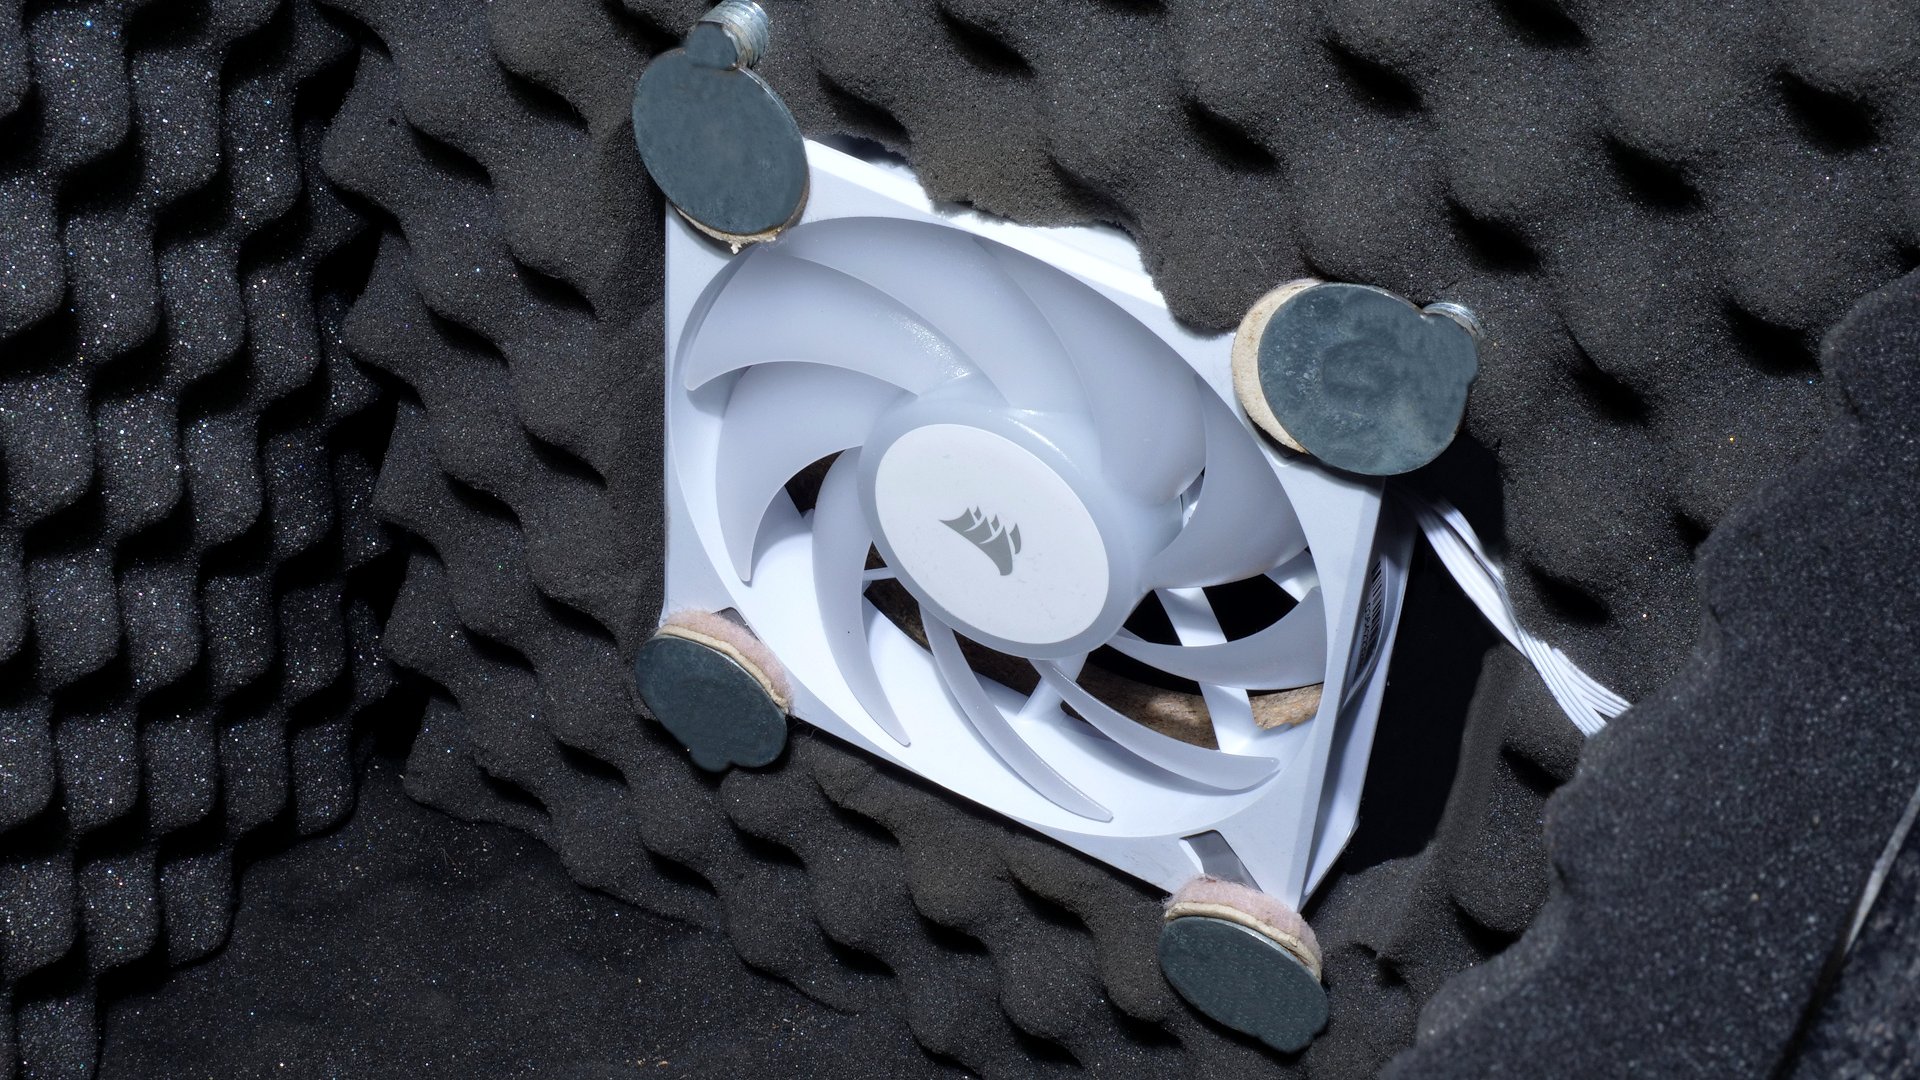
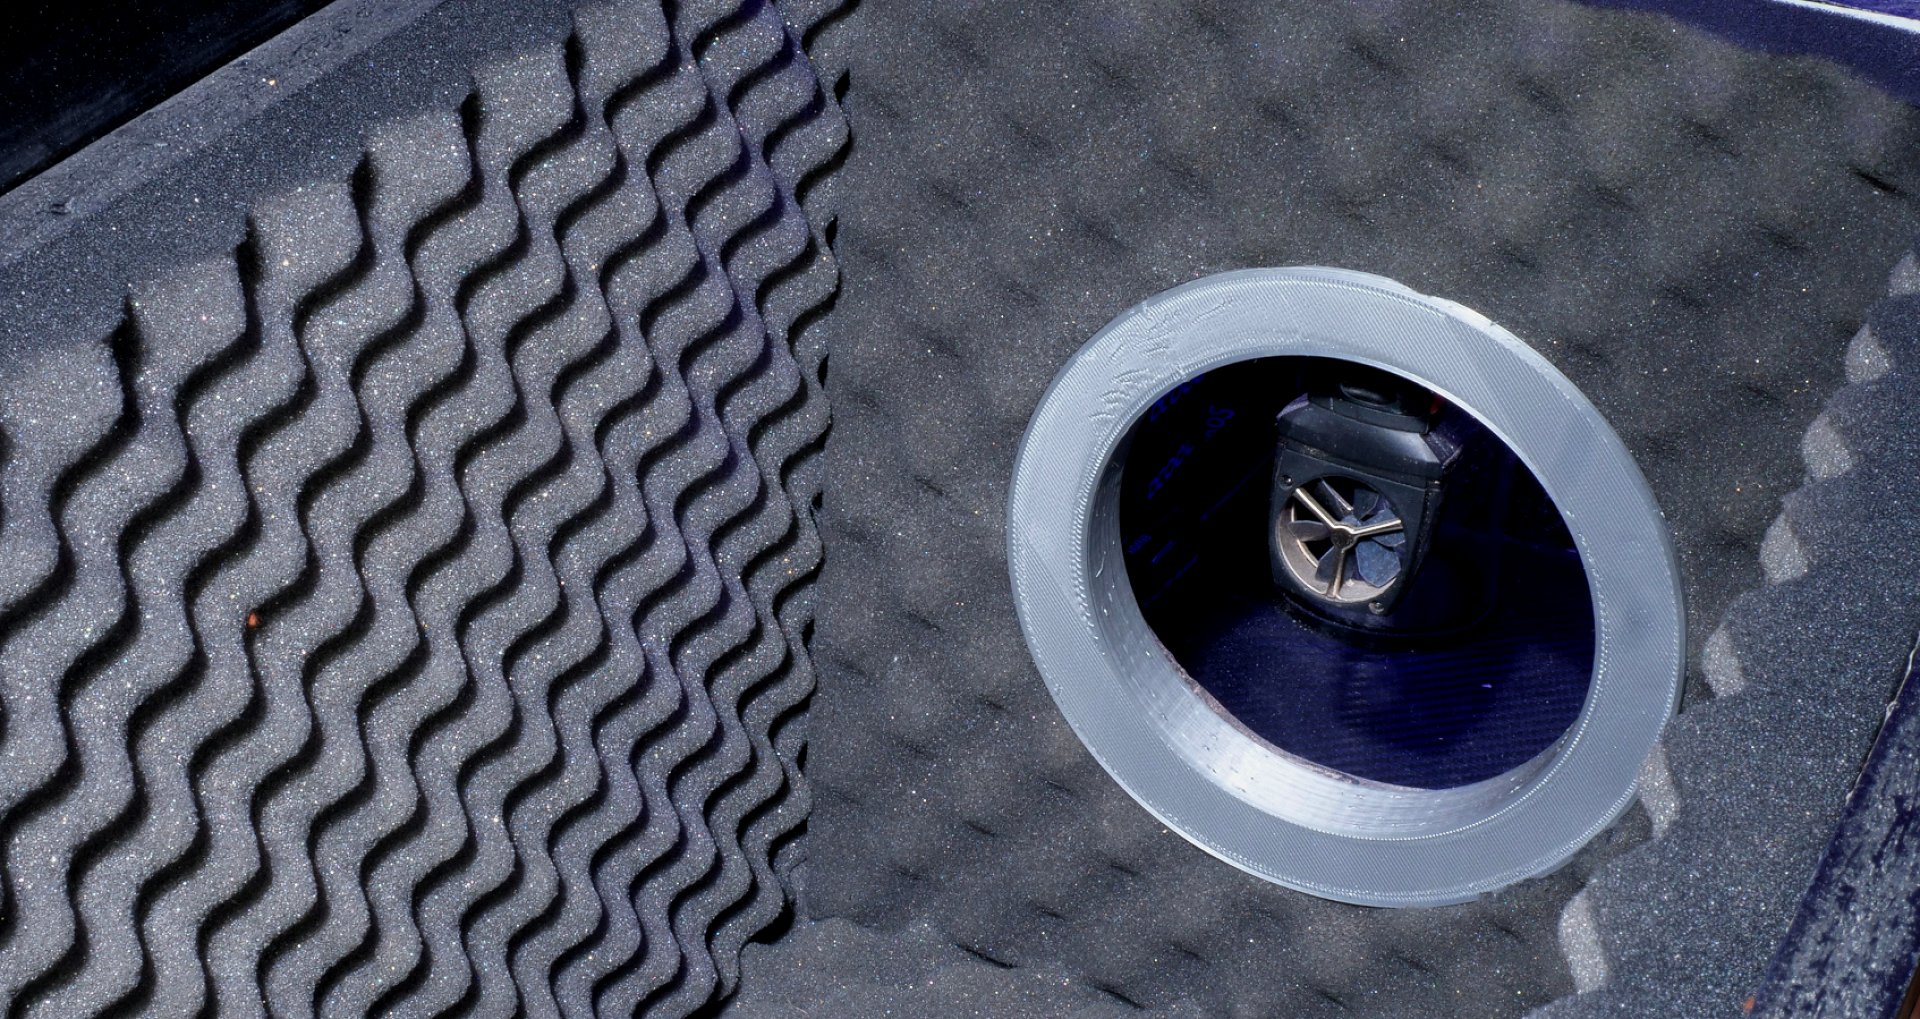
The fans are specially decoupled and screwed tightly. Because the stator (i.e. the outer frame), must not move. Nomen est omen. Some laboratories measure fans with so-called wire spiders and a spring tension in the suspension. This is technically wrong, because a possible humming cannot be measured this way, because the resonances are compensated by the springs. We have already provided this proof once, where a fan that was completely inconspicuous in the laboratory then already began to vibrate at certain speeds while lying on the smooth table. By the way, we also do this very simple preliminary test in order to pay special attention to such speeds during testing. Glass plates are particularly suitable for this. Each of the chambers is also appropriately lined with dimpled foam and designed in terms of material so that there are hardly any disturbing influences.
In the picture below we see the middle partition between the two chambers, which carries the fan and also the radiator. Of course, decoupling is again a big issue here and we thankfully had expert help in calculating the volume for the chambers and the positioning. By the way, the “honeycomb” behind the fan was recommended to us by Black Noise and our industry partner and does its job perfectly. Here, too, the shape, honeycomb diameter and depth were optimized in advance in a simulation and the whole thing was then printed out in the 3D printer.
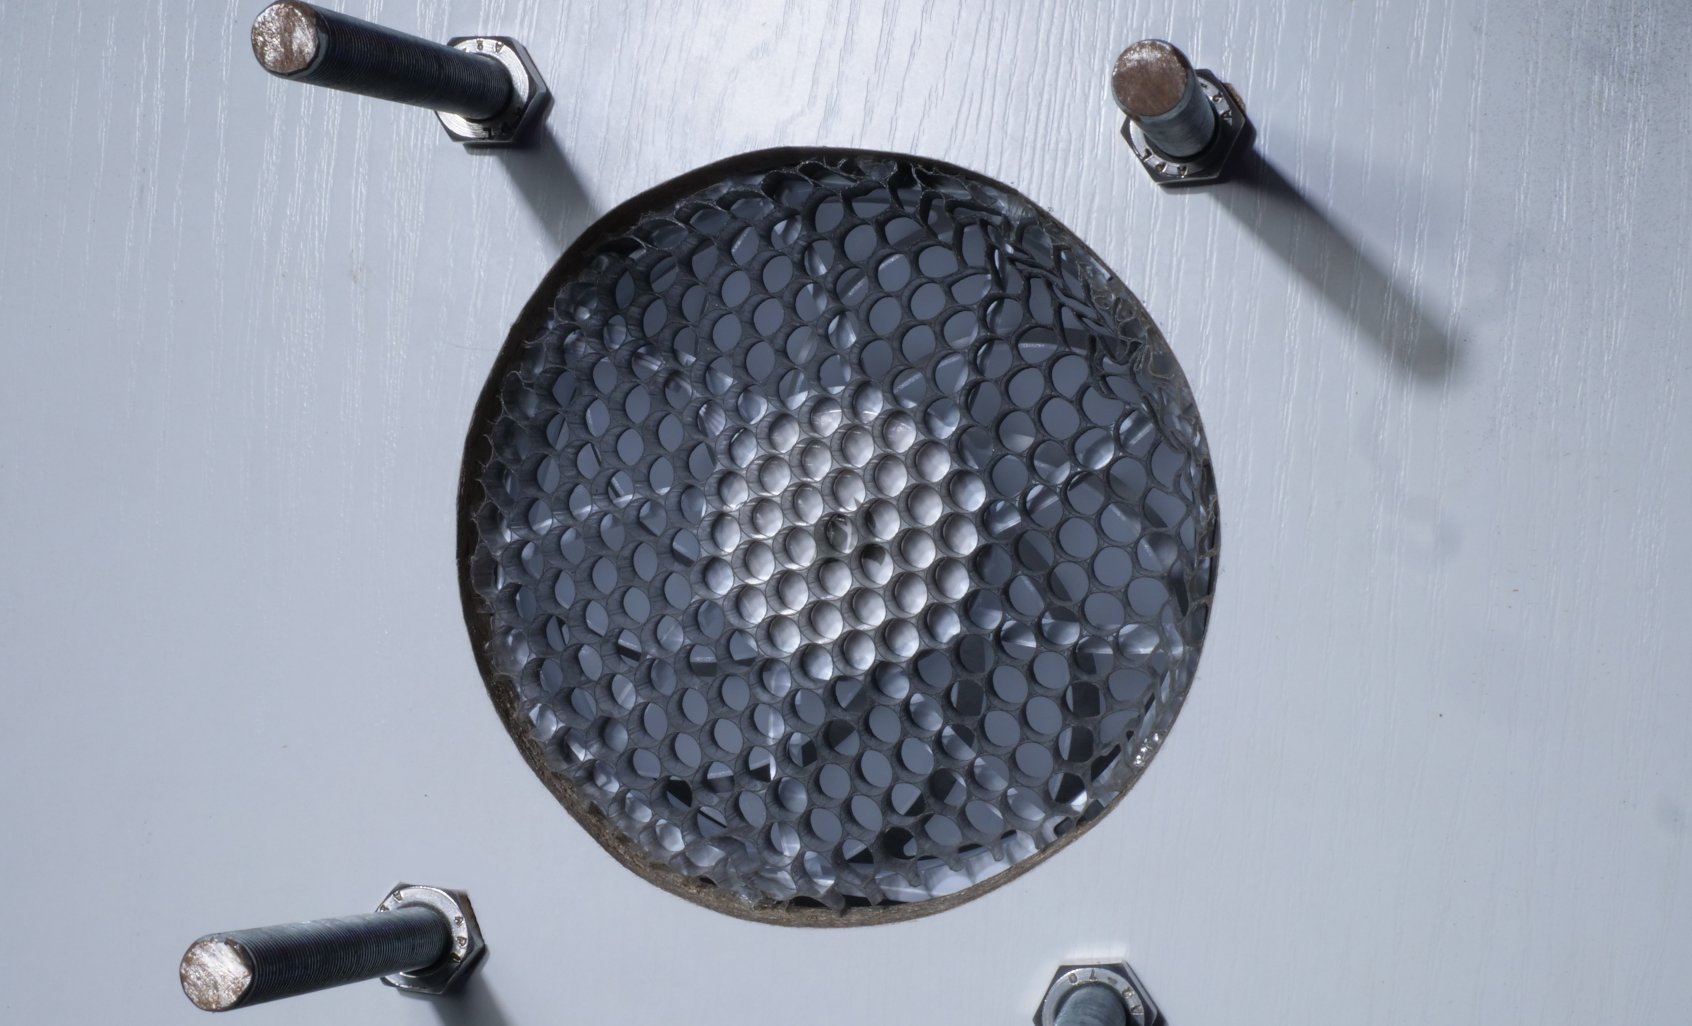
As a result, all coolers are equally well integrated, since each has a different exit angle and precisely this problem can be compensated for with this. The honeycomb reduces the problems with the tear-off edges and the airflow is directed directly to the outlet. You are really measuring what is being delivered by the fan.
Volume flow
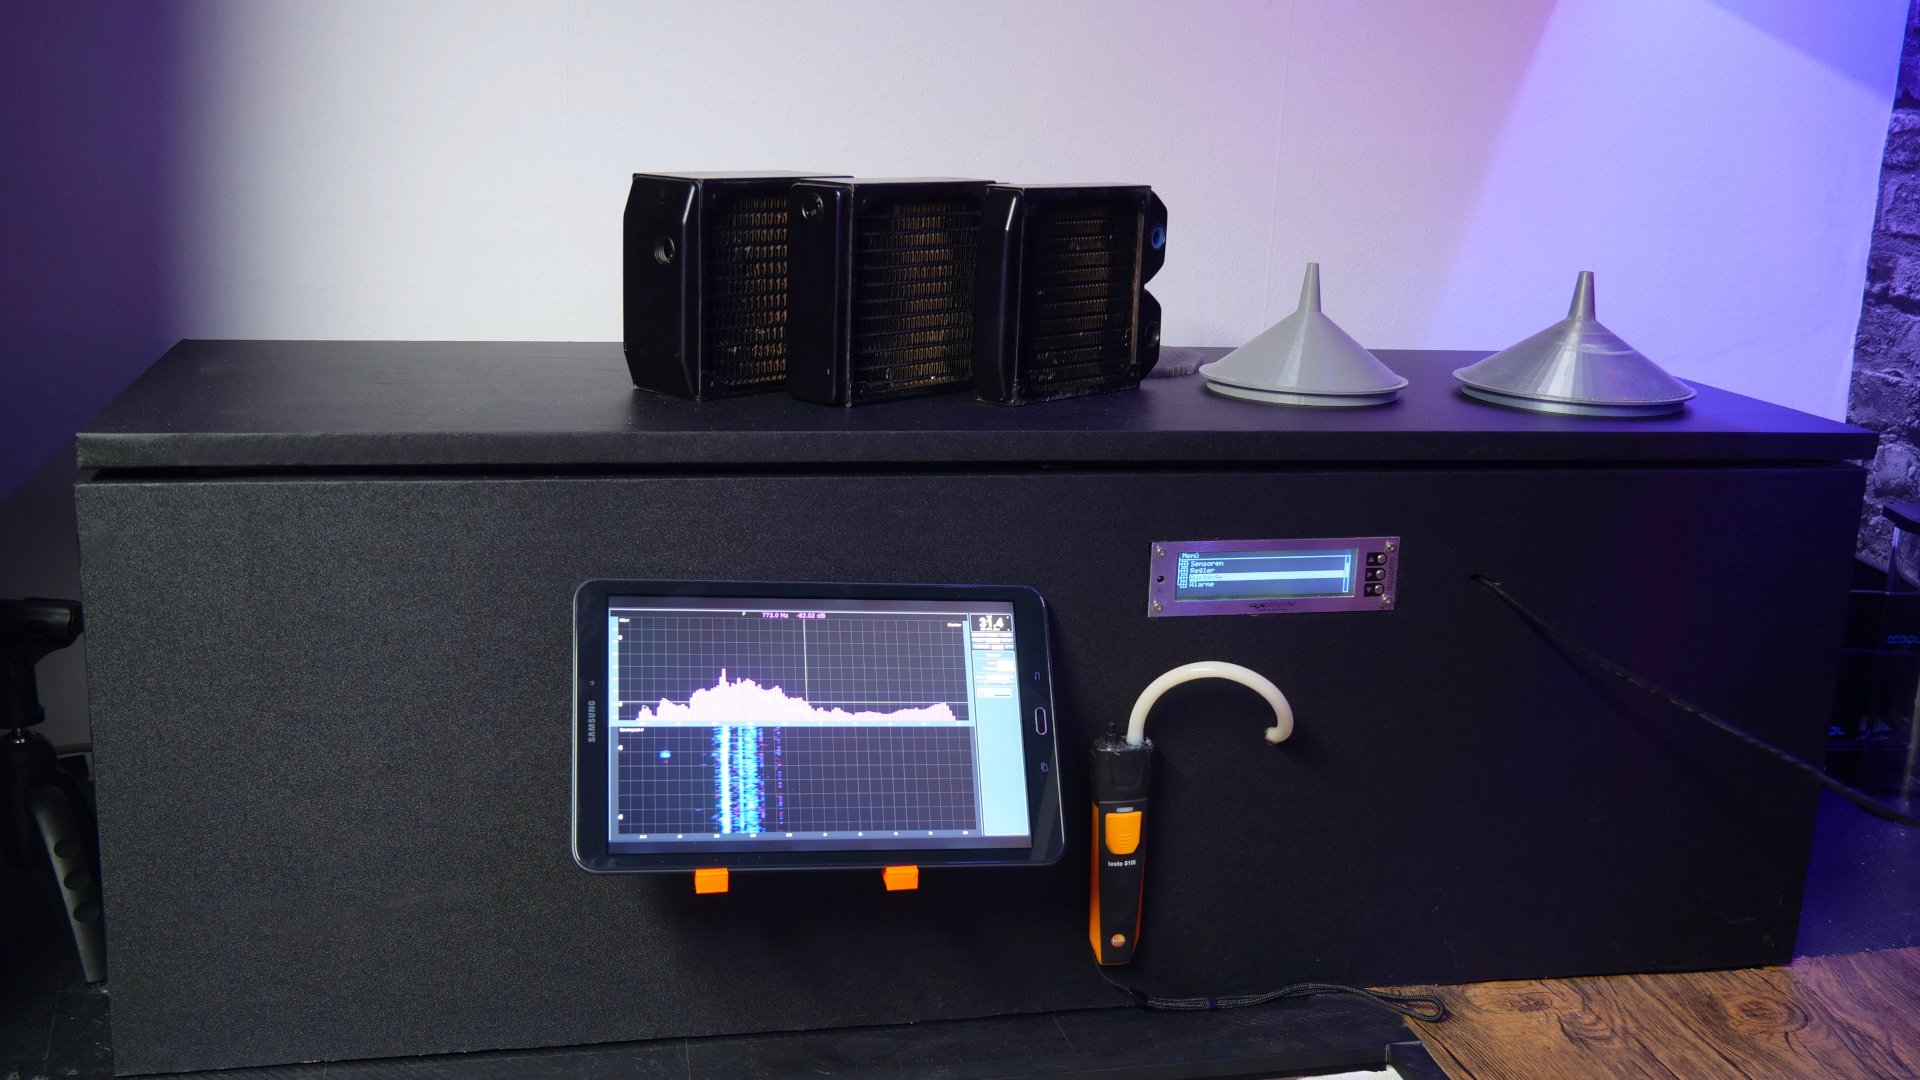
We measure the volume flow at the outlet of the second chamber, where the air is blown out. This area is covered relatively accurately by comparative measurement in the measurement setup of the cooling unit partner, so that our measuring device delivers quite reliable results to the electronic measurement data acquisition, which coincide quite well with the reference data of the professional measurement. What is important here is not the price of the equipment, but rather the expedient positioning and accurate calibration with countless series of comparative measurements.
The control is done by an Aquaero from Aqua Computer purchased by us, so we can control and test the fans both by voltage (DC) or by PWM. We need both, because many fans, as some people don’t know, can’t be brought to the lower and upper limits of the speed range with pure voltage control and also show other anomalies, which we will also write about at the appropriate place in the individual tests.
Static pressure
The measurement of the static pressure is done as usual as a differential pressure measurement. For this purpose, the special “cup” is clamped in such a way that it closes airtight. Here too, of course, we used borrowed, professional equipment for remeasurement and time-consuming calibration. For this measurement, we also use a device we purchased ourselves and also collect the data wirelessly. Since many now try to copy, the angles of the cups are of course secret, because without knowledge of the exact dimensions of the funnel, a replica is virtually pointless and it also only really works quite accurately within a fairly small tolerance range. We have also made comparative measurement series for this. In practice, the whole thing looks like on the picture below.
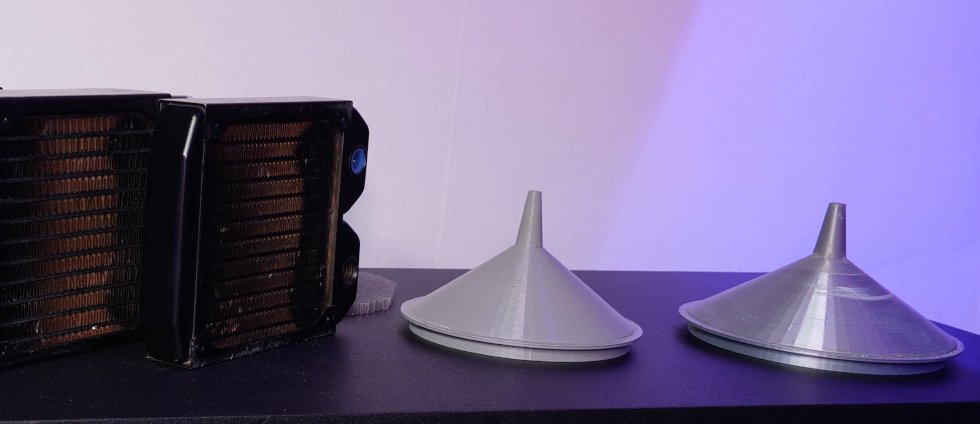
The installation is problem-free and the self-printed pressure receptacles (see picture above) now close perfectly thanks to a special ultra-soft seal. The rest is just a matter of calibration, which we also had to do. It’s unlikely to be much more accurate with such semi-professional methods. However, especially when measuring the pressure, errors are quickly possible, which are above all not immediately recognizable. Even if the deviations are small, we had to measure everything again at the beginning.

Noise emission (“loudness”)
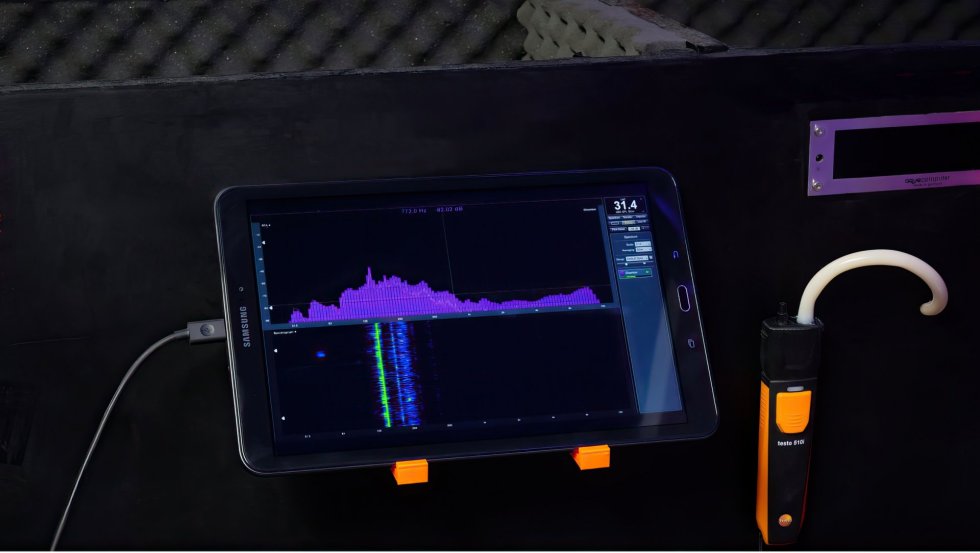
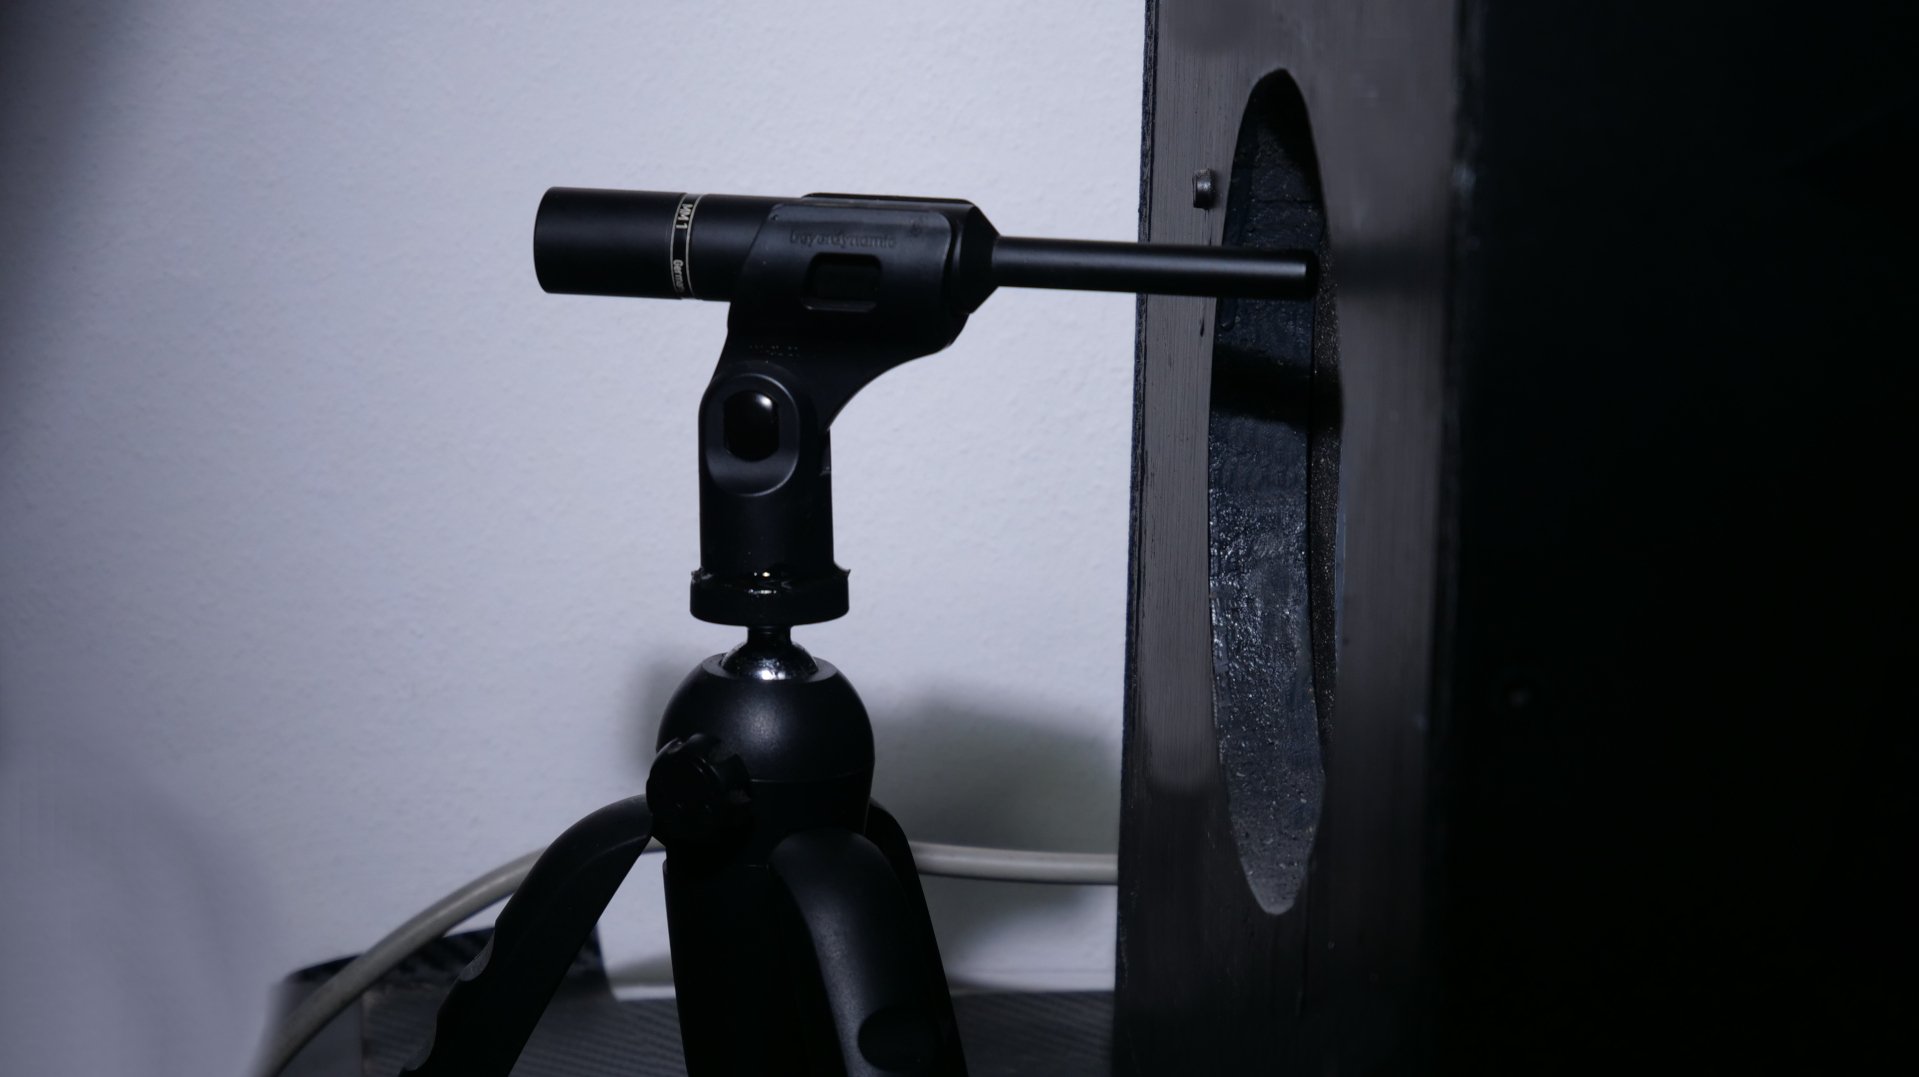
Measuring the noise level is a bit tricky, but works quite well in the evening hours at the measurement location in the isolated and tempered chamber. We deliberately chose dBA because values below one sone can hardly be reliably recorded with still affordable and calibrated equipment and the software conversions of various software programs tend to confuse and become inaccurate in this low range. Then rather dBA, especially since most can start something with it. The measuring distance is 50 cm to the center axis of the fan input.
One of our own purchases is a calibrated measurement microphone with XLR connector and low-noise USB interface. Here, too, several specimens had to be tested against each other to find the microphone with the best signal-to-noise ratio. The measurements are made in the evening and night hours in rural areas with a hard low cut at 50 Hz, so that one can already be quite satisfied with a basic level of under 25 dB(A). Since everything will be above this anyway during the measurement setup with a distance of 50 cm, this should therefore not be a problem. The noise that can be heard in the normalized audio recordings is low enough not to distort the measurements.
We also took the feedback from the community and evaluated the frequency band for each measurement, so you not only get the SPL values (sound pressure) in dB(A), but also a nice frequency analysis that helps to describe the sound character perfectly. Bearing or motor noise, vibrations or the tearing noise on the rotor – everything becomes mercilessly visible with this.
However, we will not go into details and solutions here, because there is still some foreign know-how in this setup and some things would probably be too far for the normal consumer. If you are interested and would like to build something like this, please contact us. This also applies to all those who would like to contribute suggestions and hints, because we are still at the very beginning and can also still correct or expand.


209 Antworten
Kommentar
Lade neue Kommentare
Urgestein
Urgestein
Urgestein
1
1
Veteran
Administrator
1
1
Urgestein
Urgestein
1
Veteran
Urgestein
Mitglied
Veteran
Urgestein
Urgestein
Urgestein
Alle Kommentare lesen unter igor´sLAB Community →