


I have always wondered (and in the end also annoyed) why the GeForce RTX 2080 Ti behaves so divertily unwilling when manually overclocking and why ultimately the Founders edition, if you really cool it down, at the same time as your Power Target the limit of what makes sense. Squinting at the card with the highest Power Target ex works and the maximum firmware limit is actually quite silly, because Nvidia knows only too well what you are doing, leaving better or completely shutting it down.
After testing the Founders Edition for launch day and reviewing the MSI GeForce RTX 2080 Ti Gaming X Trio, I quickly realized that the chipmaker has already clearly explored where the limits of what is reasonable and what is still justifiable lie. Anything else can be done without physical intervention or without simply forgetting the participation of initiates, because it simply cannot be done. Well cooled, as with the MSI Trio, it's just below 350 watts, no matter what you set as a Power Target. Because of me, you can also turn upside down. It doesn't change anything at first.
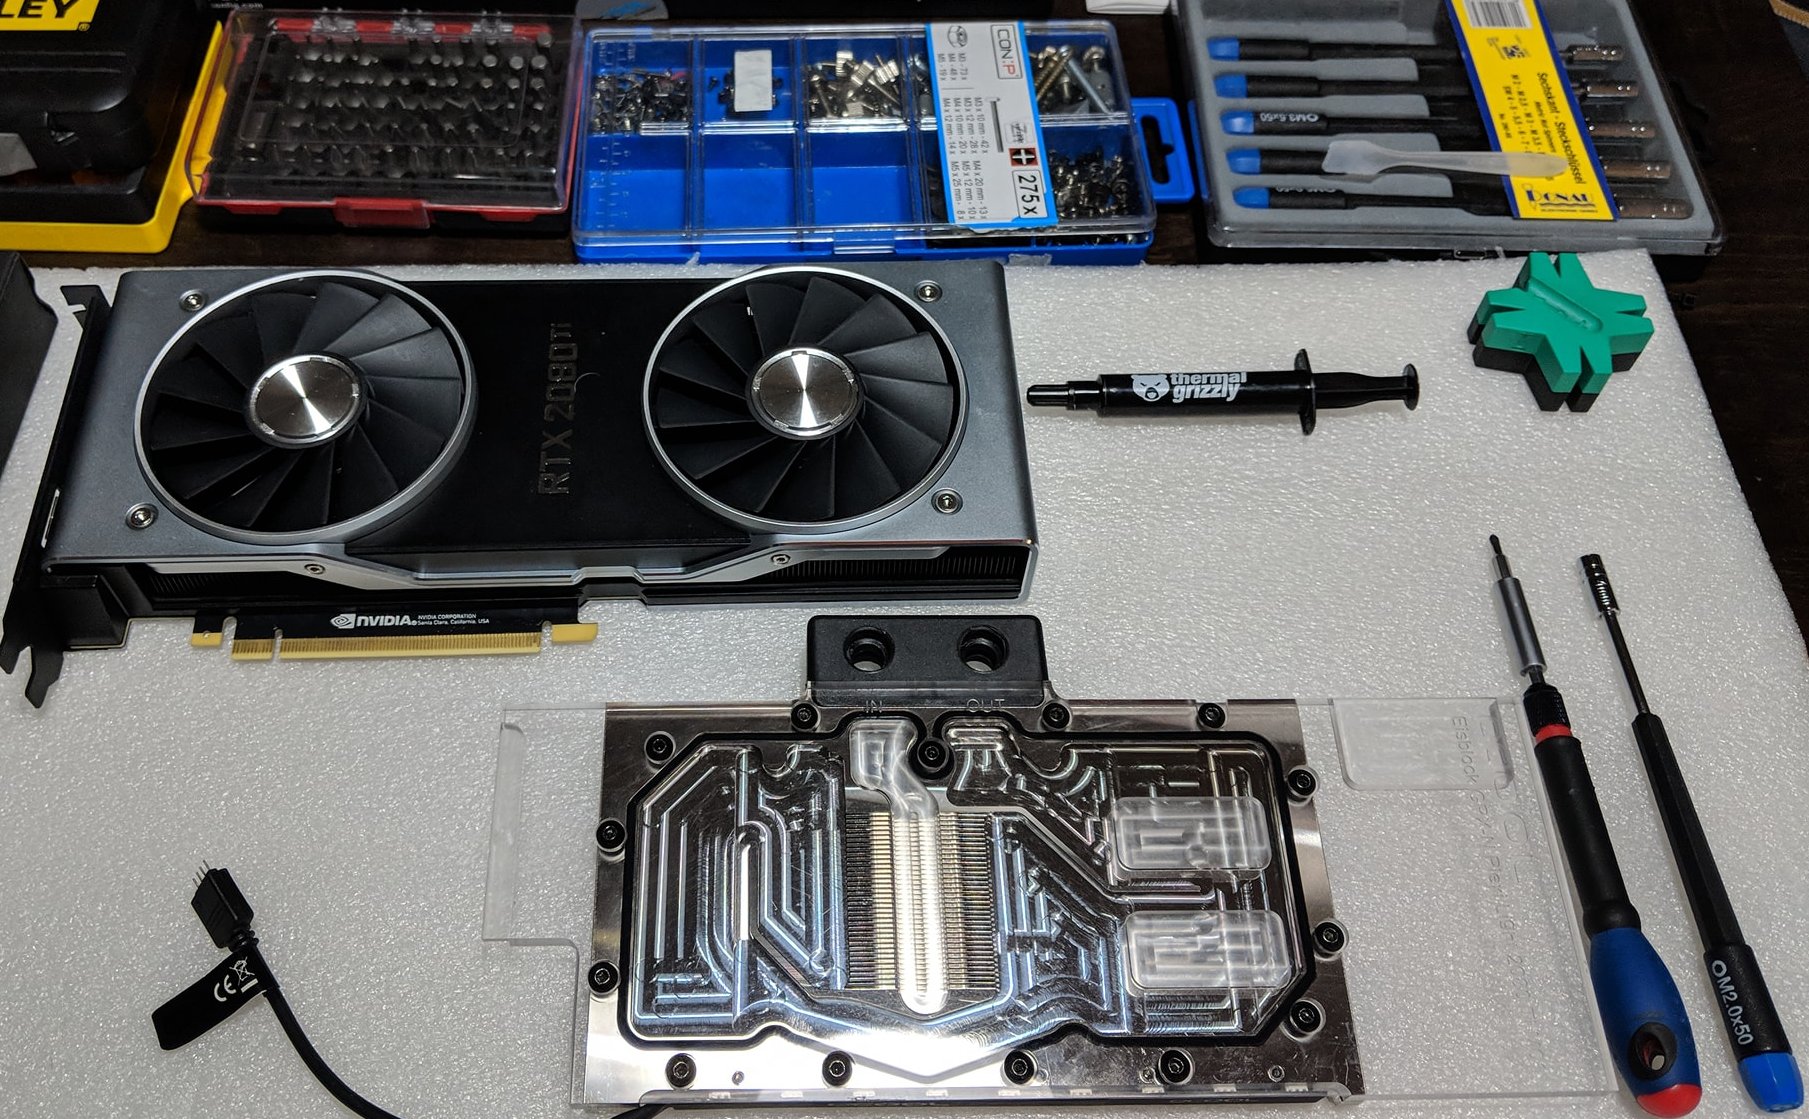
Although there are of course already some tests, that even a normal water cooling is hardly able to skip the 2.1 GHz barrier stable, it offers quite a few advantages that are worth thinking about! Since a suitable prototype of a fullcover block was at hand here, I also used exactly this one to explore what advantages one could have outside the extreme overclocking of such a cooling system. If anything.
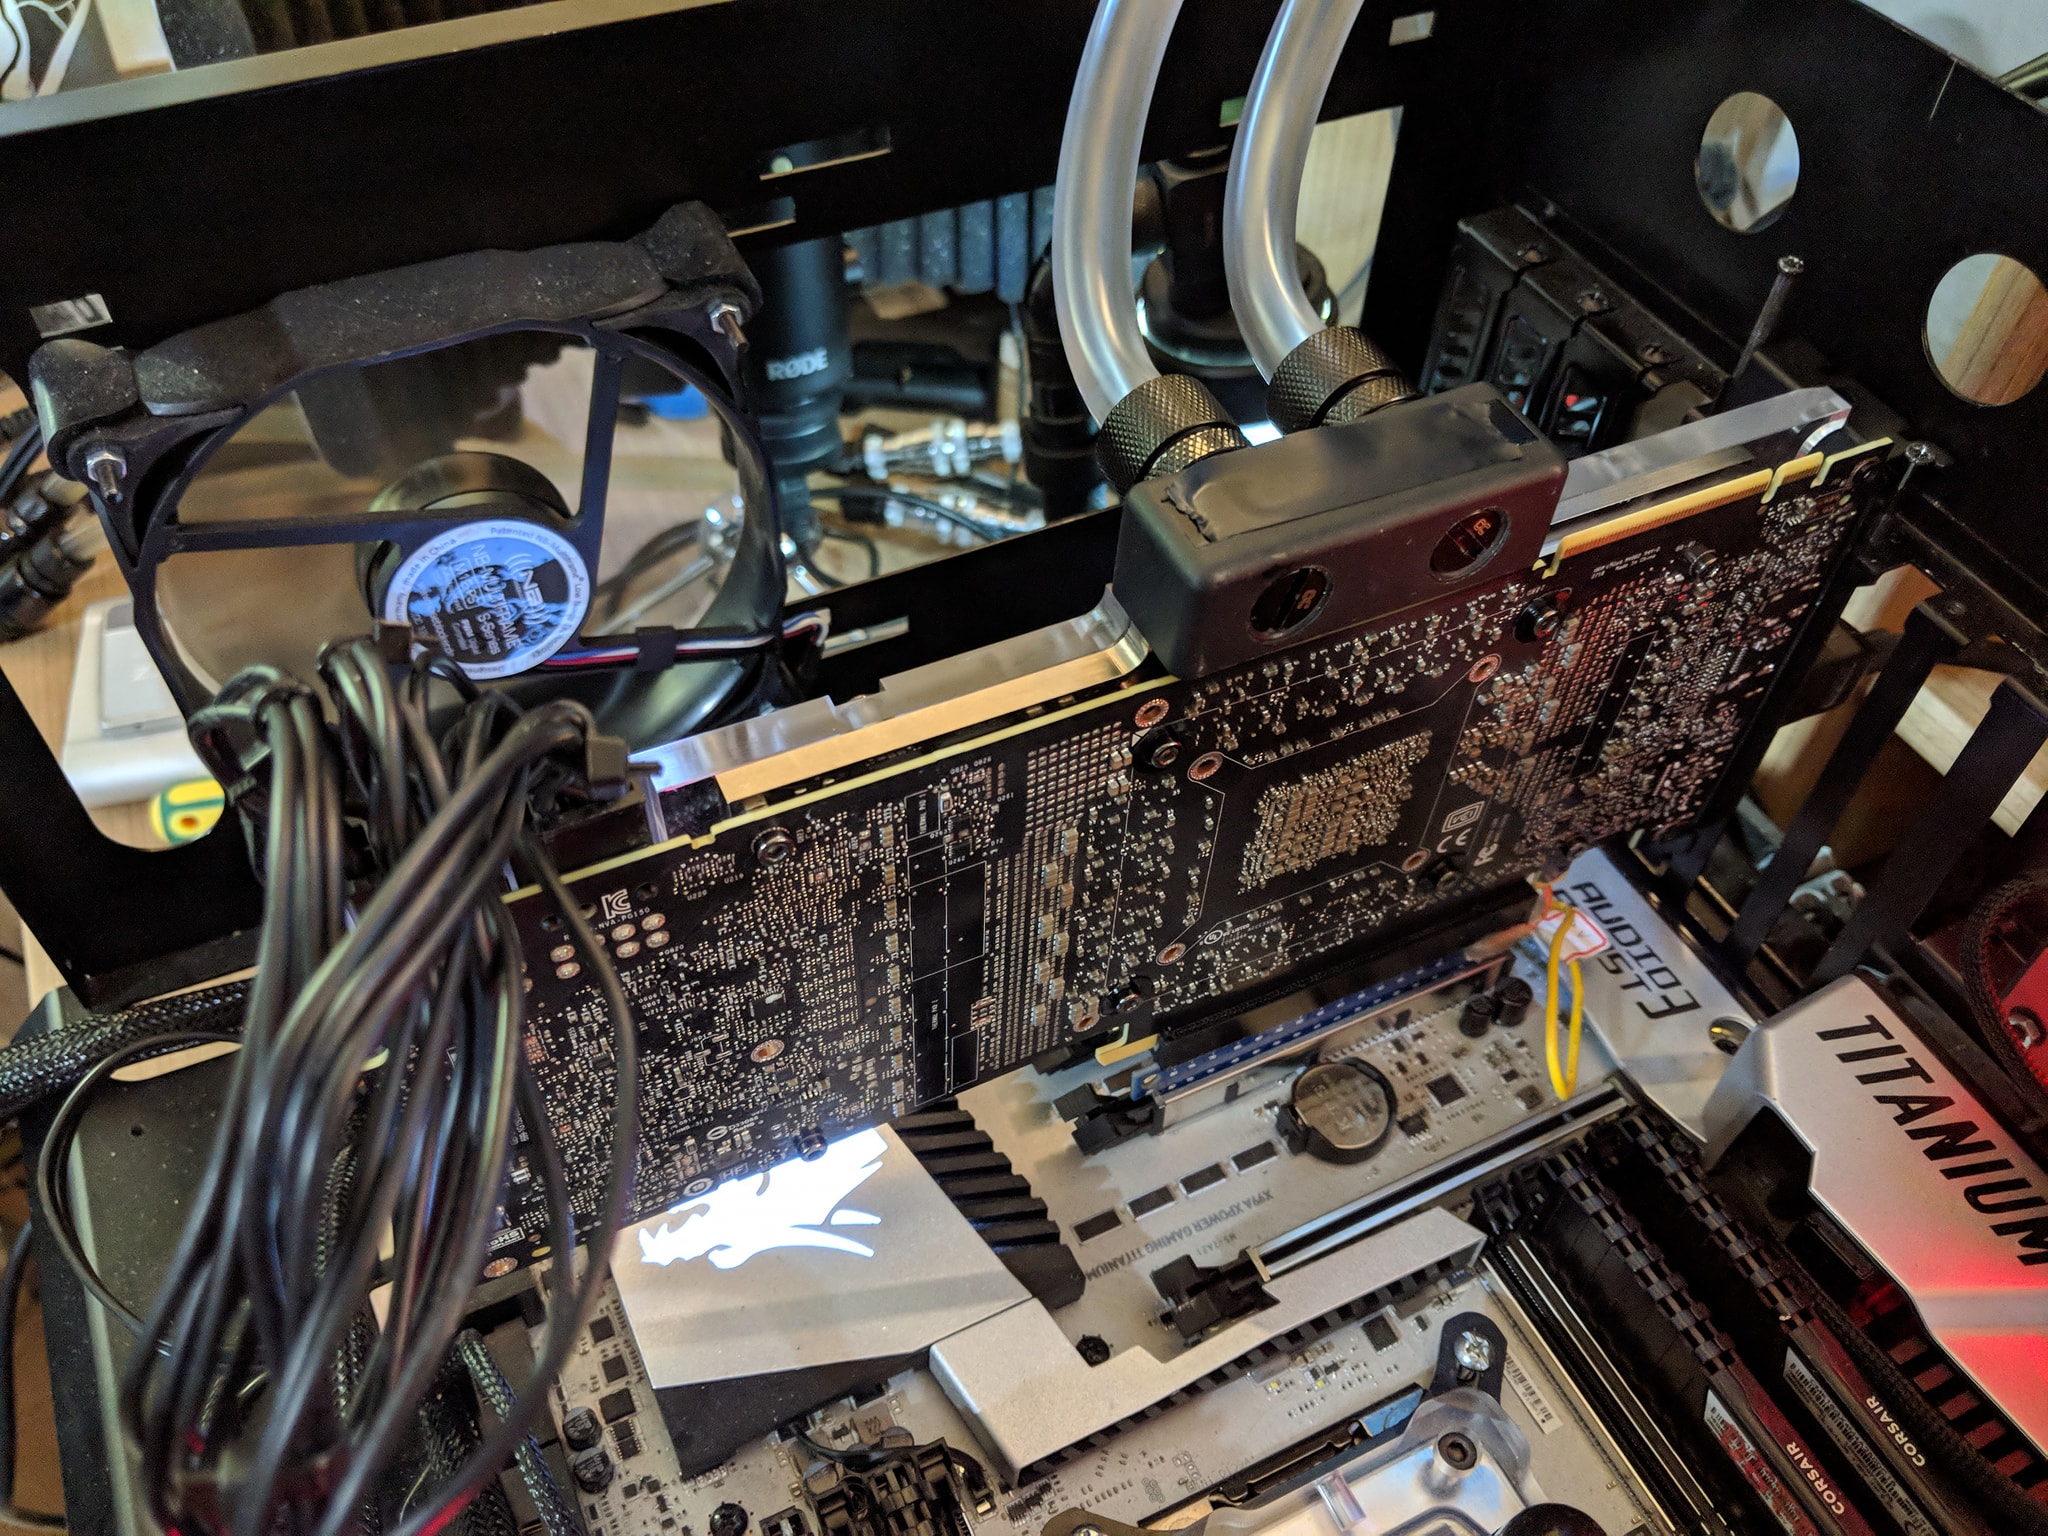
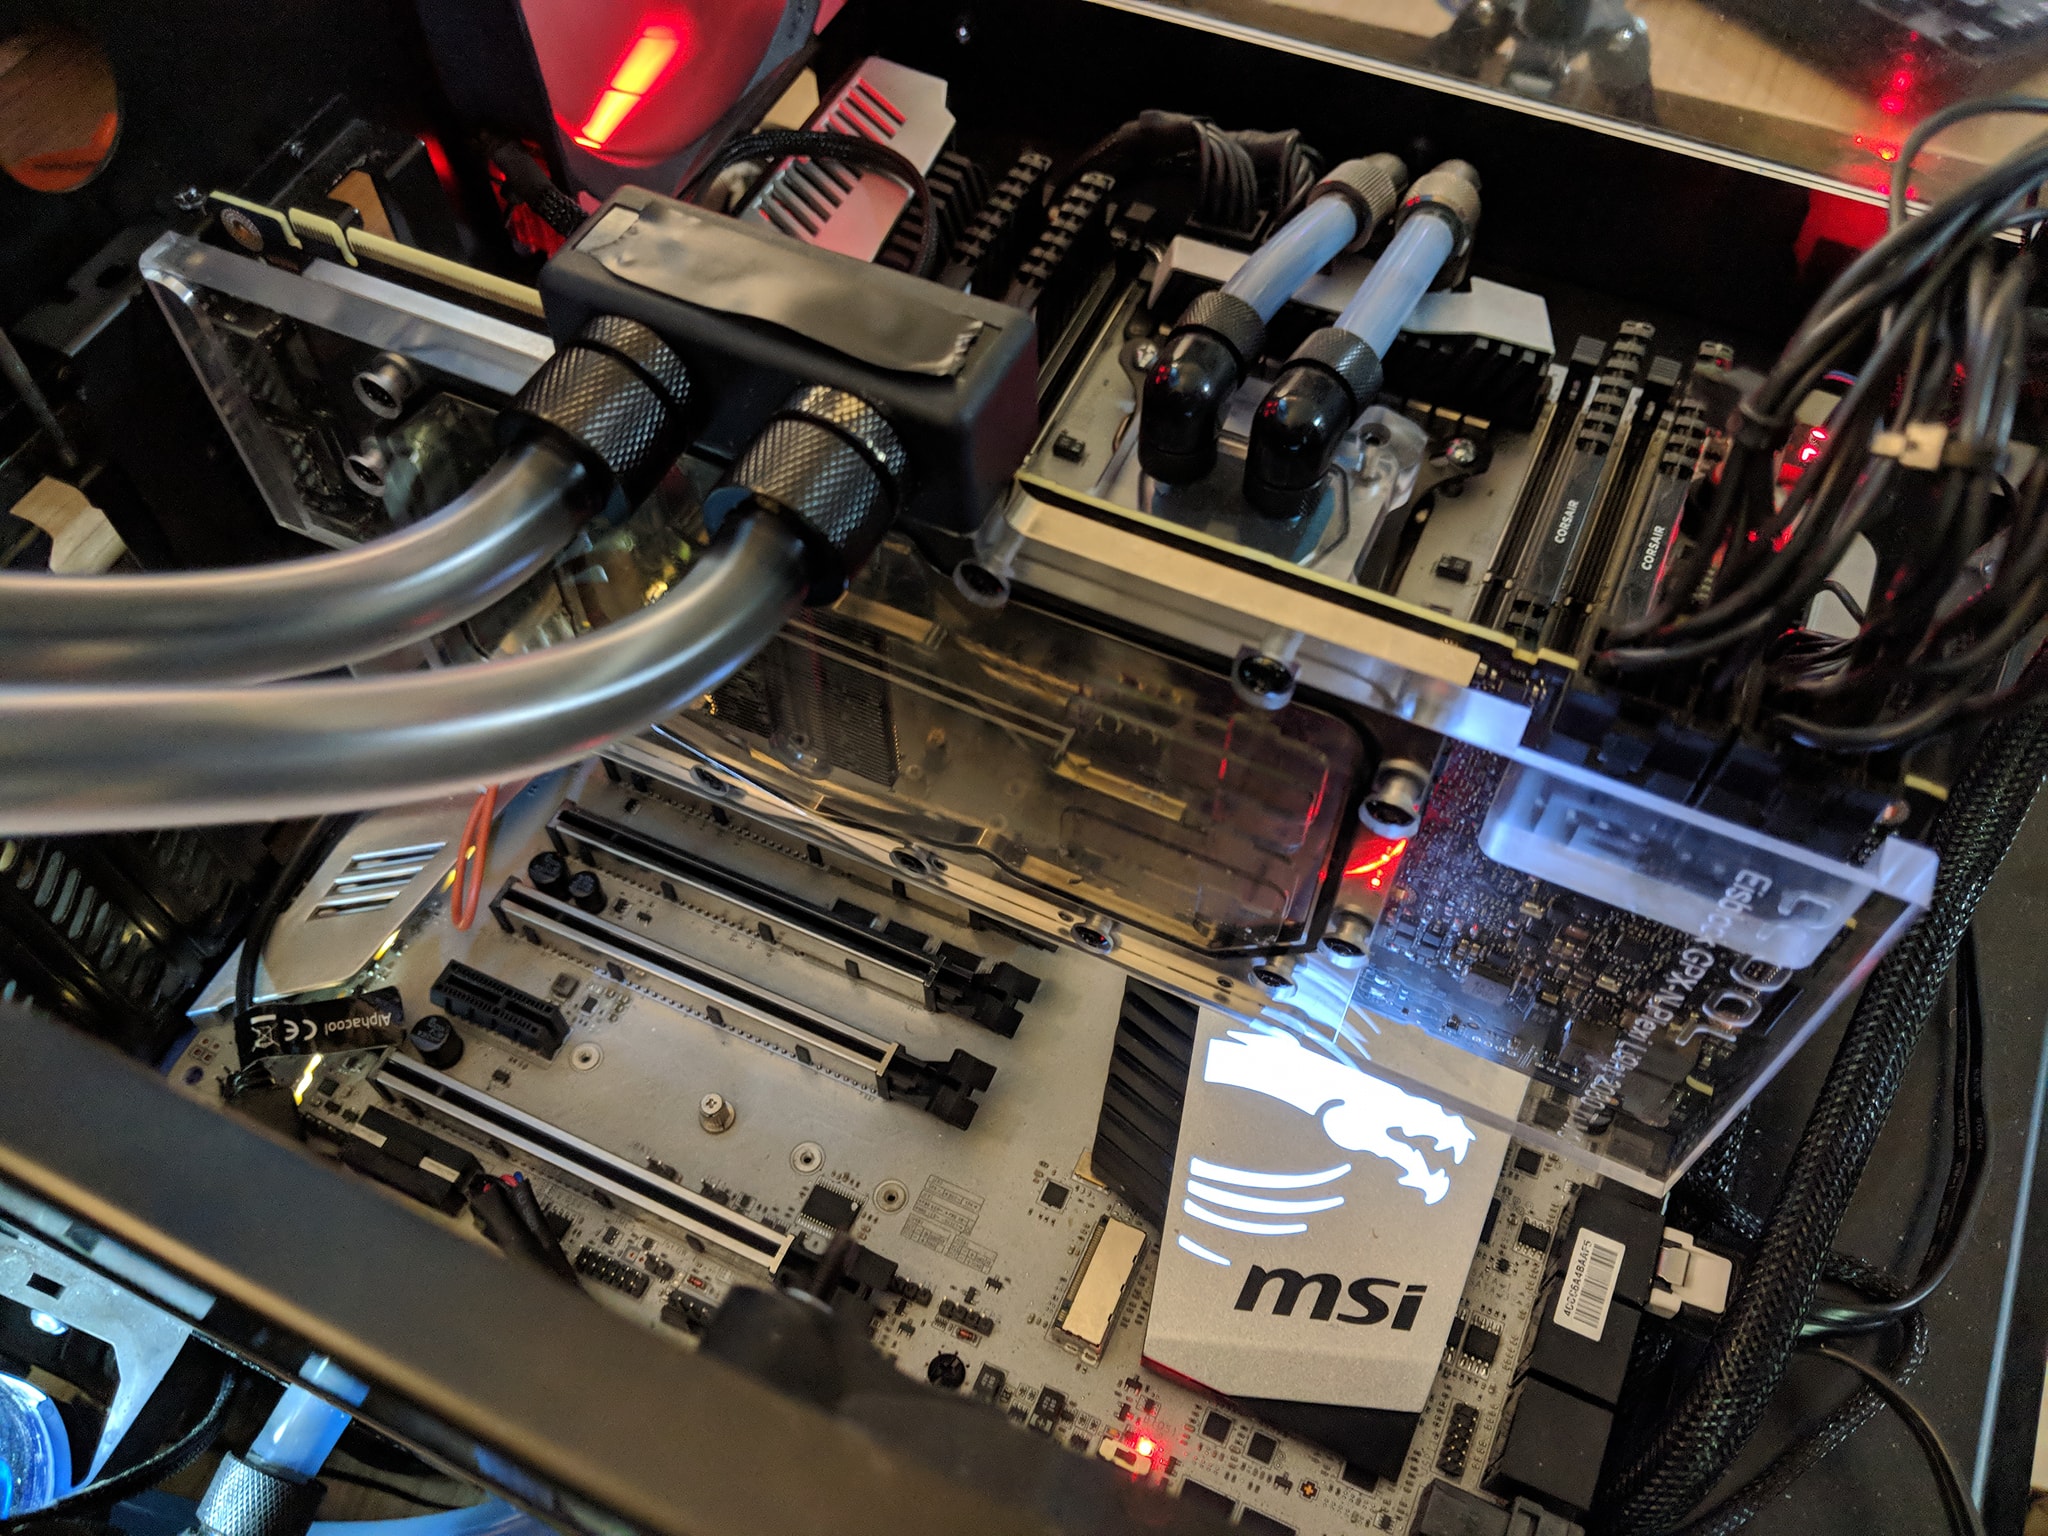
But with the Chiller alone, this is hardly feasible as a comparison over the entire temperature spectrum. That's why I logged the map in factory condition and manually overclocked first with the original cooler, then with a good custom loop water cooling and various water temperatures (50, 40, 30 degrees), as well as the chiller with a water temperature of 20°C. The result is astounding in several respects and quite remarkable.
The yellow curve shows the card in the delivery state, the white one with maximum set clock, highest power target and a small voltage syringe. If one now compares the actual boost clock with the temperature curve, then one quickly sees that one already achieves a very high gain by lower temperatures alone. The clock difference between factory OC and manual OC becomes greater the cooler the card is operated, logically.
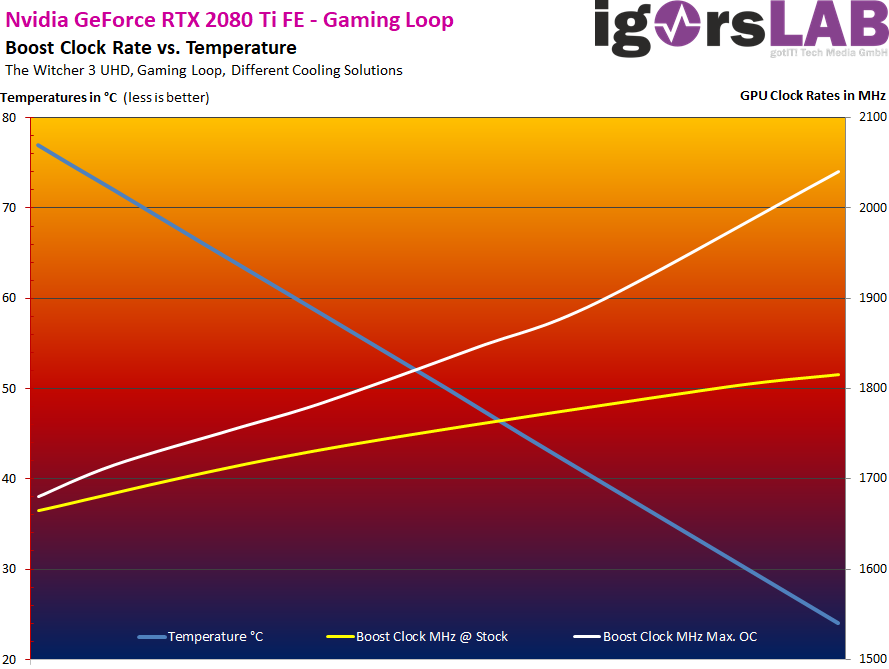
This is simply because the card is constantly running into the Nvidia-given Power Target. But it gets much worse when you look at how expensive you have to buy the manual overclocking! The first 150 MHz more can be obtained almost free of charge through a consistent cooling, whereby the 3 watts seem almost inexpensive. If you give the monkey sugar and increase the power target, the tension and the beat, then it goes again about. 200 MHz faster. But at what cost?!
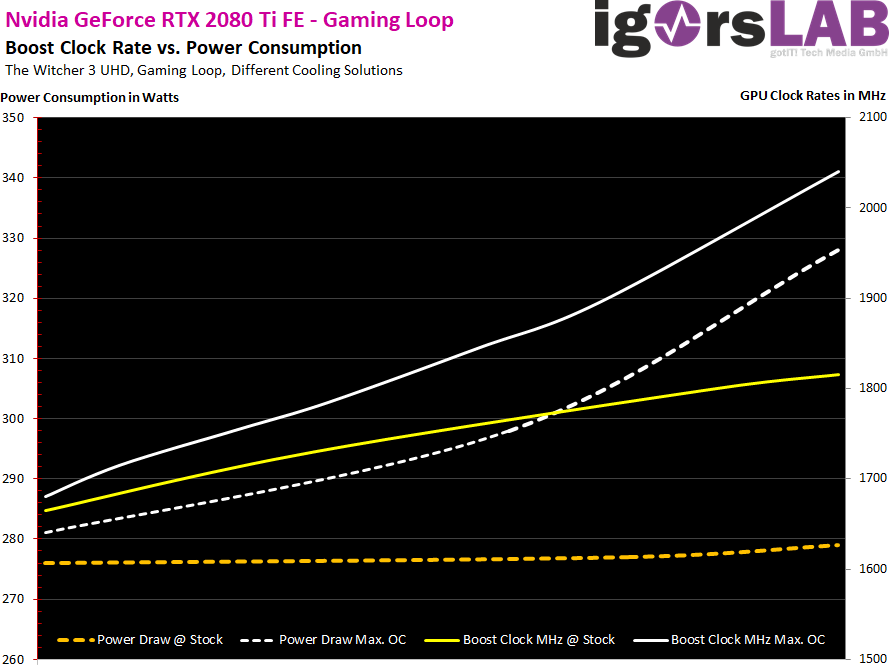
For just 200 MHz more you have to spend on average up to 60 watts more socket gold, which in the end seems really pointless. Depending on the game, you will win again approx. 6 to 8% more performance, which is actually superfluous with such a card. If one compares the total possible 350 MHz by better cooling AND the manual overclocking, then it looks a little better, but it does not change the overall conclusion at first. Turing is nice and new, but an overclocking wonder really looks different. But this is not conducive to the usual popular sport, but one will probably have to live with it.
It is always worth submerged these cards and benefiting from the increased boost quasi for free. The rest gets to the egg dance around the glowing socket. Whether you really want or need it, i.e. everyone will have to make up for themselves. Personally, I would actually leave it.
Update from September 30, 2018
I have now been able to test a KFA2 (Galax) RTX 2080 Ti, which also comes to the customer with a power limit of 380 watts entered in the firmware (126% possible via controller). Thus, at 82°C chip temperature, at least actually measured 1980 MHz was possible. But if you cool this GPU to approx. 50°C, then we are again only at approx. 350 watts. The now "missing" 27 watts could therefore be explained by leakage currents.
Interestingly, however, the clock did not increase significantly with decreasing power consumption, but also ran into the same barrier at approx. 2025 to 2040 Mhz, like other maps. In the end, the larger power limit only helps to approximate the same clock rates for smart coolers, as you can already find with better cooled cards without the extra use of electrical power anyway. A higher overclocking does not bring this, but only a similar clock at higher operating temperatures.
Teaser: After further water cooling blocks arrive, I will also compare the coolers and the respective GPU or board temperatures. The block of EKWB is already in the influx, others are already requested
Test system and measurement methods
We have already described the new test system and the methodology in detail in the basic article "How We Test Graphics Cards, as of February 2017" and therefore refer to this detailed basis for simplicity. Description. So if you want to read everything again, you are welcome to do so. However, we have again improved CPU and cooling to largely exclude possible CPU bottlenecks for this fast card.
If you are interested, the summary in table form quickly provides a brief overview:
| Test systems and measuring rooms | |
|---|---|
| Hardware: |
Intel Core i7-6900K -4.5GHz MSI X99S XPower Gaming Titanium G.Skill TridentZ DDR4 3600 1x 1 TByte Toshiba OCZ RD400 (M.2, System SSD) 2x 960 GByte Toshiba OCZ TR150 (Storage, Images) Be Quiet Dark Power Pro 11, 850-watt power supply |
| Cooling: |
Alphacool Ice Block XPX 5x Be Quiet! Silent Wings 3 PWM (Closed Case Simulation) Thermal Grizzly Kryonaut (for cooler change) |
| Housing: |
Lian Li PC-T70 with expansion kit and modifications |
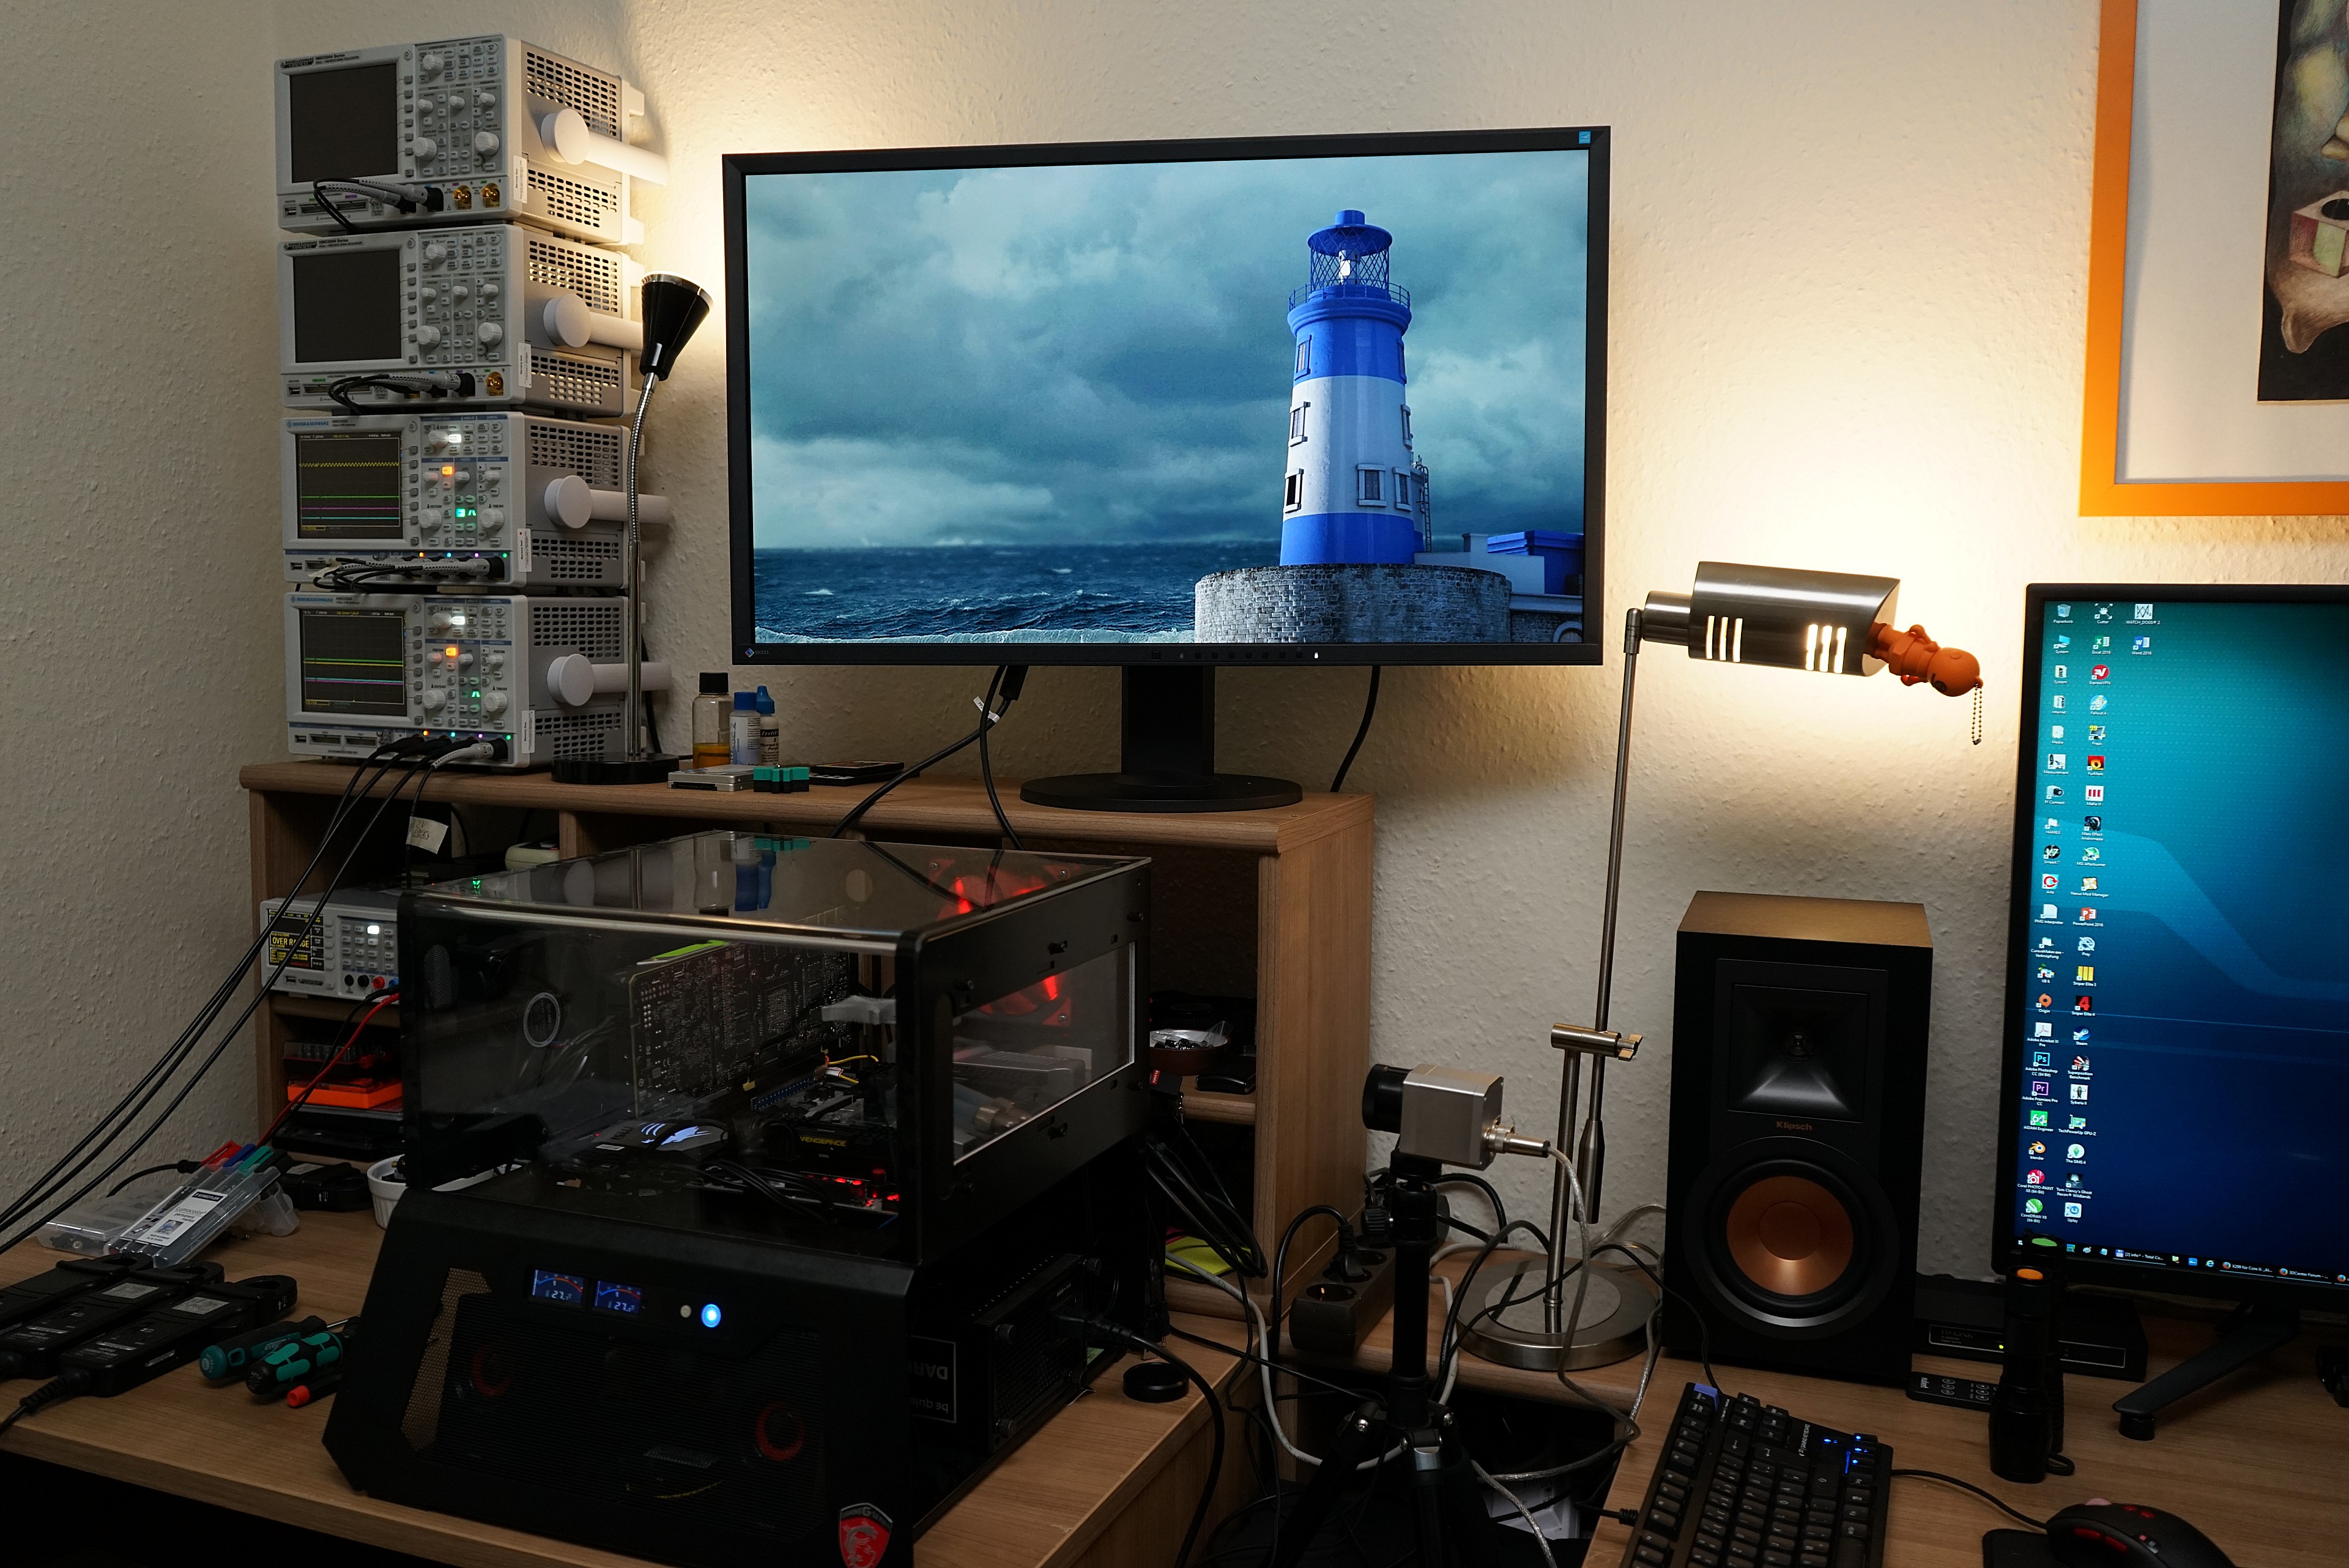
| Monitor: | Eizo EV3237-BK |
| Power consumption: |
non-contact DC measurement on the PCIe slot (Riser-Card) non-contact DC measurement on the external PCIe power supply Direct voltage measurement on the respective feeders and on the power supply 2x Rohde & Schwarz HMO 3054, 500 MHz multi-channel oscillograph with memory function 4x Rohde & Schwarz HZO50, current togor adapter (1 mA to 30 A, 100 KHz, DC) 4x Rohde & Schwarz HZ355, touch divider (10:1, 500 MHz) 1x Rohde & Schwarz HMC 8012, digital multimeter with storage function |
| Thermography: |
Optris PI640, infrared camera PI Connect evaluation software with profiles |
| Acoustics: |
NTI Audio M2211 (with calibration file) Steinberg UR12 (with phantom power for the microphones) Creative X7, Smaart v.7 own low-reflection measuring room, 3.5 x 1.8 x 2.2 m (LxTxH) Axial measurements, perpendicular to the center of the sound source(s), measuring distance 50 cm Noise in dBA (Slow) as RTA measurement Frequency spectrum as a graph |
| Operating system | Windows 10 Pro (1803, all updates) |


Kommentieren