


I had already teased this follow-up in the launch article for the Radeon RX 590 and thus also promised the readers, only such a cluster of never-ending measuring series then takes a little longer than expected. After a few hours, I stopped counting how many times I was subvolting towards the desktop or the Back/Greyscreen i crashed. But in the end, the result counts and that is quite impressive.
What I was able to take with me as a summary of the forum posts, emails received and the contacts on social media after the launch article was the question of the exact differences between Polaris 20 and Polaris 30. Sure, I also measured and benchmarked for the launch, but what is always missing in such situations before a launch is the time unfortunately needed for further experiments.
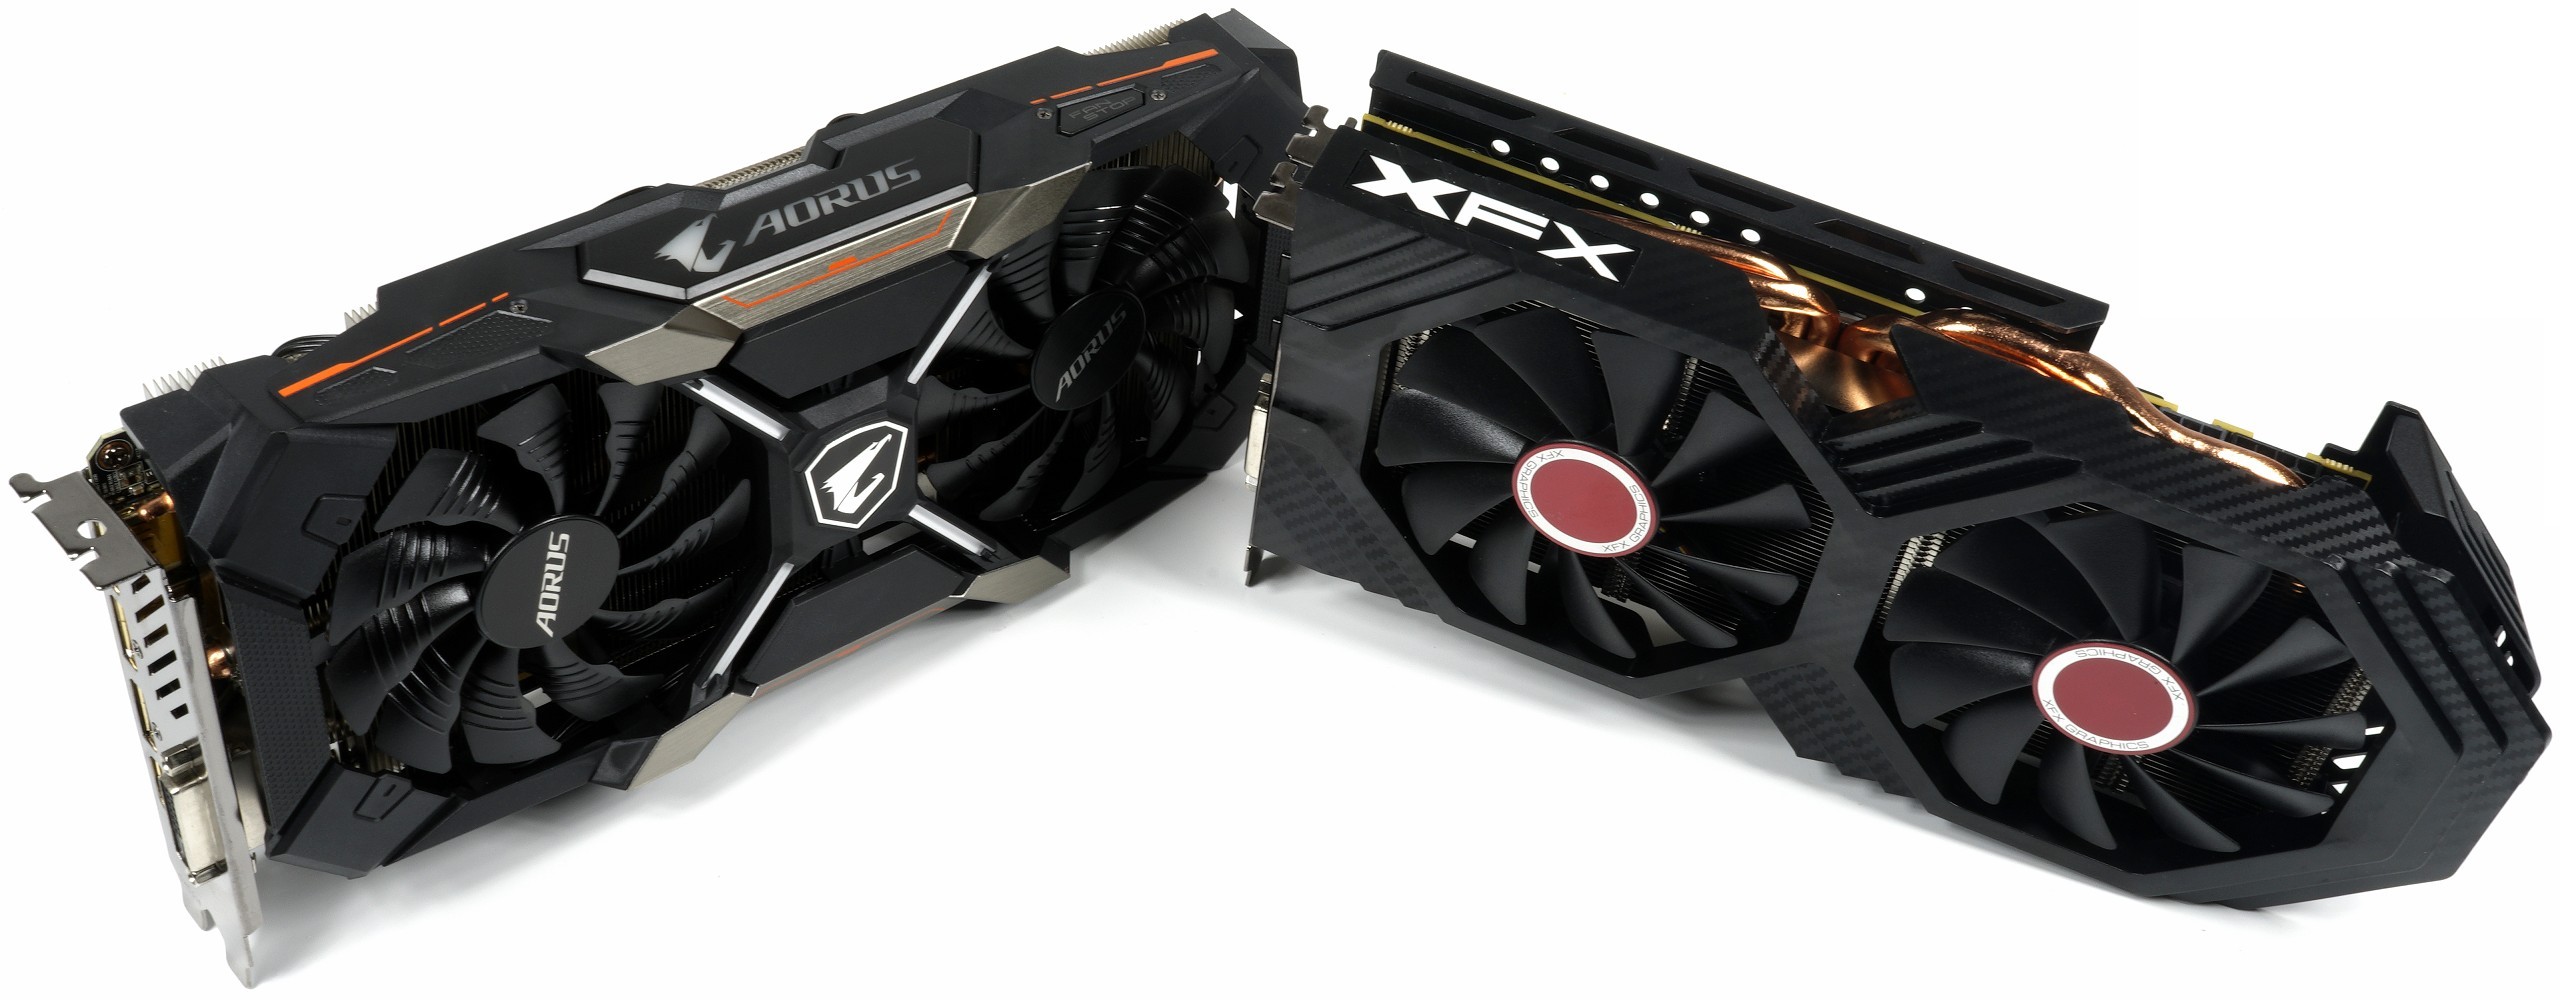
In today's comparison, I picked out two cards with which I can easily reach the "cotz limit" of the respective chip, which I like to reach and which are nevertheless also suitable for the sub-volt. And so I put the up to 1600 MHz fast XFX RX 590 FatBoy against the Aorus RX 580 OC. While the RX 590 is still stable at 1600 MHz, but then for every MHz the socket is ruthlessly choked, the RX 580 only works up to 1450 MHz.
I have therefore set these values for both cards as the upper limit of this, since even then an undervoltage could lead to good and, above all, stable results. Conversely, it makes no sense to continue these measurements below 1200 MHz, since the minimum possible voltage of both cards also ran exactly there with the sub-voltage. Less was then no longer without loss of stability and performance.
Of course, the leakage currents and the remaining components of the graphics card up to their fans also play a role in the power consumption values, but I have tried to adjust the temperatures of both cards to each other via the fan speeds so that the temperatures at each of the individual 50 MHz clock steps remained approximately the same for both cards. I measured all the steps of the clock rates for both cards with manual subvolt and the normal Wattman setting (auto function).
Each of the partial measurements was made after the map was warmed up, but for cooling reasons I tested in the open structure. The performance scores are based on a standardized average of three games (Witcher 3, Wolfenstein 2, Assassins Creed Odyssey) and a Pro app (Autodesk Maya 2017). In doing so, I also set the 1200 MHz lower limit of my measurements as a 100% mark in order to be able to assess the clock increases more clearly.
This time, the power consumption measurements were made via a special riser card with USB interface, so that I could log everything on a second PC in parallel with the performance. The intervals of 100 ms chosen for transmission (internally significantly higher resolution and then averaged) are still accurate enough for these long-term measurements, because in the end this results in a very practical and thus also representative average, which is also slightly below what Witcher 3 produces as a single application at maximum load.
So nothing stands in the way of the clock aria. After all, I had to make more than 50 measurements, many of which had to be repeated several times because of the undervoltage and the usually not the same crashes. By the way, Wattman has become much more stable, you can't praise that enough, but this software is still not perfect. But it's getting slow, at least for Polaris & Co.
Let's quickly compare the initial data of the two maps and those of the possible comparison models in tabular form and then plunge into the curve and bar pleasure on the next page:
| Nvidia Geforce GTX 970 |
Nvidia Geforce GTX 1060 |
Amd Radeon RX 480 |
Xfx RX 590 Fatboy |
Aorus RX 580 Oc |
Amd Radeon R9 390X |
|
|---|---|---|---|---|---|---|
| Shader Units |
1664 | 1280 | 2304 | 2304 | 2304 | 2816 |
| Rops | 56 | 48 | 32 | 32 |
32 | 64 |
| Gpu | GM204 | GP106 | Ellesmere | Ellesmere ("Polaris 30") |
Ellesmere ("Polaris 20") |
Hawaii/ Grenada |
| Transistors | 5 billion | 4.4 billion | 5.7 billion | 5.7 billion | 5.7 billion | 6.2 billion |
| Memory | 4 GB | 6 GB | 8 GB | 8 GB | 8 GB | 8 GB |
| Interface | 256 bit | 192 bit | 256 bit | 256 bit | 256 bit | 512 bit |
| GPU clock Mhz |
1051+ | 1506+ | 1266 | 1580 |
1425 | 1050 |
| Memory clock Mhz |
1750 | 1750 | 2000 | 2000 |
2000 | 1500 |
Test system and measurement methods
We have already described the new test system and the methodology in detail in the basic article "How We Test Graphics Cards, as of February 2017" and therefore refer to this detailed basis for simplicity. Description. So if you want to read everything again, you are welcome to do so. However, we have now greatly improved the CPU and memory in order to be able to exclude possible CPU bottle necks for fast cards.
If you are interested, the summary in table form quickly provides a brief overview:
| Test systems and measuring rooms | |
|---|---|
| Hardware: |
Intel Core i7-8700K x 5 GHz MSI Z370 Gaming Pro Carbon AC 2x 8GB KFA2 HoF DDR4 4000 1x 1 TByte Toshiba OCZ RD400 (M.2, System SSD) 2x 960 GByte Toshiba OCZ TR150 (Storage, Images) Be Quiet Dark Power Pro 11, 850-watt power supply |
| Cooling: |
Alphacool Ice Block XPX 5x Be Quiet! Silent Wings 3 PWM (Closed Case Simulation) Thermal Grizzly Kryonaut (for cooler change) |
| Housing: |
Lian Li PC-T70 with expansion kit and modifications Modes: Open Benchtable, Closed Case |
| Monitor: | Eizo EV3237-BK |
| Power consumption: |
Long-term measurements over 4 games: USB Riser Card with Remote Monitoring and Logging (100 ms) Plausibility and control measurements: |
| Thermography: |
Optris PI640, infrared camera PI Connect evaluation software with profiles |
| Acoustics: |
NTI Audio M2211 (with calibration file) Steinberg UR12 (with phantom power for the microphones) Creative X7, Smaart v.7 own low-reflection measuring room, 3.5 x 1.8 x 2.2 m (LxTxH) Axial measurements, perpendicular to the center of the sound source(s), measuring distance 50 cm Noise in dBA (Slow) as RTA measurement Frequency spectrum as a graph |
| Operating system | Windows 10 Pro (1809, all updates), driver as of 10.11.2018 |


Kommentieren