 I have to preface today’s post with a little paragraph first, as I want to take the whiff of sensationalism out of it. Nevertheless, you have to write about it and you also have to test it out emotionlessly beforehand. The video from Hardware Unboxed didn’t even surprise me that much, because we were able to make very similar observations about lags and latencies in a current test project (thanks to Fritz Hunter!) and were almost despaired by the inconsistency of some measurement data in the beginning.
The article about the latency measurements is still to come, of course, but today I created a series of measurements and documented them in detail.
Important preliminary remark
The colleagues at Hardware Unboxed can certainly be trusted to know exactly what and how they tested it all. Therefore, I have ruled out repeating and reproducing it for myself. It’s just not purposeful because it would be redundant content. That’s why I changed the approach completely. I did that with full intent, even though it may leave a question or two unanswered. But I’m not the only tester in the world and I’m happy to leave the rest to others due to time constraints.
In order to be able to exclude all possible influences by different motherboards, CPUs, memory modules and operating system installations, I created all benchmarks with an exemplary DirectX12 game on one and the same platform, which scales from 2 up to 8 cores (SMT on each) still cleanly over 4 to 16 threads. The game uses two graphics cards from NVIDIA and AMD that are roughly equally fast at WQHD resolution, as well as a Ryzen 7 5800X that I’ve gradually reduced to 2 cores / 4 threads to create the CPU bottleneck. Current drivers are installed and the game has been fully patched. The screen resolution ranges from 720p, 1080p and 1440p to 2160p.
As a game, I’m intentionally using Horizon Zero Dawn because my guess as to why there might be these documented performance drops is in a slightly different direction than a mere driver overhead. The game makes fairly extensive use of asynchronous compute, which is a type of multithreading that is supposed to make it possible to better distribute workloads to the GPU. In addition, a so-called single pass downsampler is used in the engine, which is supposed to enable asynchronous computation to accelerate texture mapping. If there should be disadvantages in Asynchronous Compute, then exactly this game will be able to represent it very well.
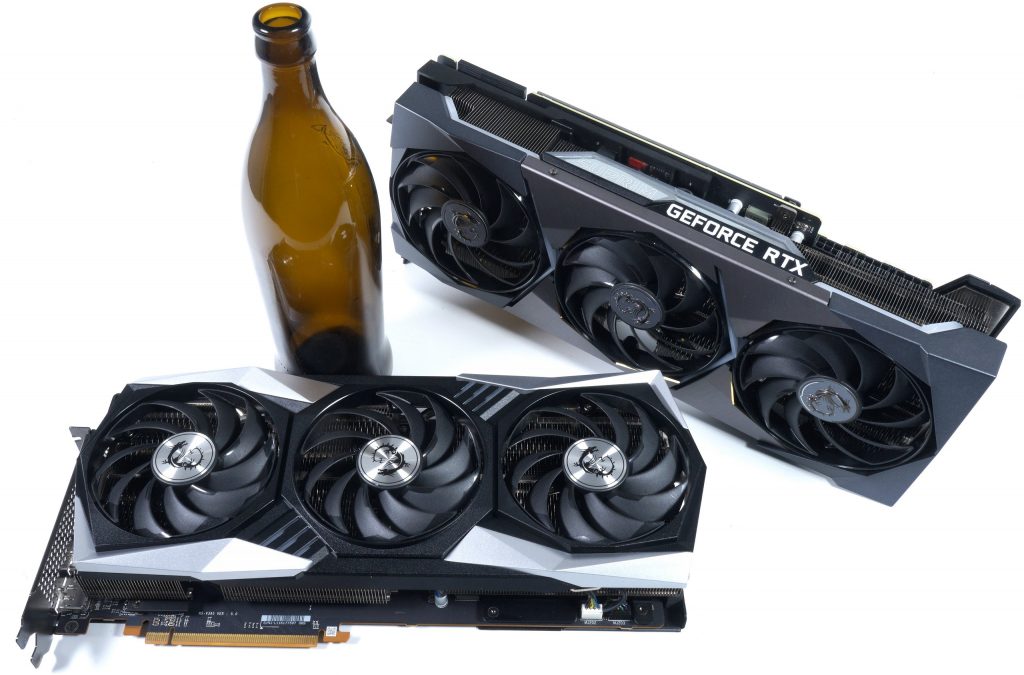
Now let’s move on to the test setup. A water-cooled Ryzen 7 5800X without manual overclocking is used, but PBO is active. In addition 2x 16 GB Corsair Vengeance RGB Pro DDR4 4000 join on the MSI MEG X570 Godlike, which however run since some AGESA versions with 3800 MHz (FCLK 1900 MHz) for stability reasons. As graphics cards I use two factory overclocked custom models in the form of the MSI Radeon RX 6900XT Gaming X Trio and the MSI GeForce RTX 3090 SUPRIM. Evaluated thereafter in the full range of my available metrics, including variances (very revealing!), Power consumption and, logically, efficiency. You’ll be amazed!
Analysis of the minimum configuration and limits
First, I tested at what point the CPU limiting kicks in across all four resolutions. This only happened when using 2 cores / 4 threads and it almost doesn’t matter if you use 4 cores without SMT or 2 cores with SMT, the result is always about the same (bad). The fastest card in 720p reaches just under 200 FPS with 8 cores, but with this minimum configuration it’s then only half that. But only when reduced to those two cores could I measure any significant difference at all in 2160p (Ultra-HD).
This means that I have to run all four resolutions with 2, 4, 6 and 8 cores, which means a total of 16 benchmarks per card. However, I ran these 32 runs in total five times each for my safety, with the first two runs cancelled in the warm-up. From the remaining three results, I then always took the record with the performance that most closely matched the average of the three runs scored.
So altogether this results in proud 5 x 32 x 177 seconds (thus scarcely 8 hours) pure benchmark time, in addition conversion and BIOS configuration, storing and evaluating the whole data as well as the whole charts graphics. This takes a little time and applies to those who always think it would be better to completely benchmark 10 games at once. In fact, one, if it’s the right one, is quite enough and also saves up to three cheap volunteers, which unfortunately I don’t even have.
 We can see very nicely the constant limitation of both graphics cards in the complete CPU limit and uniform test environment. Two initial conclusions can already be drawn from this:
The significant limit of the Radeon RX 6900XT in Ultra-HD with the still in WQHD even 7 percentage points faster card also occurs when a CPU bottleneck is already measurable. The disadvantage of the Radeon in 2160p over the GeForce is about the same in percentage terms as the one without limit at 8 cores! It was often said that this would not be a disadvantage, but that the GeForce would only perform better than average in WQHD and below. That, in turn, is not true.
This, in turn, is reproducible because a constant limit occurs in the 2-core measurement from WQHD onwards, regardless of the resolution. The GeForce is then constantly (!) seven percentage points slower under the same conditions.
| Test System and Equipment |
|
|---|---|
| Hardware: |
AMD Ryzen 7 5800X MSI MEG X570 Godlike 2x 16 GB Corsair Vengeance RGB Pro DDR4 4000 (@3800) 1x 2 TB Aorus (NVMe System SSD, PCIe Gen. 4) 1x 2 TB Corsair MP400 (Data) 1x Seagate FastSSD Portable USB-C Be Quiet! Straight Power 11 1000 Watt Platinum MSI GeForce RTX 3090 SUPRIM 24 GB MSI Radeon RTX 6900XT Gaming X Trio 16 GB |
| Cooling: |
Alphacool Eisblock XPX Pr0 Alphacool Eiszeit 2000 Chiller, 20l Reservoir |
| Case: |
Banchetto 101 |
| Monitor: | BenQ PD3220U |
| Thermal Imager: |
1x Optris PI640 + 2x Xi400 Thermal Imagers Pix Connect Software Type K Class 1 thermal sensors (up to 4 channels) |
| OS: | Windows 10 Pro (all updates, current certified or press drivers) |
- 1 - Introduction, test setup, methods and CPU limit
- 2 - Limits with 4, 6 and 8 CPU cores - Core scaling
- 3 - Benchmarks with 1280 x 720 Pixels
- 4 - Benchmarks with 1920 x 1080 Pixels
- 5 - Benchmarks with 2560 x 1440 Pixels
- 6 - Benchmarks with 3840 x 2160 Pixels
- 7 - Possible reasons, Asynchronous Compute and conclusion


143 Antworten
Kommentar
Lade neue Kommentare
Urgestein
1
Urgestein
1
Veteran
1
Veteran
Urgestein
Urgestein
1
Veteran
Urgestein
Veteran
Urgestein
Veteran
Moderator
1
Veteran
Alle Kommentare lesen unter igor´sLAB Community →