With our tests, I can now finally use the new laboratory, which makes many things easier and better for me. But we will write a walkthrough article in due time. By the way, I would like to point out already at the beginning that I was (and am) in connection with MSI in the course of the tests concerning a modified BIOS with lower fan speeds. But more about that later in the article
In order to make the whole thing a little clearer and to get to the point a little bit more, I have kept the structure of the articles to a large extent, but now I rely more on tables with clear representation of the result values and specifications, which later also guarantee a better comparison of the cards among themselves.
Technical data and picture gallery
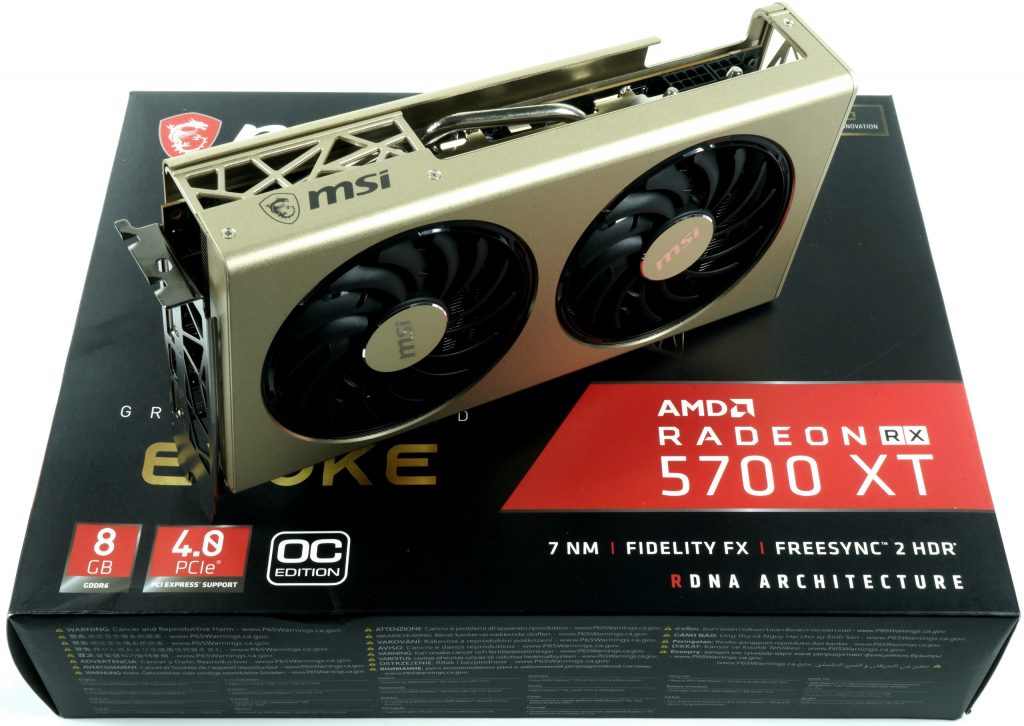
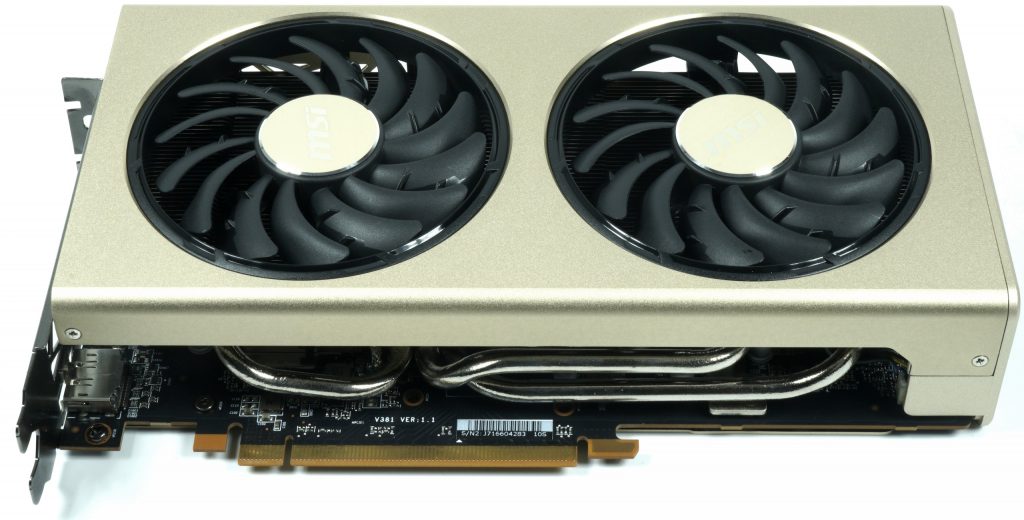
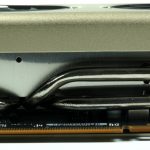
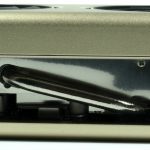
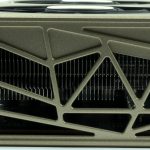
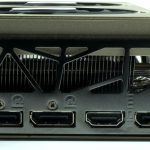
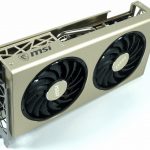
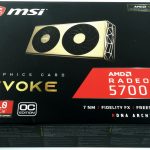
This time the design is visually very MSI-untypical, but that’s why we have the picture gallery:
Matching the promised overview of the most important features:
| Length (outer edge of slot bracket to end of card) | 23,5 cm |
| Installation height (upper edge of PCIe slot to upper side of card) | 12,0 cm |
| Front mounting depth (cooler body to underside of circuit board) | 4,5 cm |
| Rear mounting depth (board to outside of backplate) | 0,5 cm |
| Weight | 885 g |
| Shroud | Gold-Metallic ABS injection moulding No LED |
| Connectors | 3x DisplayPort 1.4 1x HDMI 2.0 |
| Special Features | none |
GPU-Z provides us with an initial overview of the other technical data:
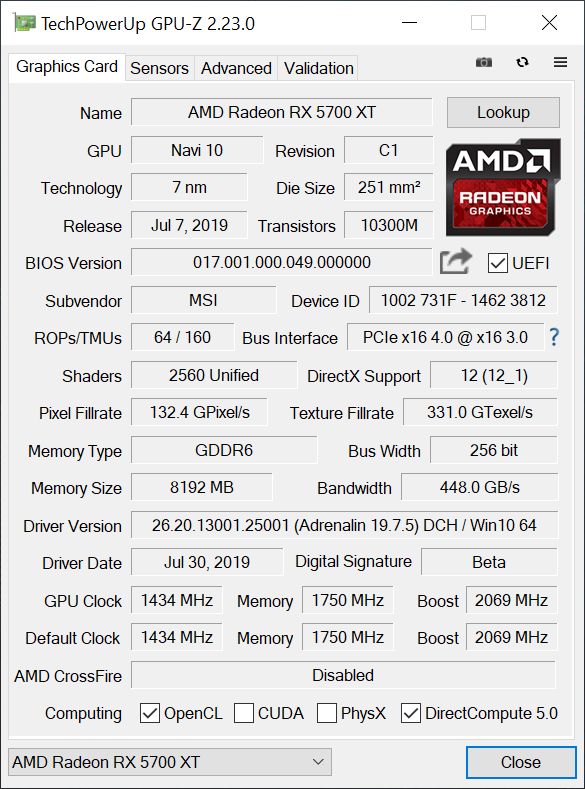
The table gives a nice overview of the remaining technical data of the current and older comparison models:
| Data | AMD Radeon RX 5700 XT |
MSI RX 5700 XT Evoke OC Edition |
AMD Radeon Vega 64 |
AMD Radeon RX 5700 |
AMD Radeon Vega 56 |
| Architecture (GPU) | Navi 10 | Navi 10 | Vega 10 | Navi 10 | Vega 10 |
| CUDA Cores / SP | 2560 | 2560 | 4096 | 2304 | 3584 |
| (40 CU) | (40 CU) | (64 CU) | (36 CU) | (56 CU) | |
| Texture Units |
160 | 160 | 256 | 144 | 224 |
| Texture-Fillrate (Gtexels/s) | 304,8 | 331 | 395,8 | 248,4 | 330 |
| Base Clocks (MHz) | 1605 | 1434 | 1274 | 1465 | 1156 |
| Boost Clocks (MHz) | 1755 (typical) 1905 (max.) |
2069 (max.) | 1546 | 1625 (typical) 1725 (max.) |
1471 |
| Memory | 8 GB GDDR6 14 Gbps |
8 GB GDDR6 14 Gbps |
8 GB HBM | 8 GB GDDR6 14 Gbps |
8 GB HBM |
| Bus Width (Bit) | 256 | 256 | 2048 | 256 | 2048 |
| Memory Bandwidth (GB/s) | 448 | 448 | 483,8 | 448 | 410 |
| ROPs | 64 | 64 | 64 | 64 | 64 |
| L2 Cache | 4 MB | 4 MB | 4 MB | 4 MB | 4 MB |
| TGP/TBP | 225 W | 250 W | 295 W | 185 W | 210 W |
| Mrd. Transistors |
10,3 | 10,3 | 12,5 | 10,3 | 12,5 |
| Die (mm²) | 251 | 251 | 495 | 251 | 486 |
| Node | 7 nm | 7 nm | 14 nm | 7 nm | 14 nm |
| Multi GPU | DX12/Vulkan | DX12/Vulkan | CF | DX12/Vulkan | CF |
Test system and measurement methods
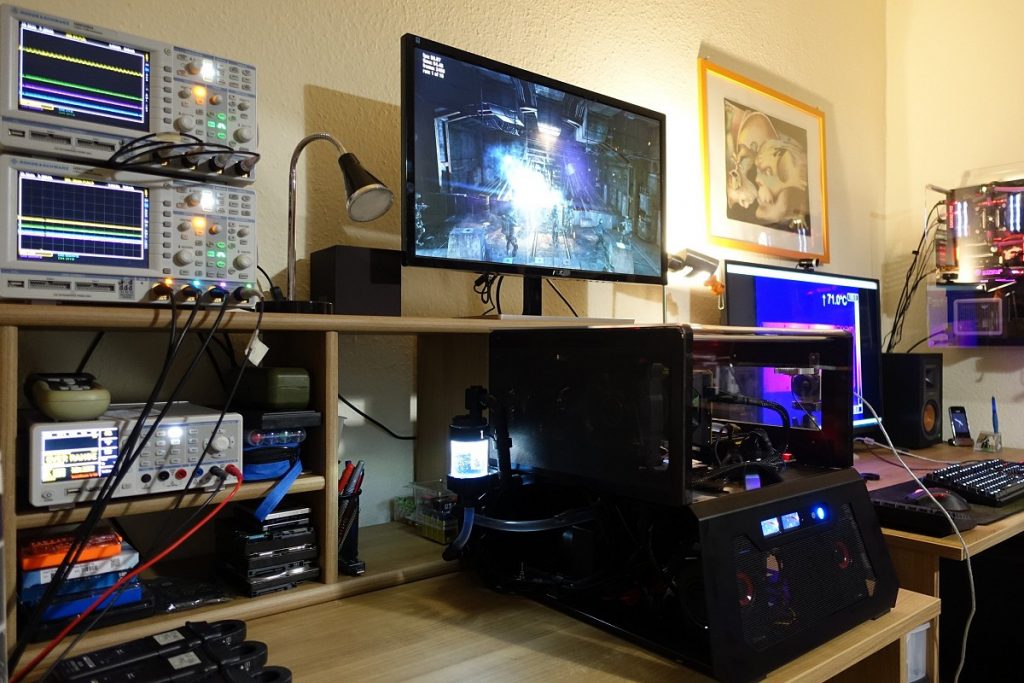
The test system and methodology are well known, but since I now test independently here in Germany, the test system has also been upgraded again without having to consider the former US colleagues.
The summary in tabular form offers interested readers a quick overview:
| Testsysteme und Messräume | |
|---|---|
| System: |
Intel Core i9-9900 KF MSI MEG Z390 ACE 2x 8GB KFA2 HoF DDR4 4000 1x 1 TByte Patriot Viper (NVMe System SSD) 1x Seagate FastSSD Portable USB-C Seasonic Prime 1200 Watts, Titanium |
| Cooling: |
Alphacool Eisblock XPX 5x Be Quiet! Silent Wings 3 PWM (Closed Case Simulation) Thermal Grizzly Kryonaut (Therma Grease) |
| Benchtable: |
Lian Li PC-T70 (modified with shroud) Modi: Open Benchtable, Closed Case |
| Monitor: | Eizo EV3237-BK |
| Power Consumption: |
Non-contact direct current measurement on the PCIe-Slot (Riser-Card) Non-contact direct current measurement at the external PCIe power connectors Direct voltage measurement at the respective connectors and at the power supply unit 2x Rohde & Schwarz HMO 3054, 500 MHz Multichannel Oscilloscope 4x Rohde & Schwarz HZO50, Current Clamps 4x Rohde & Schwarz HZ355, Probes 1x Rohde & Schwarz HMC 8012, Digitalmultimeter |
| Infrared / Thermal Imager: |
1x Optris PI640, 2x Xi400 Thermal Imager Pix Connect Software |
| Noise / Acoustics: |
NTI Audio M2211 (calibrated) Steinberg UR12 Creative X7, Smaart v.7 Semi-anechoic measuring room, 3,5 x 1,8 x 2,2 m (LxDxH) Axial measurements, perpendicular, measuring distance 50 cm Noise emission in dBA (slow) as RTA measurement Frequency spectrum as graphic |
| Operation System: |
Windows 10 Pro (1903, all Updates) |
- 1 - Introduction, Technical Data, Test Setup
- 2 - Tear Down: PCB and Cooler
- 3 - Benchmarks 1920 x 1080 Pixels
- 4 - Benchmarks 2560 x 1440 Pixels
- 5 - Benchmarks 3840 x 2160 Pixels
- 6 - Power Consumption in Detail
- 7 - Temperatures, Clock Rate, Infrared
- 8 - Cooling Fans, Noise Emission
- 9 - Conclusion and Bottom Line


