


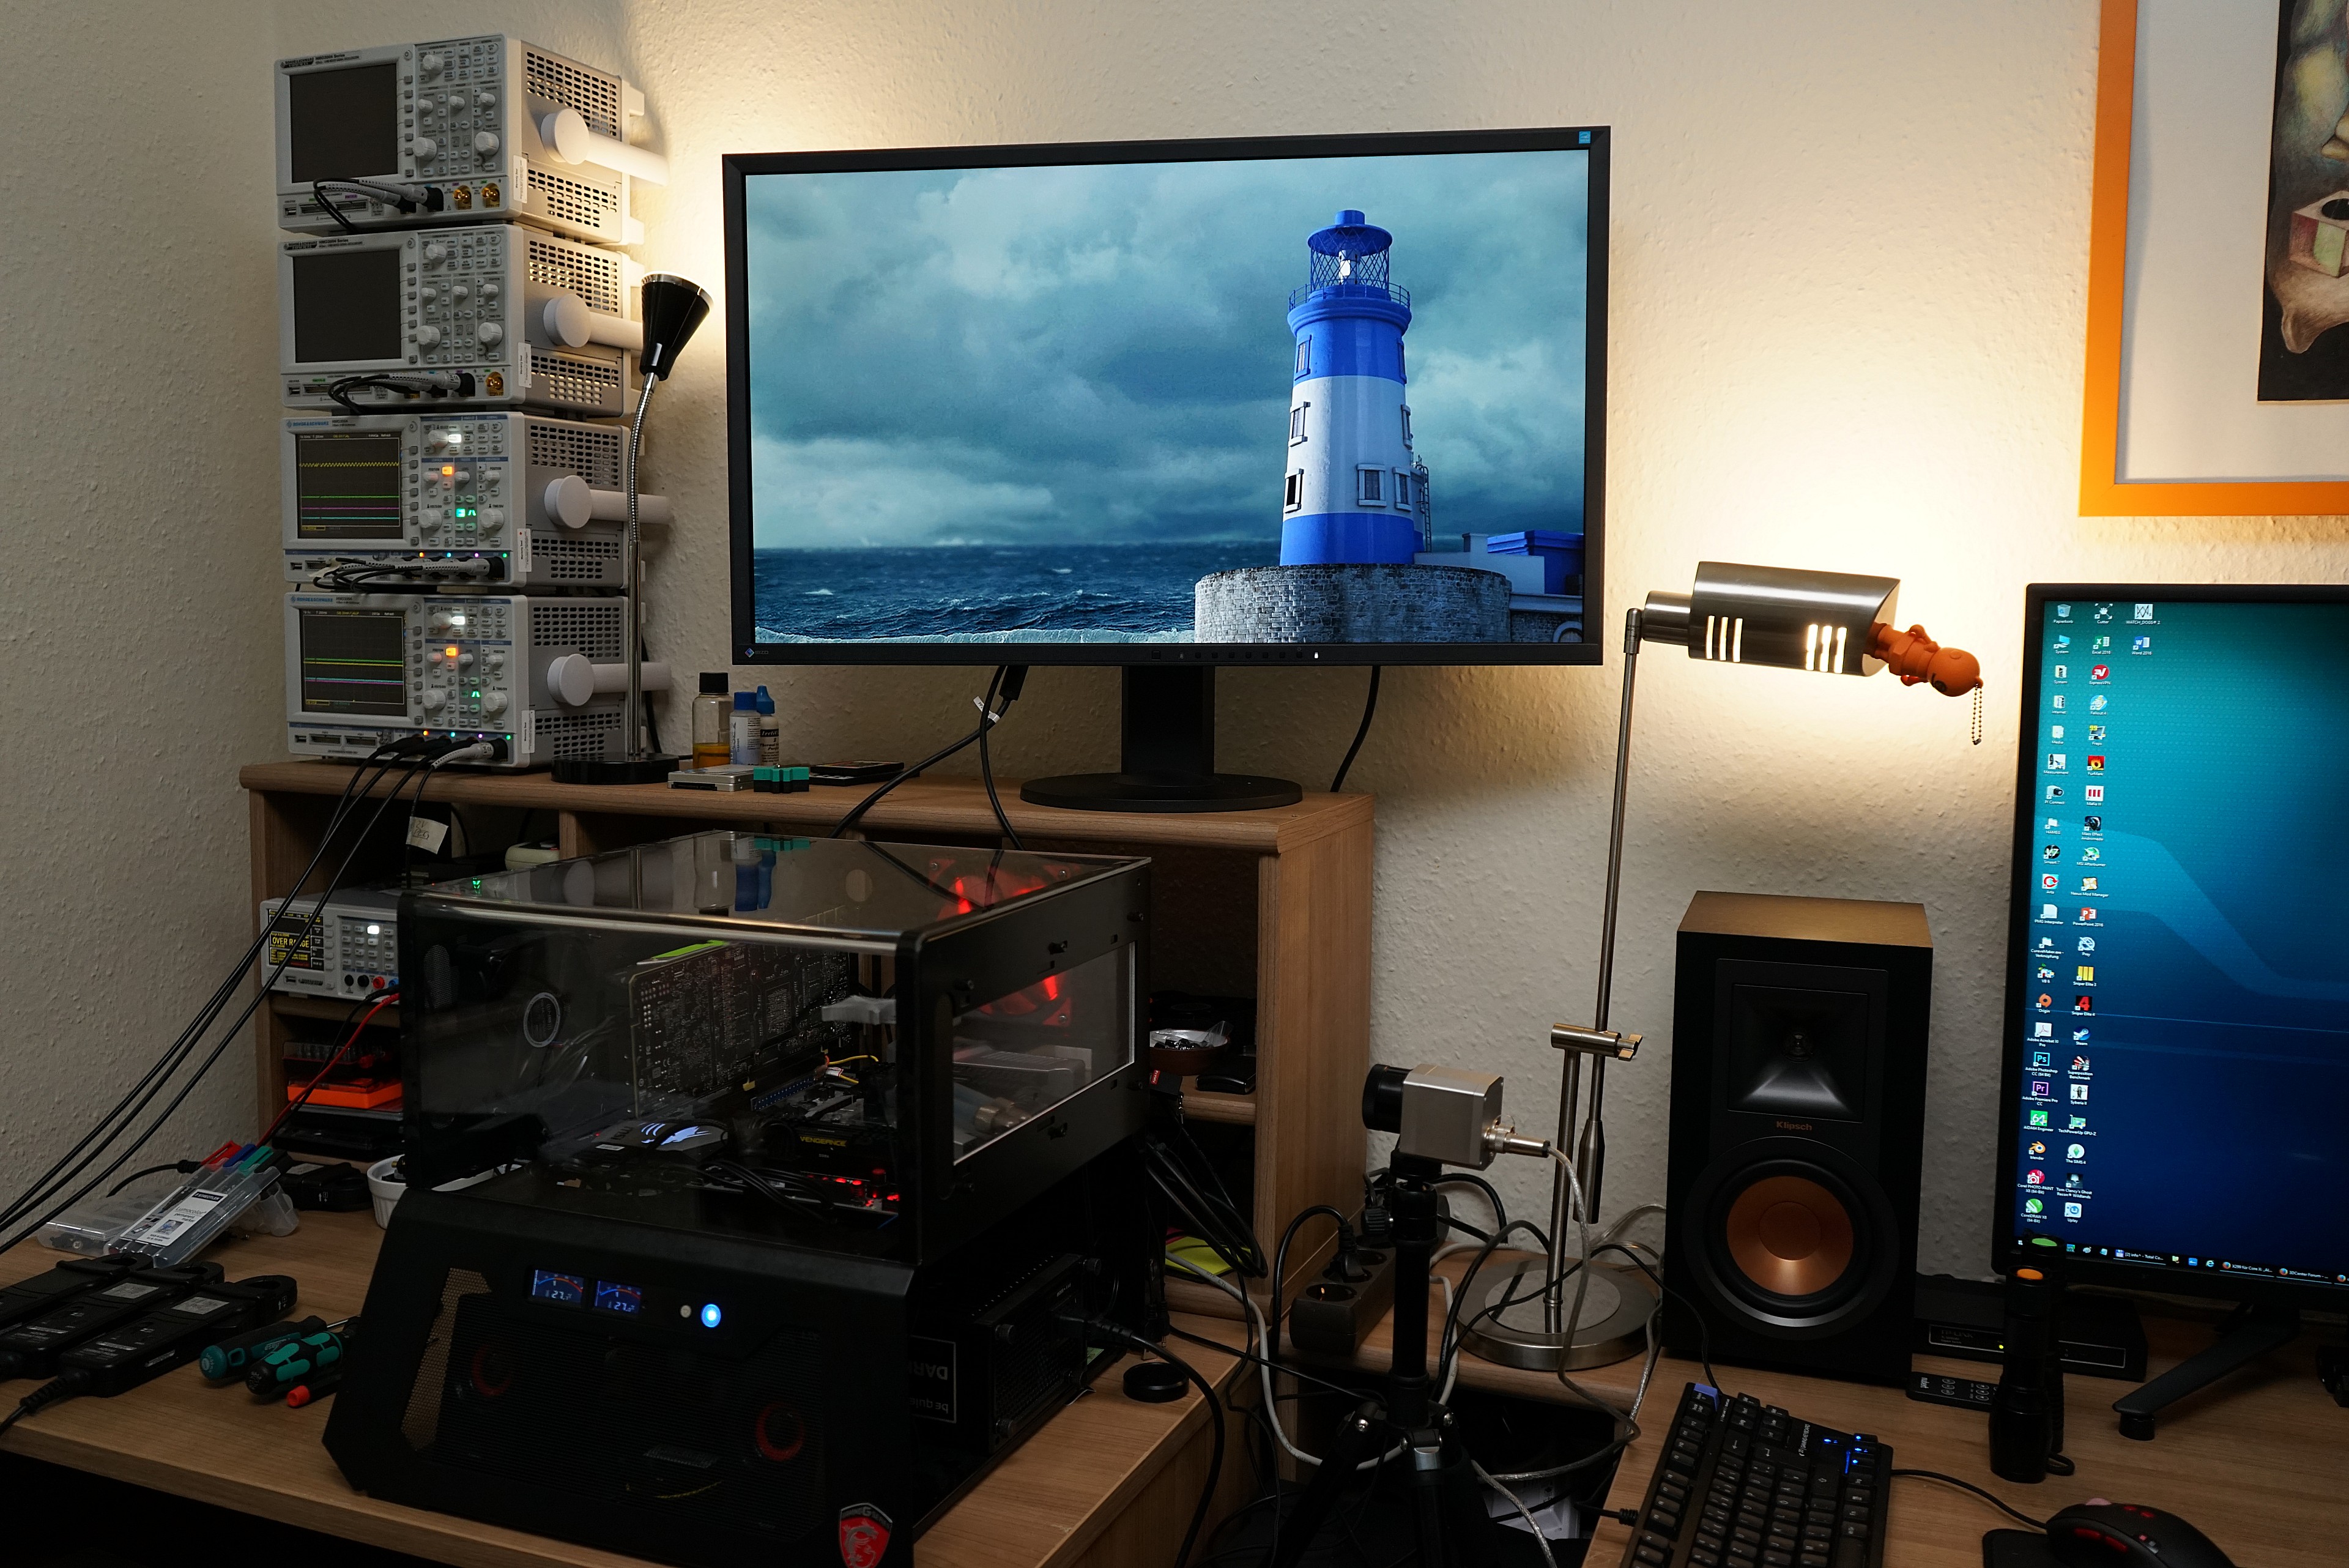
We took the conversion of the side and parts of the laboratory as an opportunity to improve the measurements of the power consumption of graphics cards once again. We have been relying on the measurement technology of Rohde & Schwarz for years and have not had to change anything about the actual hardware, only in the software area and the evaluation. We also show screenshots of our own interpreter software for the first time and explain them to our readers today.
We described the actual measurements in the basic article "How We Test Graphics Cards on our US/UK sister page) a year ago. This hasn't changed much, only the network has been expanded again and the memory oscillographers are now attached to a much more performant switch and we also use a separate PC only for collecting and reading the logs. However, these synchronized data, the coexistence of which can and must be checked at a unique timestamp, must also be evaluated and processed for further processing and presentation.
The interpreter software
Of course, it goes without saying that we measure with the oscillographers with the maximum possible sampling rate and accordingly also interpret the bandwidth in such a way that it is at most half as large (Nyquist theorem) in order to provide the best representation of the required signal content. Reach. In general, however, this factor is much higher in practice, because with two measuring points per wave you are only theoretically on the safe side. In addition, there are filters with steep edges to suppress aliasing products.
This alone helps to keep measurement errors as low as possible. Because what is already badly lacking or "unsharp" is actually no longer usable. However, it is not possible to completely rule out sporadical errors or interferences.
The new software, which has always been self-created, is now being used for this purpose, which is now available in the fifth revision. To further limit these remaining inaccuracies, the software now uses a kind of counter-test and intelligent filters in the interpreter, which respond to atypical values and known problems and further filter them. In addition, countless measured values must also be evaluated, broken down to usable data sets and also reduced or interpolated that it allows you to use graphical outputs such as Excel charts.
Let's say we're using a record with 60,000 entries in the existing time line as an example. Excel can't process it alone, let alone display it. So we'll put it down by a factor of 100 to get to 600. This, in turn, creates an unintended blurring that would effectively iron out short (but actually existing) spikes or break-ins, as smoothed averages arise. Our special Excel filter for graphical output now pretends to submerge the 60,000 values graphically so that the maximum deflections of the curve per screen pixel remain visible and overwrite other, lower values. Of course, this is no longer a question, is it?
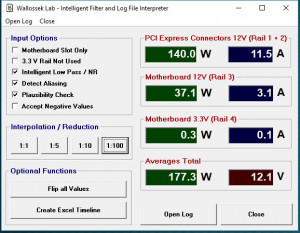
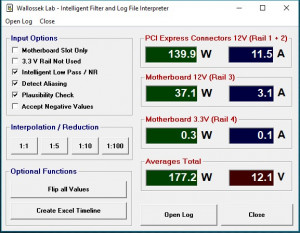
Because we have put quite a lot of effort into the formulas and the outliers remain rather manageable in relation to the total amount of data, the whole thing is not even so inaccurate, because if we look at the preview values of both variants in the screenshots, then in contrast to the original (left picture) we see a whole 0.1 watt difference on the external PCI Express connection in the version reduced to 1:100 (right image) in contrast to the original (left picture)." The other values are the same. For the bar charts, by the way, we take the original measurement data for safety.
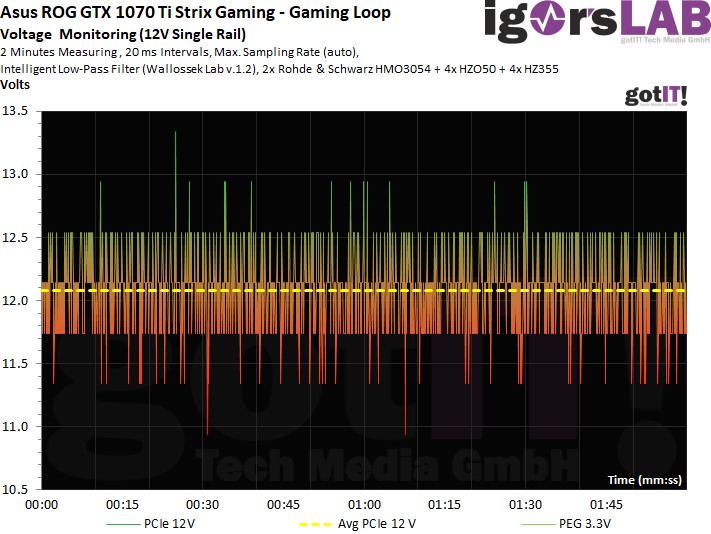
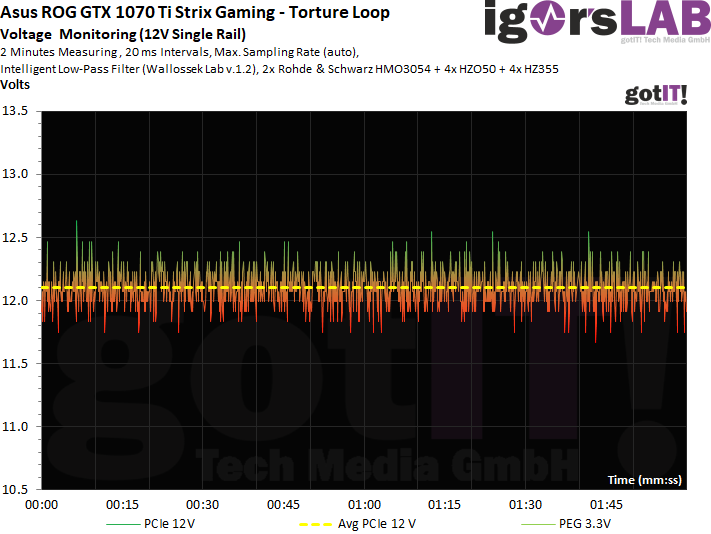
Graphic output of voltage values
What has been added is the evaluation of the voltage values on the 12-volt rail on the external PCI Express connections. These curves are also very interesting and should be discussed briefly. After all, the power consumption in watts is the product of current AND voltage. We see a slightly over-voltage power supply with an average value of 12.08V in the gaming loop. However, if we take a closer look at the curve, the value without deflections would be approx. 12.15V (nominal value without load influences). This is not dramatic, but it is interesting.
The bottom line is that the voltage breaks down more often than it exceeds the assumed nominal value. But then a little clearer. But we must not forget that we are dealing here with a switching power supply, whose capacitors should smooth so well on the secondary side that the voltage remains as constant as possible. However, this ideal case is almost never possible, so you can be happy if you stay within the specified upper and lower limits (as in our graphic). So what you see beautifully are the interactions between the graphics card and the power supply.
By the way, the short voltage peaks disappear almost completely when you apply a more constant load in the stress test. They are also significantly lower if the graphics card has better filtering in the input area of its power supply. Currently, many cards already use coils as a throttle, but less often in combination with capacitors also as simple low-pass filters. Nevertheless, one can give a warning, because nothing will break. Only older and above all cheap power supplies can then switch off unexpectedly (OVP or EIA, depending on), if they have a proper protection circuit at all.
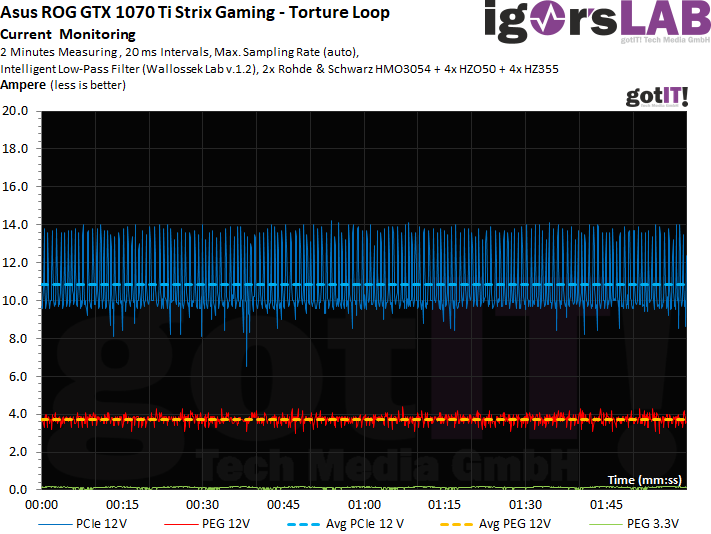
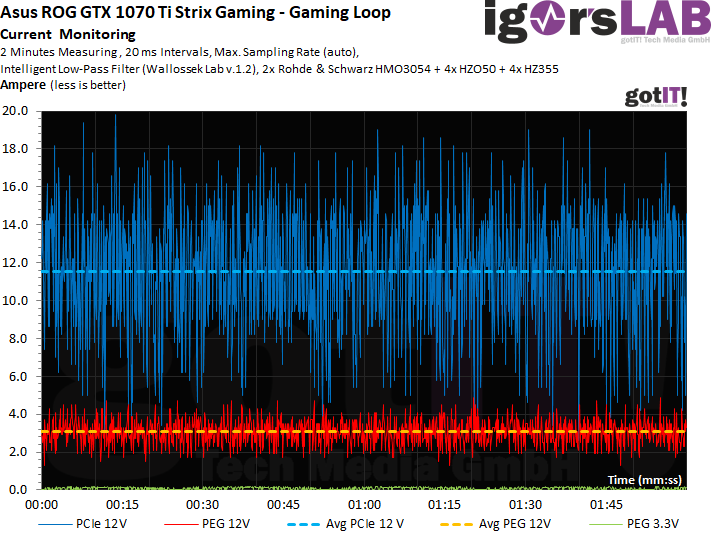
Evaluation of flowing currents and compliance with standards
Here, too, we see a certain analogy, because at more constant loads, the measurement curves of the flowing currents also look extremely different. In gaming, the arbitrator of the firmware regulates the voltage values at the GPU quite frantically up and down, depending on the sensor values, load and load prediction, which is then recognizable by the also strongly changing currents.
If the load becomes more constant, the control frenzy also falls again and we see significantly lower extremes based on the curves:
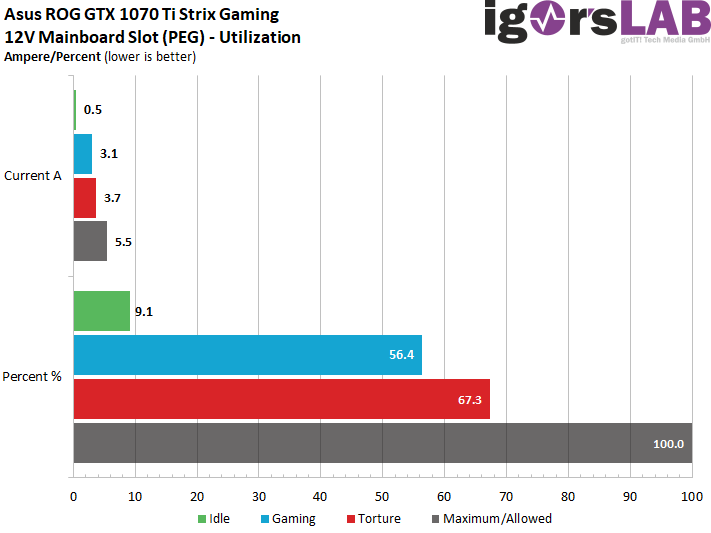
And again the history with the PCI SIG and the applicable standards. With a maximum of 3.7 amps (torture) on the motherboard slot, the card measured here is still far below what the PCI SIG sets with a maximum of 5.5 amps (66 watts) for the 12 volt rail on the motherboard slot. By the way, the 75 watts that are often colported are nonsense, because the PCI SIG only dictates the current. The 75 watts would then result from the mentioned 5.5A maximum value and the maximum possible voltage as a product according to the ATX standard.
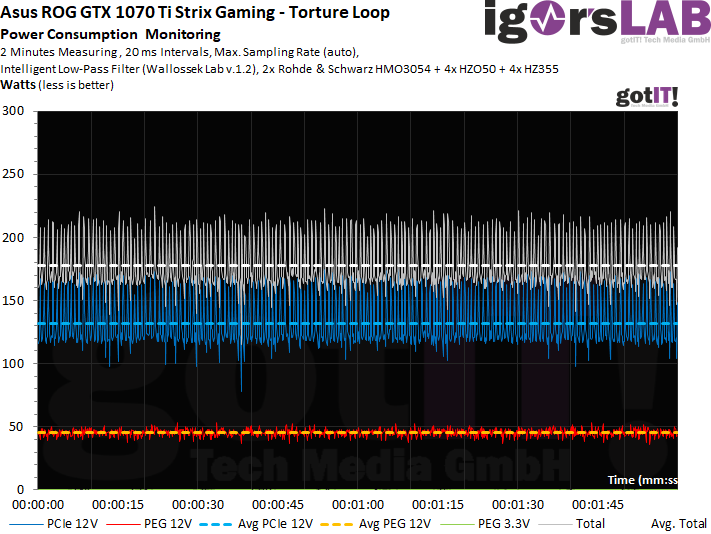
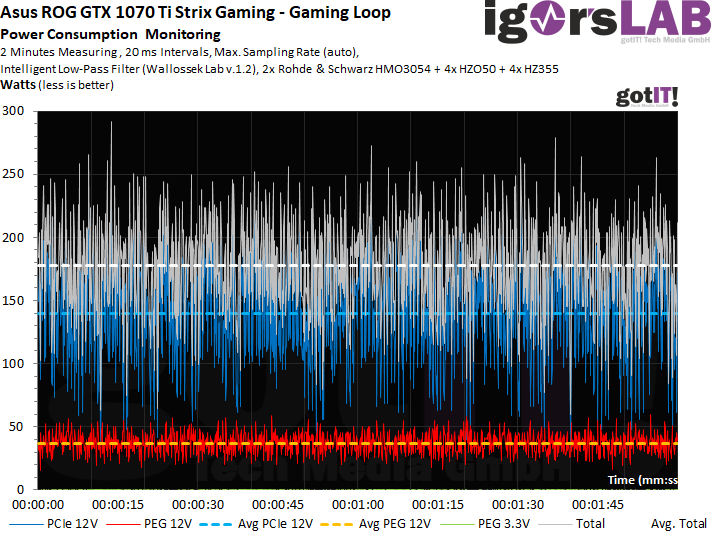
And now: the power consumption as a graphic
We have been able to significantly improve the detail of the graphics with the new curve calculation (reduction). For the power supply calculation, however, only the mean values (dashed thick lines) are important, the rest irons the secondary side loosely away. Short-term peaks are always followed by similar slumps, so that the total is a very accurate mean, which one should orientate oneself on one self. However, the tips also remind us again and again not to save too much on the power supply. For then the greed may take revenge sooner than one might like.
In the stress test with the more constant loads, we see the increase in detail even more clearly and the curves follow those of the current flow quite congruently.
Summary
New project, new technology! Of course we take this article with us to the new page, promised. And we will be able to evaluate graphics cards even more accurately in the future. The latter, in particular, can never be clear enough.


Kommentieren