


The fact that graphics cards cause considerable load peaks I could already prove impressively 6 years ago for the first time – including all the resulting problems and measures for the power suppliers. In the meantime, a lot has been done, of course also in the interest of the end customers. And yet, there are always situations where a power supply unit that is actually nominally sufficiently dimensioned unexpectedly switches off. But to blame this solely on the graphics cards seemed a bit too short-sighted to me. Incidentally, I’m deliberately focusing on the 12-volt rails today, because that’s the only place the problem will occur.
Together with the power supply provider be quiet! i then thought about why power supplies shut down whose supervisor chips were actually configured so that the intervals of the graphics card load peaks could even be up to 20 ms long without triggering a shutdown (OCP, OPP), which should actually hardly occur in practice. So there had to be something else that was sporadic and difficult to reproduce! I therefore used the oscillographs to simultaneously measure the GPU, CPU and motherboard with high resolution down to the microsecond range. What I could find there opened my eyes quite quickly.
In fact the GPU and the CPU produce both extreme spikes! This is no longer measurable by simple tools and is also very much dependent on the coincidence that two such extreme load peaks occur at the same time or only offset by a few milliseconds. These two values do not even have to represent the absolute extreme in the individual value, but in the sum they can be quite “deadly” in exactly this tripping interval of such a power supply monitoring.
In this case, computers from a system integrator shut down even with extremely strong power supplies, for example when running an Intel Core i9-10900K with a GeForce RTX 3090 on an Asus motherboard and overclocked. Cross-checks at be quiet! and in my lab were negative, even with other connected components, but we used other motherboards. After a long try & error I came back to the CPU via the detour of the motherboard swap. Because in the case of the blackouts, only a certain Asus board was used, which also overpowered the CPU. But are the spikes of the CPUs still excessive on other motherboards? This is exactly what we are talking about today, because the power supply shutdowns are the consequences of a causal chain, coupled with a good portion of coincidence or bad luck.
However, since many readers have asked me to also take a look at the much more relevant mid-range, today we’re testing “only” with an MSI RTX 3070 Gaming X Trio, an MSI RX 6800 XT Gaming X Trio, and an AMD Radeon RX 6800. Together with a Ryzen 9 5900X, we would have certainly covered the maximum of what is seen as the current mid-range or upper-class. We already had the high-end, especially since it does not depend on 50 euros more or less for the PSU.
Power supplies in the practical test
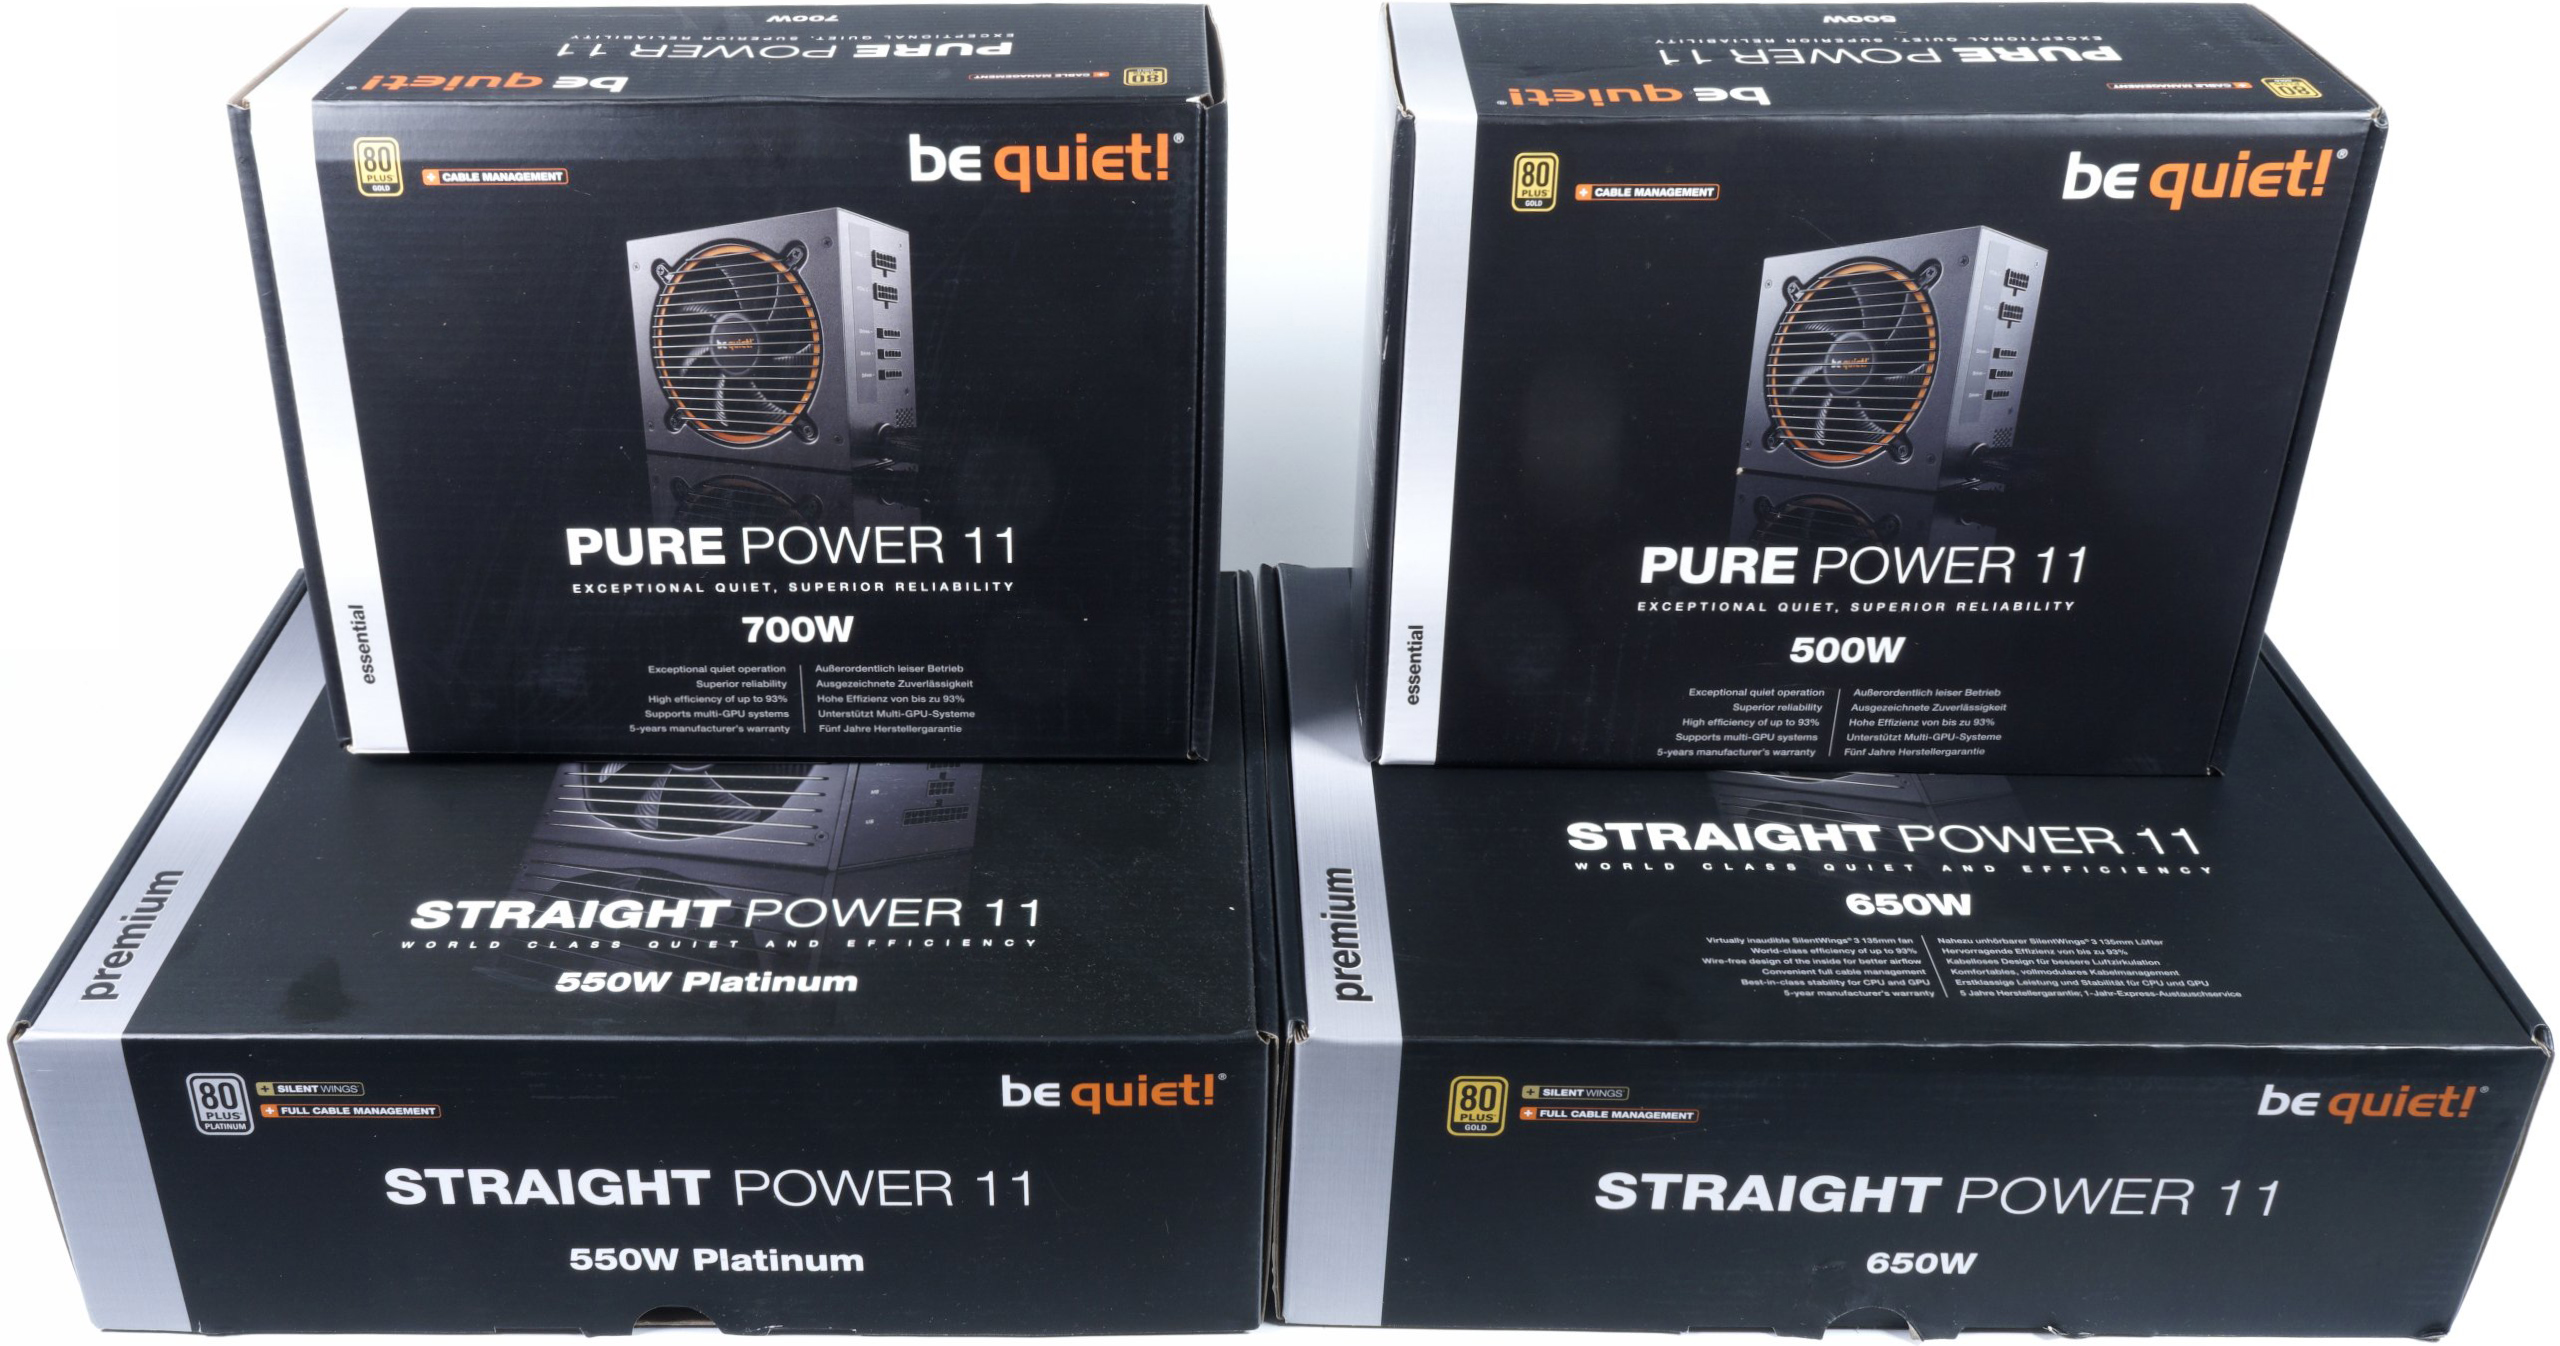
I had already reviewed the series of be quiet! Straight Power 11 Gold and Platinum from 650 watts up to 1000 watts in review with the GeForce RTX 3090 and an Intel Core i9-10900K, so I’m rounding it all out today with the simpler models and a popular AMD CPU down low, using a Straight Power 11 550 watt Platinum, a Straight Power 650 watt Gold, a Pure Power 500 watt Gold, and a Pure Power 700 watt Gold. The power supplies were sent by be quiet! for testing without any preconditions and there was also no obligation to publish anything.
Load peaks of the graphics cards
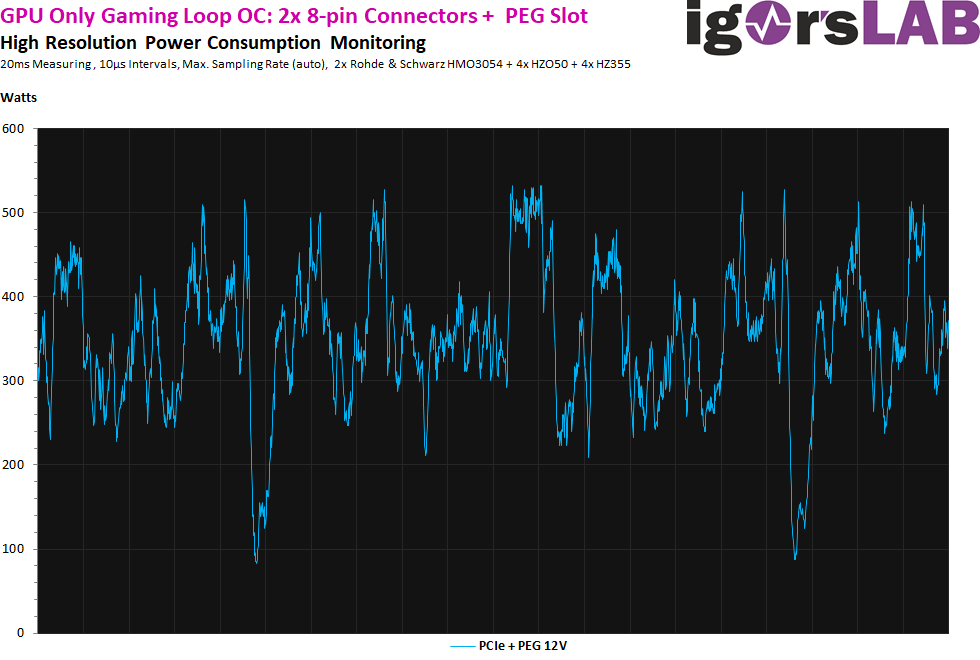
How the whole thing then affects the entire load, I will now explain to you step by step. I arbitrarily and randomly grabbed a 20-ms snippet from a measurement series with the overclocked RX 6800 XT and will first show and explain all progressions individually. We need that then for a better understanding of the next pages. We already know the graphics cards, so I’ll shorten this a bit, because the arbitrator switches the loads up and down many thousands of times per second (sensor values, power estimation), resulting in this picture:
Load peaks of the CPU
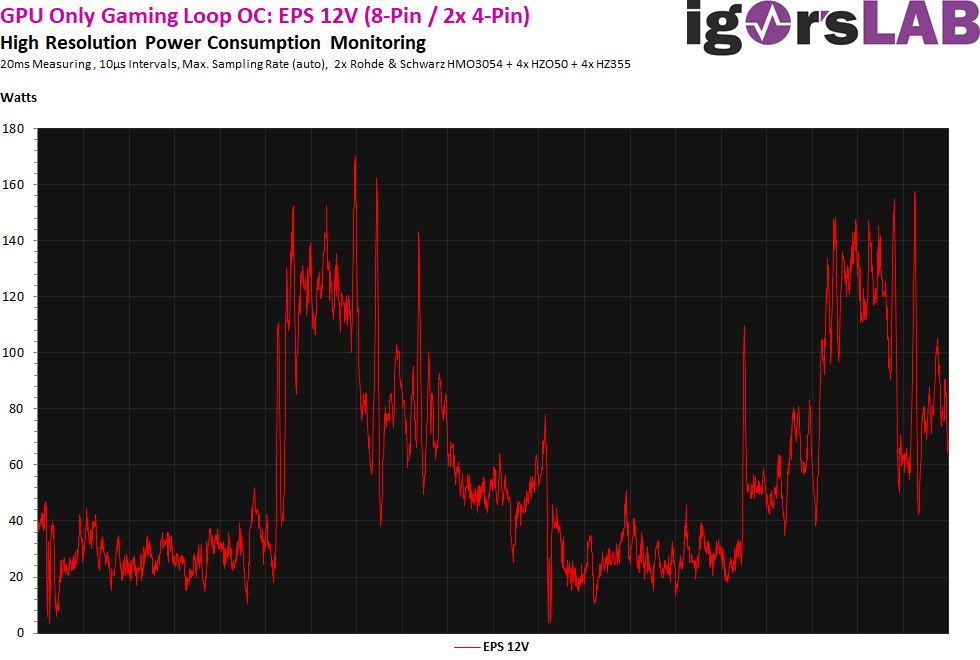
Now it’s getting exciting! I measure absolutely at the same time also the CPU at the EPS and in fact in such a way, like also the graphics cards: Primarily at the feeders before the respective voltage converters, thus directly at the EPS (here 1x 8-Pin + 2x 4-Pin). Over the entire benchmark run of 2 minutes, the average power consumption of the CPU is 60.4 watts. If I measure with 1 s intervals, this is between 59.2 and 61.3 watts. However, if I reduce these intervals further, I see load peaks up to 205 watts in gaming! I’ll save the stress test for later. Nevertheless, the value measured here is also on an insane level and amounts to more than three times the average value!
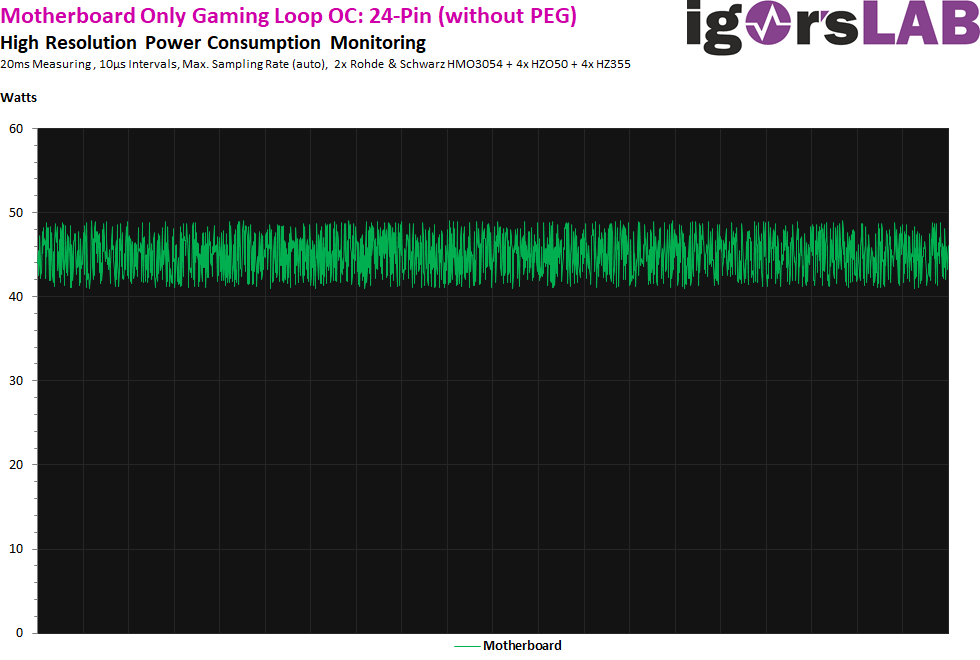
Power consumption of the motherboard including connected components
Here it is somewhat up to the topology of the board, which components are really supplied from the 12 volt rail and which are supplied via 3.3 or 5 volts. The power consumption of the motherboard, 2 SSDs, an external mechanical hard disk, 2x 16 GB RAM and RGB stuff is between approx. 41 and 49 watts in total, so it stays relatively constant. Since the 12 volt rail usually only consumes 25 (and less) watts and the measurement effort of the whole rails with the oscilloscope is too high, I made all measurements on the following pages without the motherboard. These maximum 25 watts, which remain quite constant, can be added individually in the measurement. However, they are not really important and decisive.
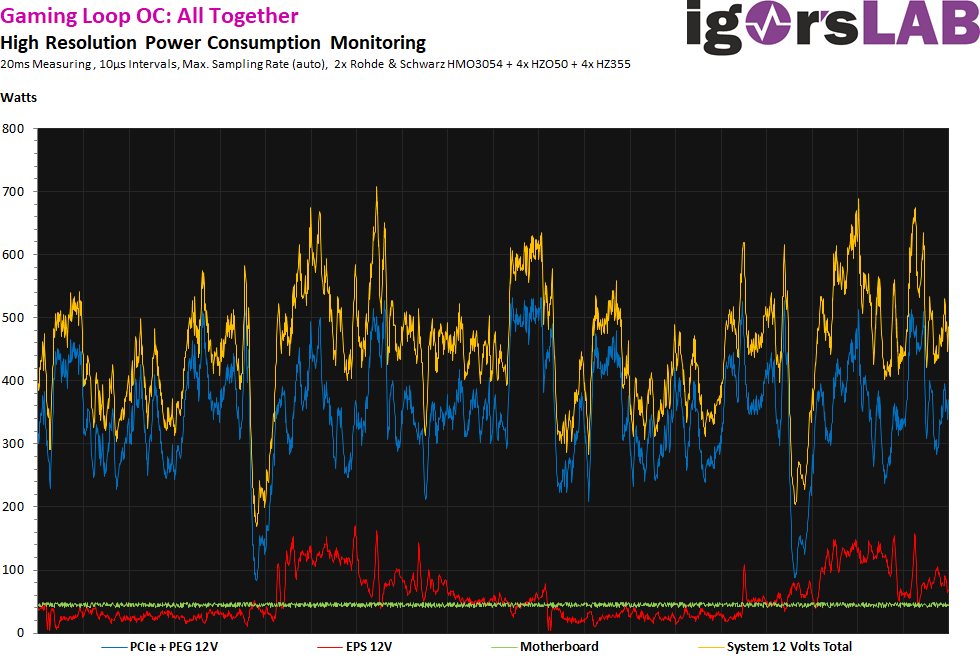
The sum of all spikes: load changes and spikes at the power supply unit
And now comes the very thick end! I kept the colors of the curves, only the yellow curve is new. This curve now shows the sum of all partial loads on the 12-volt rails. You can also see that not all CPU spikes follow the GPU load curve and vice versa. The chance of two extremes meeting at the same time is not too great, but it is real and it exists.
Benchmarks, test system and evaluation software
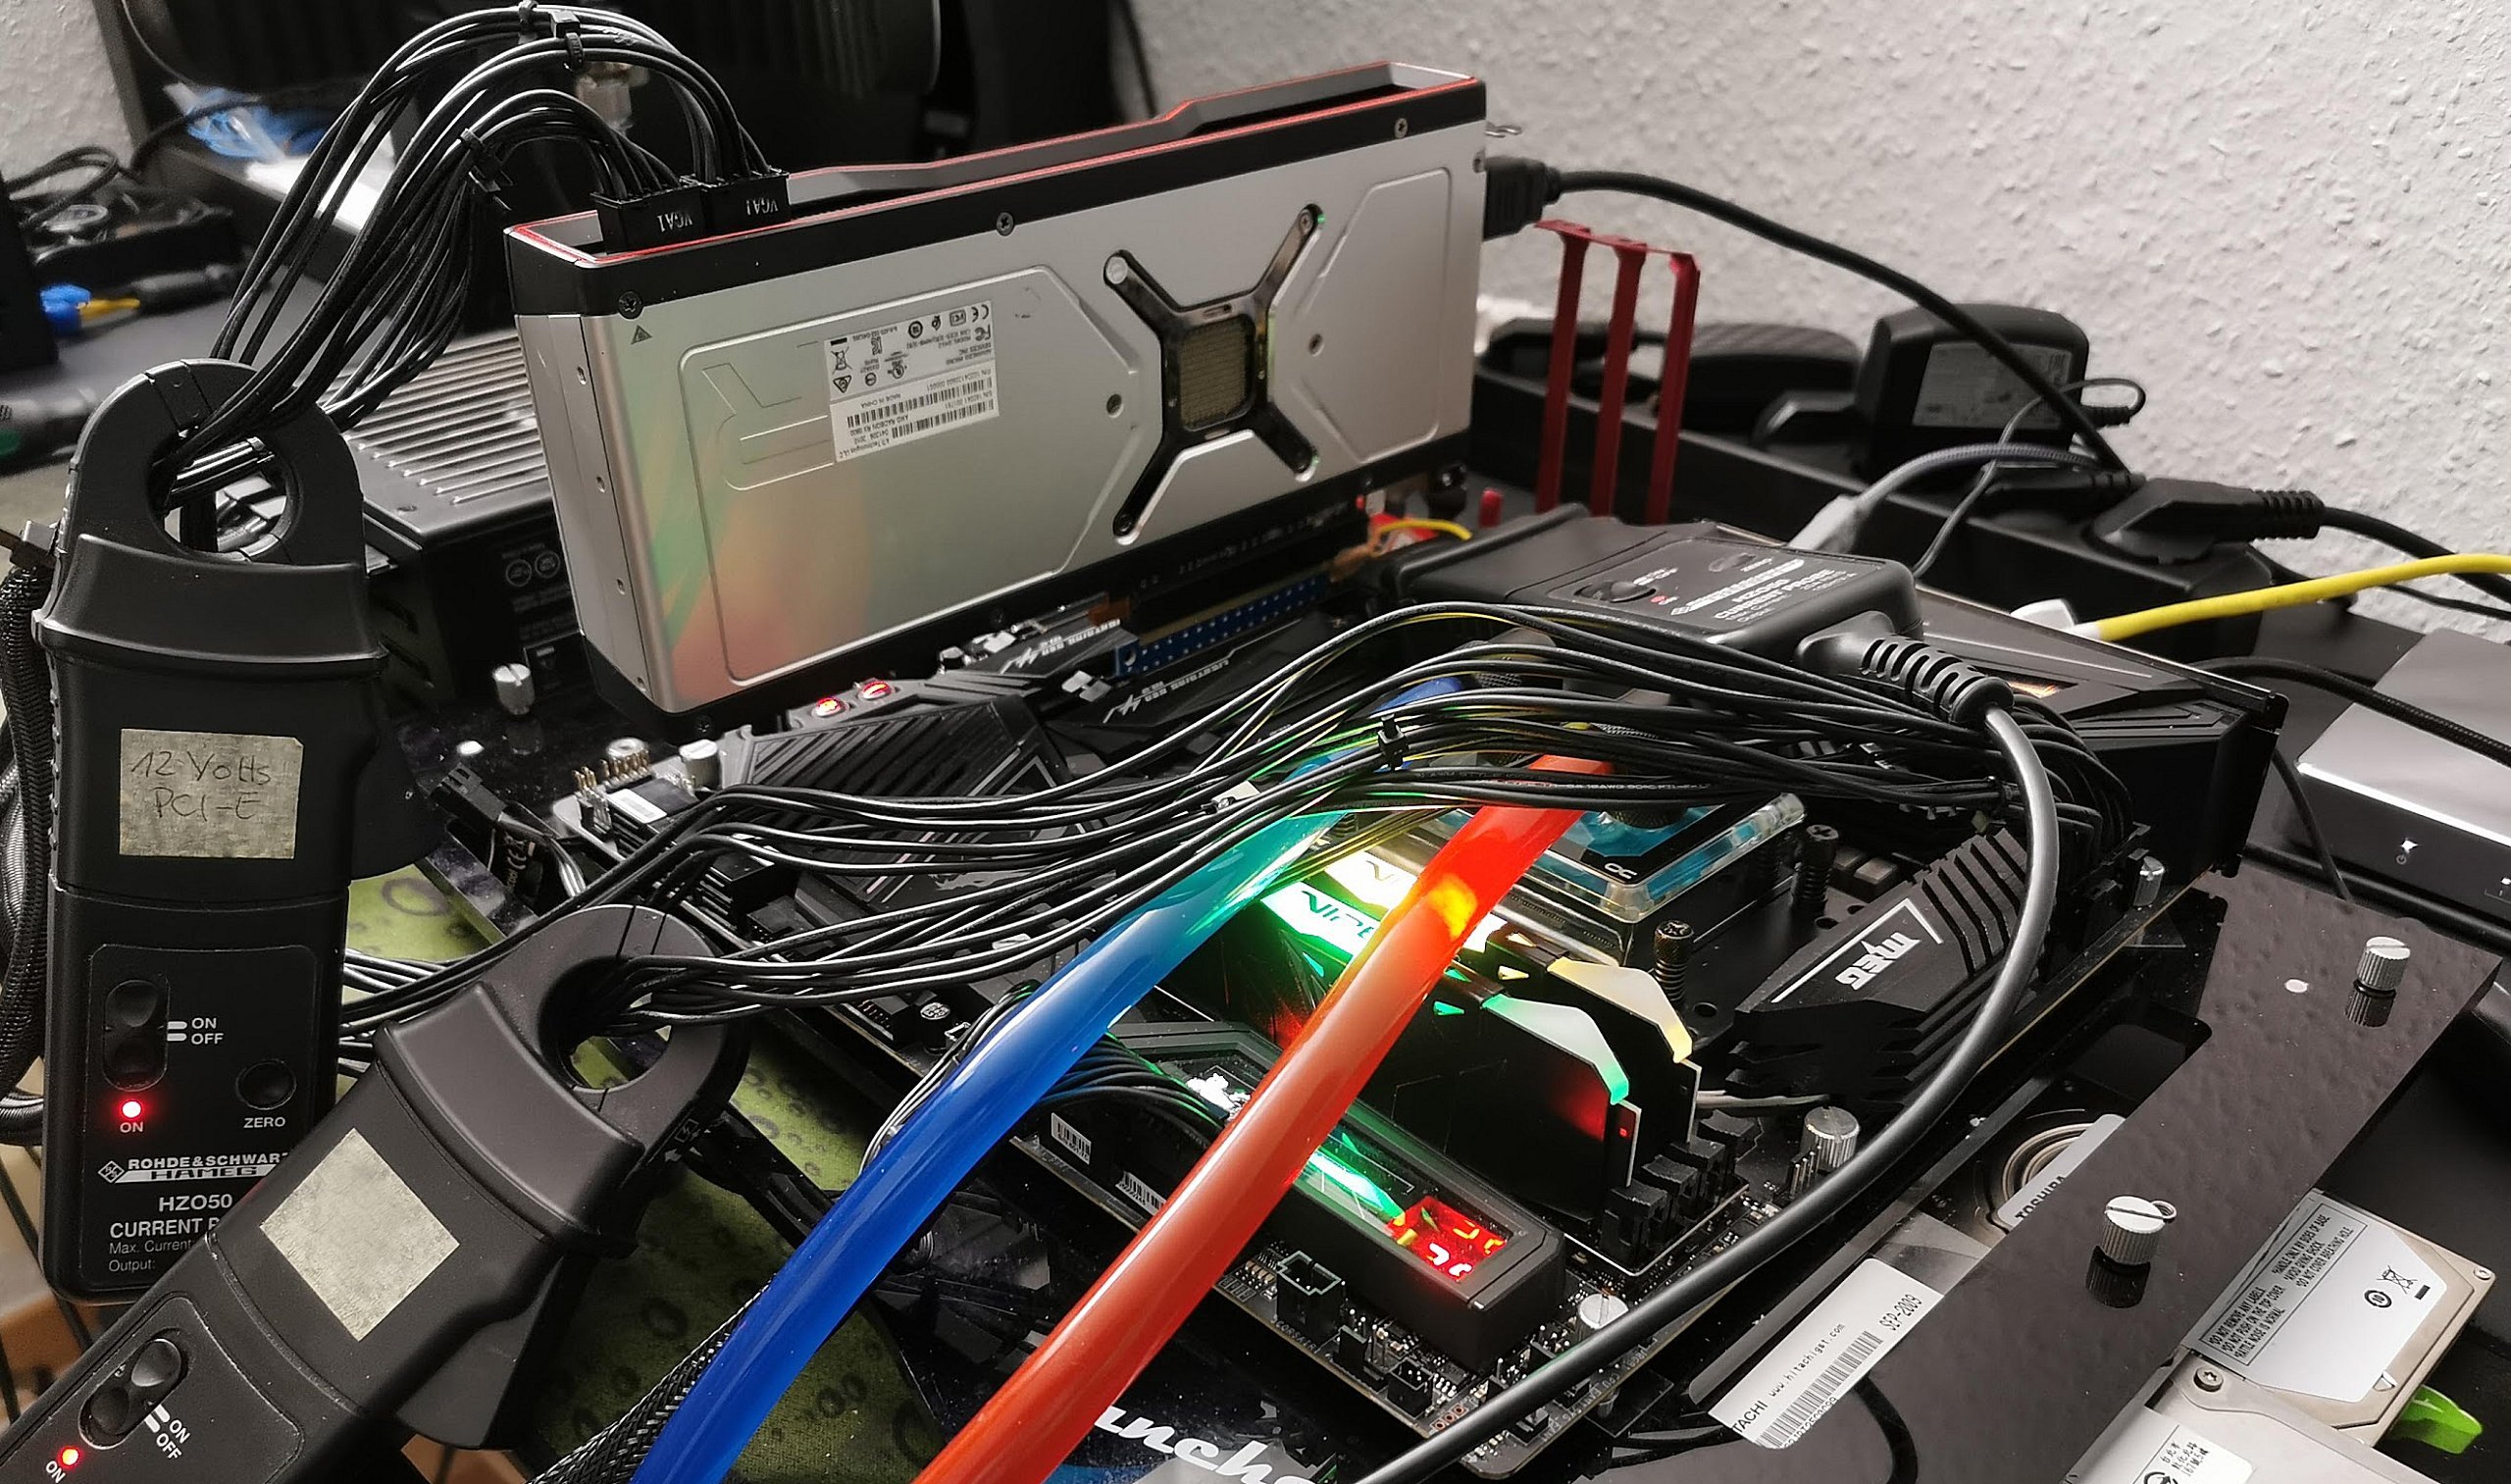
The measurement of the detailed power consumption and other, more in-depth things is carried out here in the laboratory on a redundant test system, identical in every detail, on two tracks using high-resolution oscillograph technology. Even though I usually use the Witcher 3 for the GPU load tests, today it’s Shadow of the Tomb Raider, because the integrated benchmark contains very different scenes with quite vicious load changes. This makes this loop the ideal test object for our investigation today. As always, the stress test is performed by the combination of Furmark and Prime95 (with AVX).
The overclocking of the CPU is done via PBO (180 Watt TDP limit, + 500 MHz boost), that of the graphics cards with MorePowerTool and Wattman (Radeon) or MSI Afterburner (GeForce). In order to reproduce relevant spike combinations repeatedly, it sometimes took many runs. That’s why this article had been delayed a bit. The high-resolution measurements are carried out by means of two fast storage oscillographs…
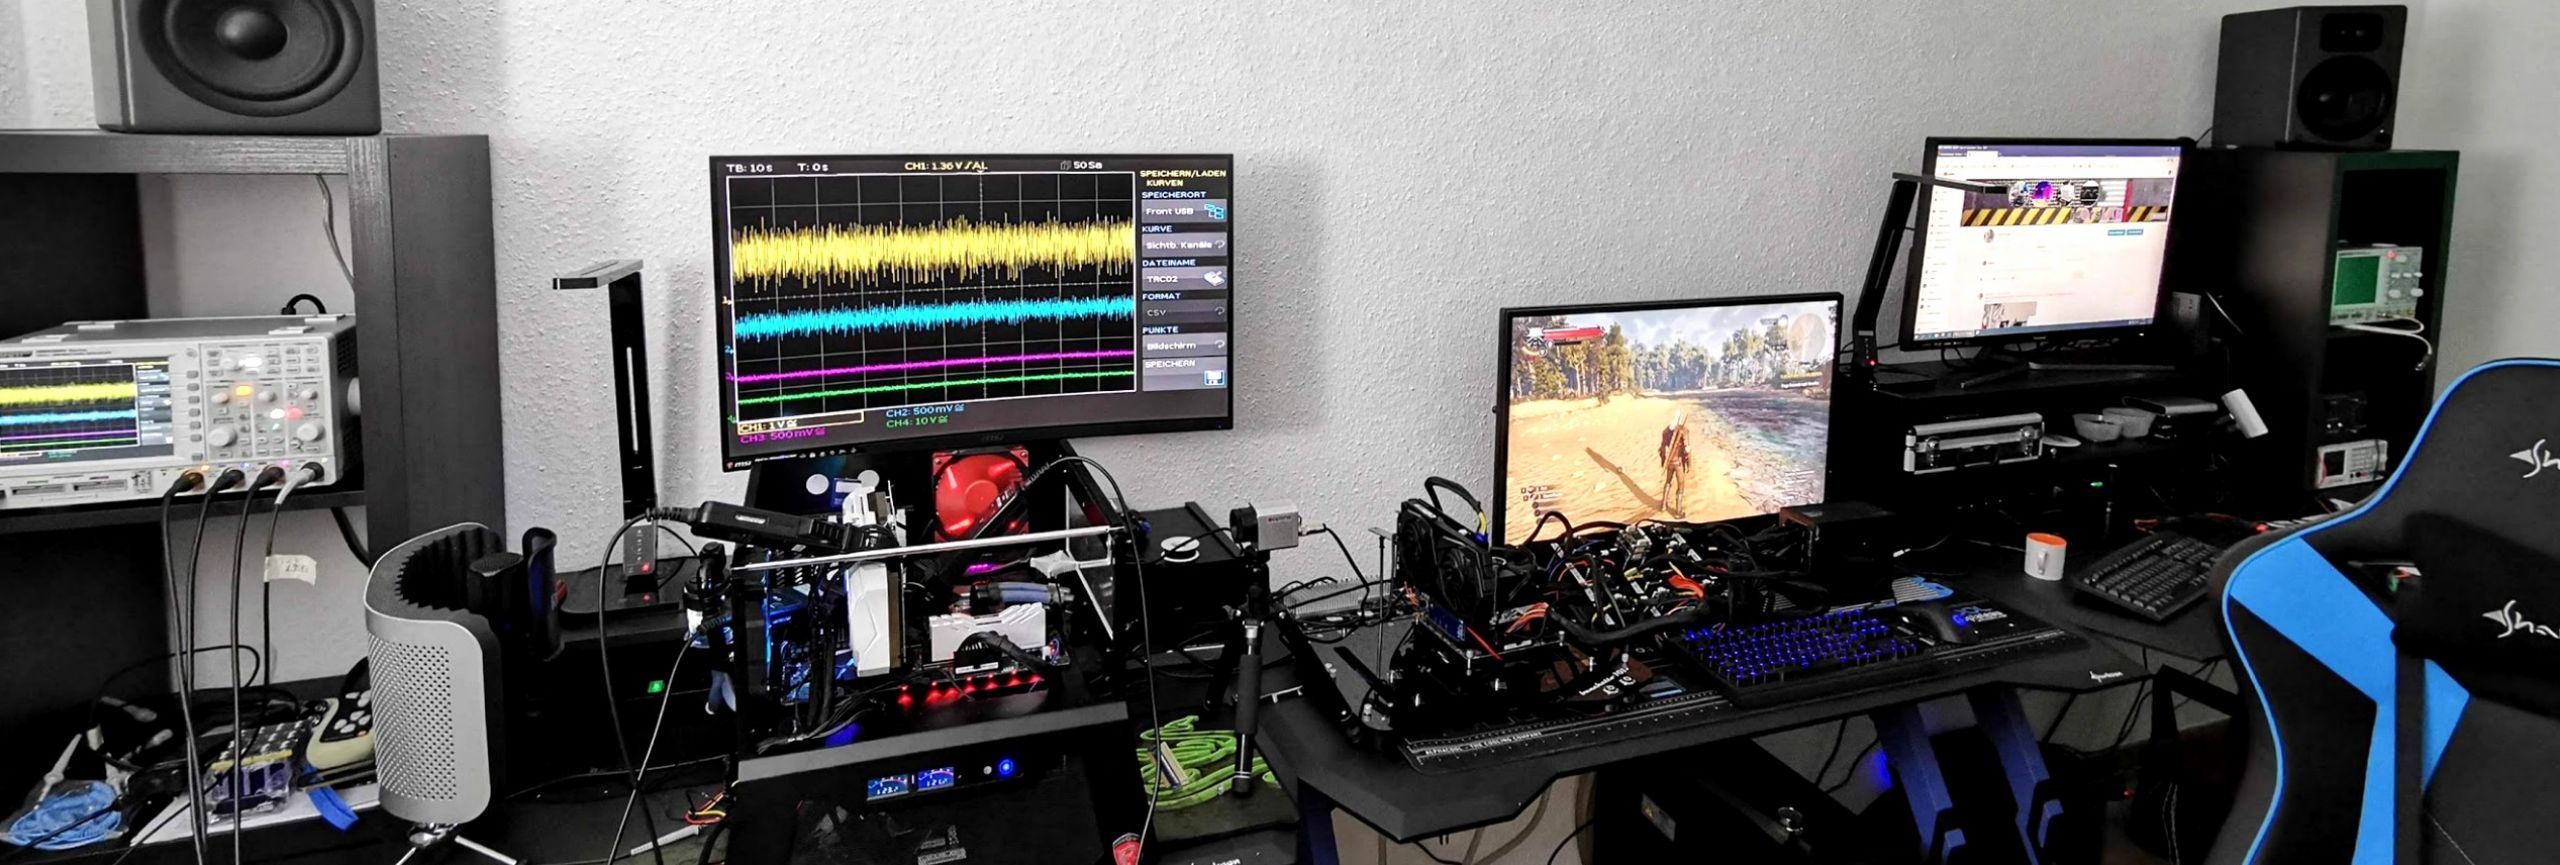
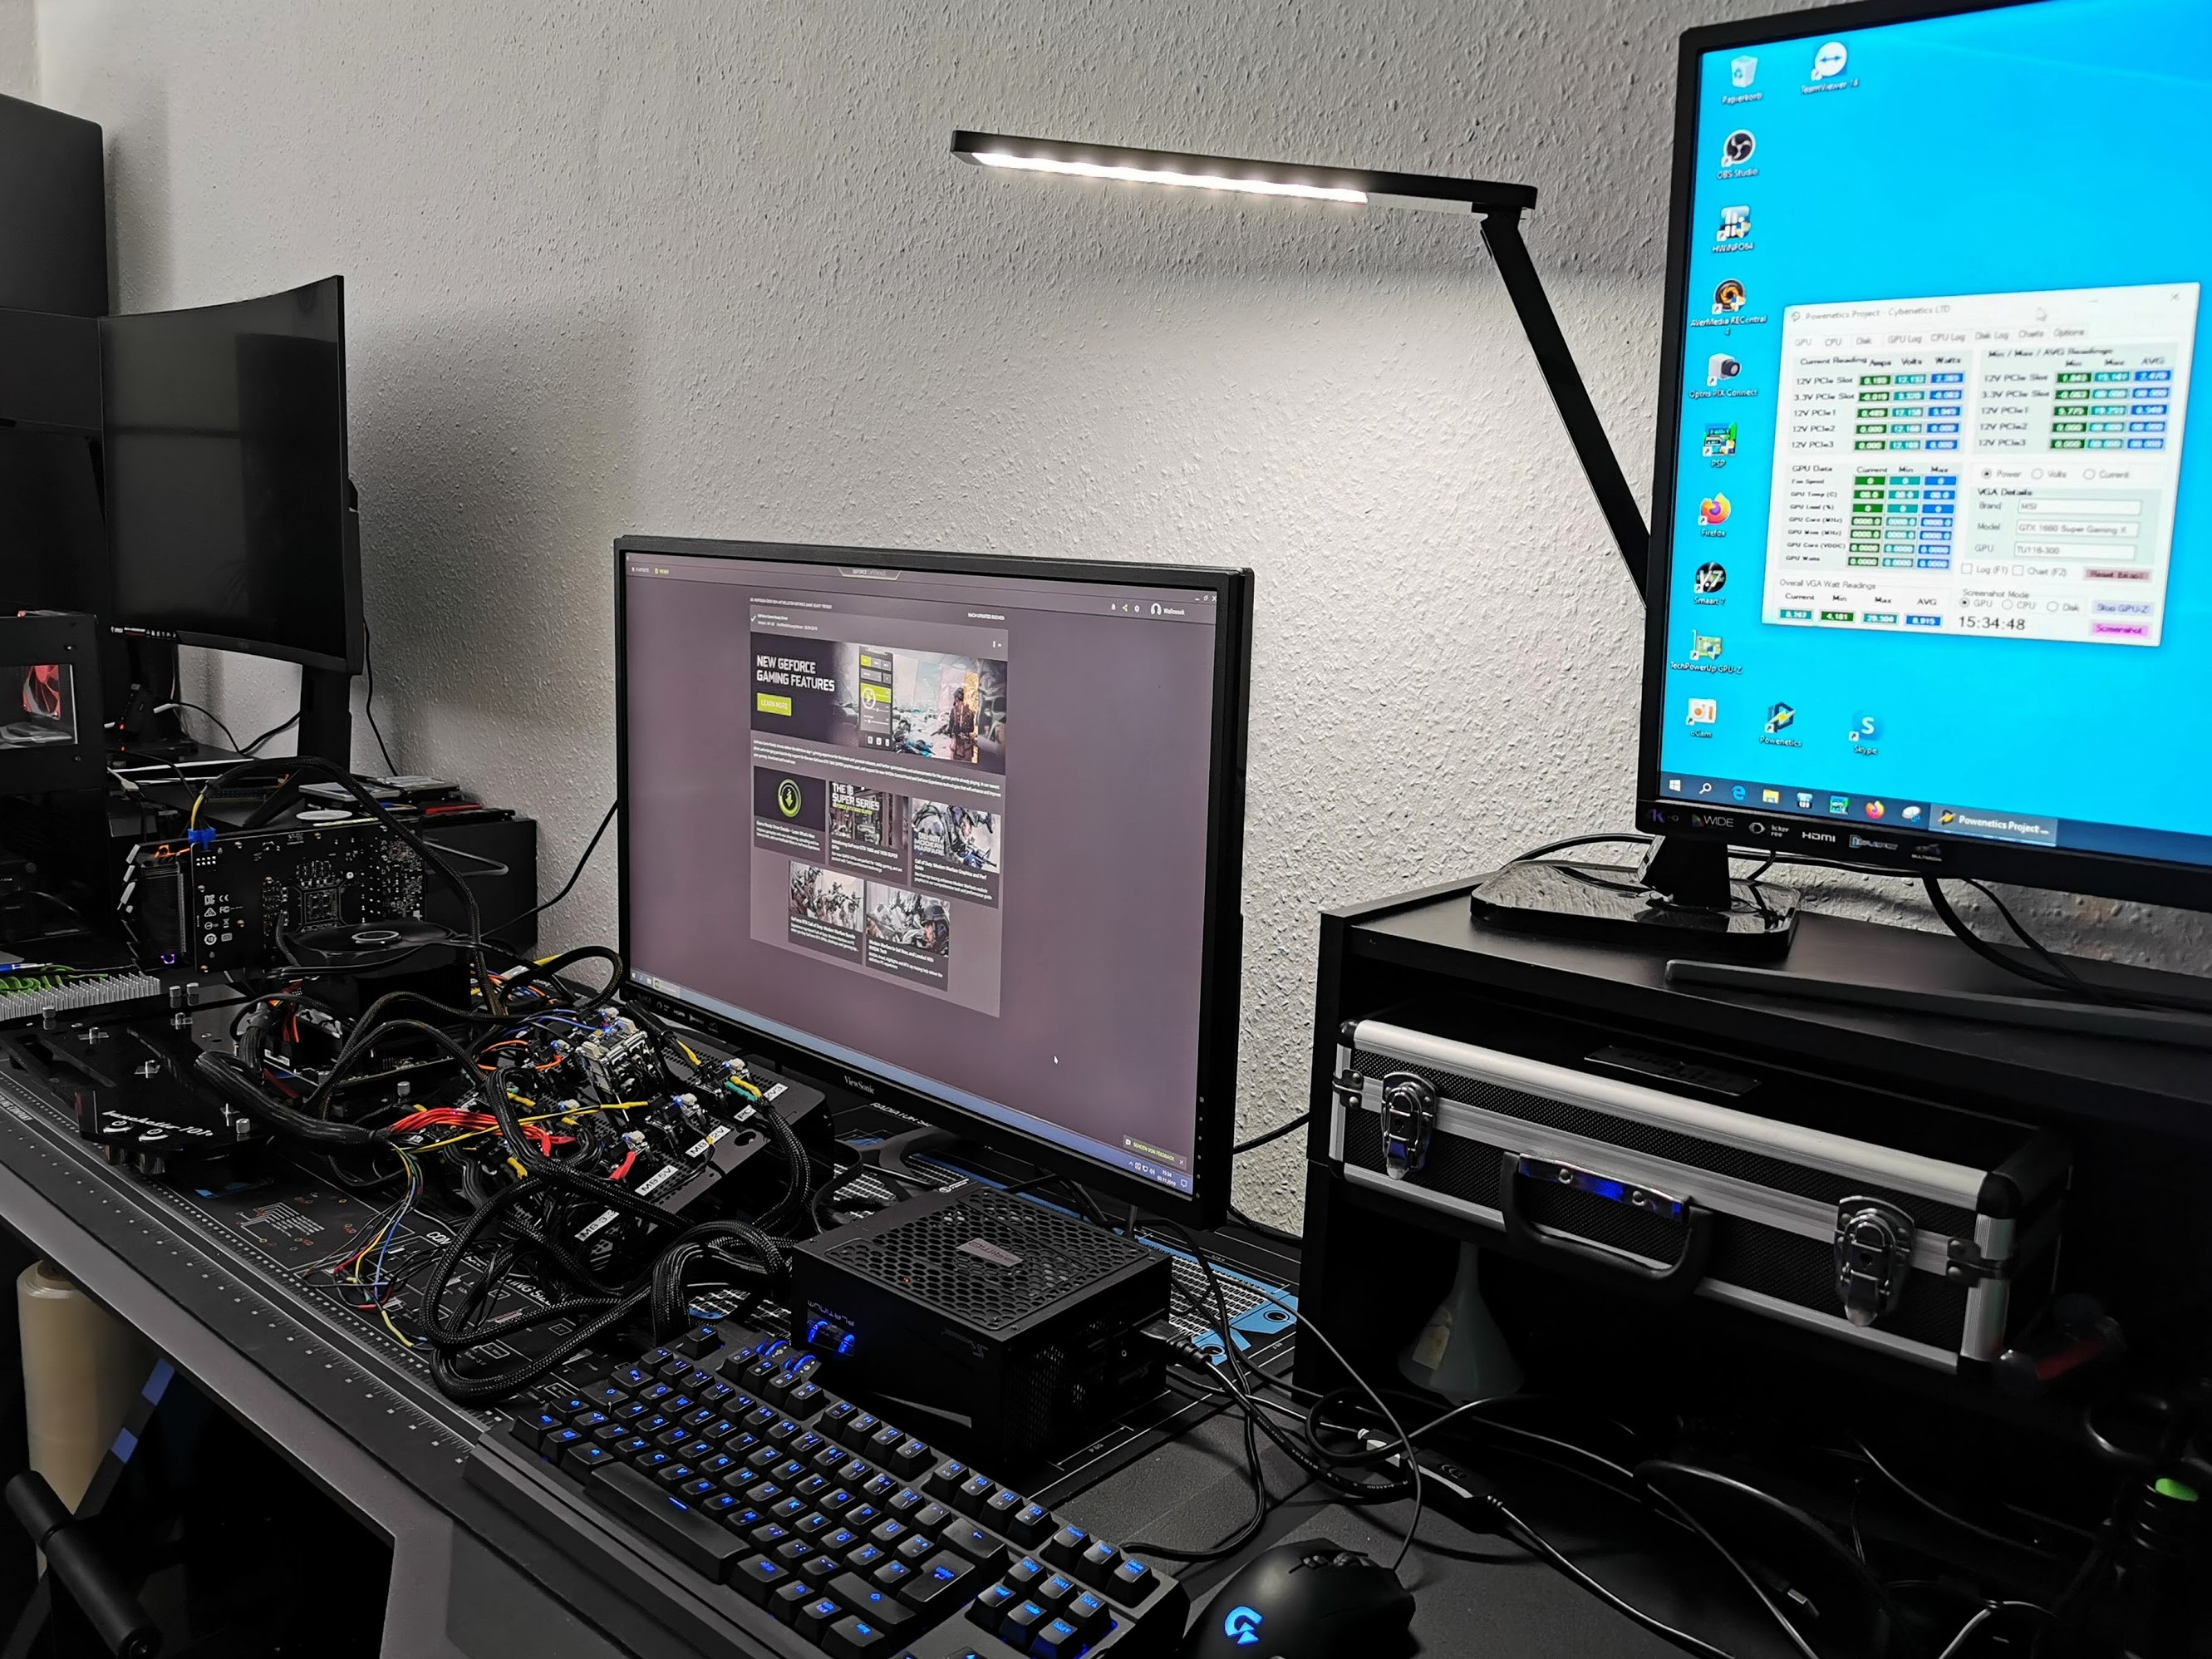
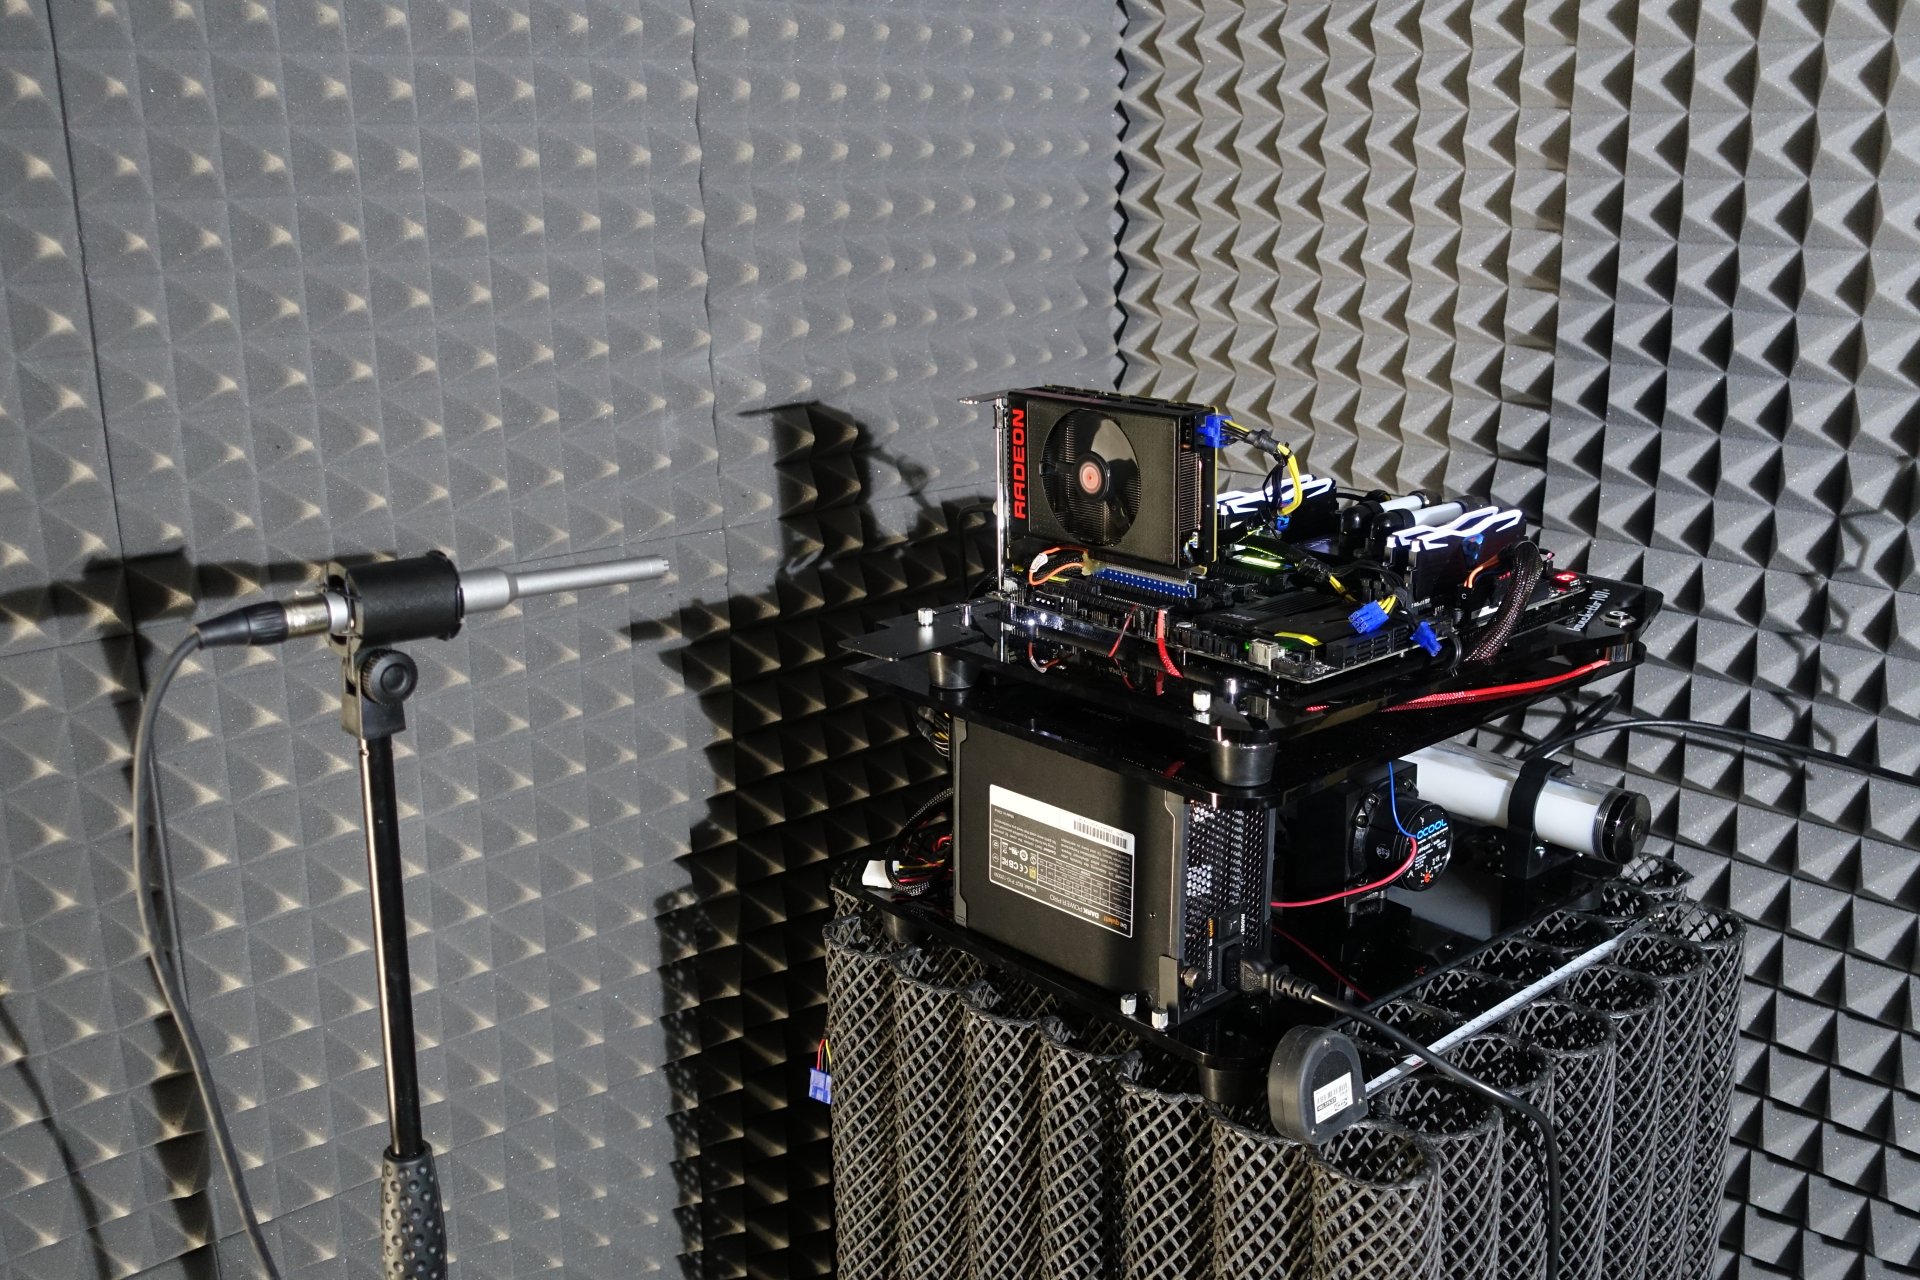
…and the rest to the self-created MCU-based measurement setup for motherboards and graphics cards (pictures below), where at the end in the air-conditioned room also the thermographic infrared images are created with a high-resolution industrial camera. The audio measurements are done outside in my Chamber (room within a room). But for once, we don’t need either of those today.

I have also summarized the individual components of the test system in a table:
| Test System and Equipment |
|
|---|---|
| Hardware: |
AMD Ryzen 9 5900X Stock/OC MSI MEG X570 Godlike 2x 16 GB Corsair DDR4 4000 Vengeance RGB Pro / Patriot Viper 1x 2 TByte Aorus (NVMe System SSD, PCIe Gen. 4) 1x 2 TB Corsair MP400 (Data) 1x Seagate FastSSD Portable USB-C be quiet! Straight Power 550/650 Watt, Pure Power 500 Watt |
| Cooling: |
Alphacool Ice Block XPX Pr o Alphacool Ice Wolf (modified ) Alphacool Subzero |
| Case: |
Microcool Banchetto 101 |
| Monitor: | BenQ PD3220U |
| Power Consumption: |
Oscilloscope-based system: Non-contact direct current measurement on PCIe slot (riser card) Non-contact direct current measurement at the external PCIe power supply Di rect voltage measurement at the respective connectors and at the power supply unit 2x R ohde & Schwarz HMO 3054, 500 MHz multichannel oscilloscope with memory function 4x Rohde & Schwarz HZO50, current clamp adapter (1 mA to 30 A, 100 KHz, DC) 4x Rohde & Schwarz HZ355, probe (10:1, 500 M Hz) 1x Rohde & Schwarz HMC 8012, HiRes digital multimeter with memory fun c tion MCU-based shunt measuring (own build, Powenetics softwa re) Up to 10 channels (max. 100 values per secon d) Special riser card with shunts for the PCIe x16 slot (PEG) |
| Thermal Imager: |
1x Optris PI640 + 2x Xi400 Thermal Imagers Pix Connect Software Type K Class 1 thermal sensors (up to 4 channels) |
| OS: | Windows 10 Pro (all updates, current certified or press drivers) |

- 1 - Introduction and Technical Background
- 2 - GeForce RTX 3070 without and with OC - Gaming
- 3 - GeForce RTX 3070 without and with OC - Torture (Max. Load)
- 4 - Radeon RX 6800 without and with OC - Gaming
- 5 - Radeon RX 6800 without and with OC - Torture (Max. Load)
- 6 - Radeon RX 6800XT without and with OC - Gaming
- 7 - Radeon RX 6800XT without and with OC - Torture (Max. Load)
- 8 - Summary and Conclusion


Kommentieren