


Disclaimer: The following article is machine translated from the original German, and has not been edited or checked for errors. Thank you for understanding!
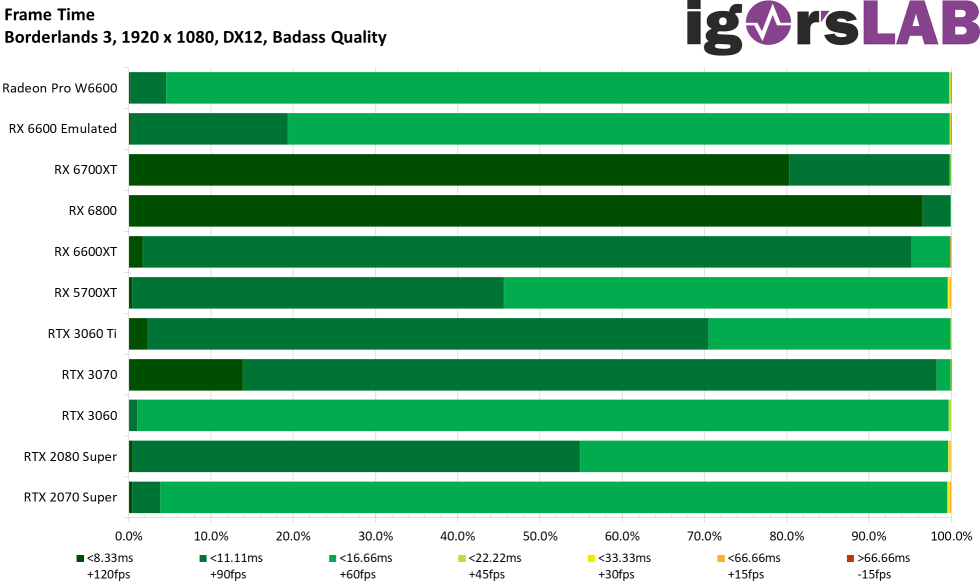
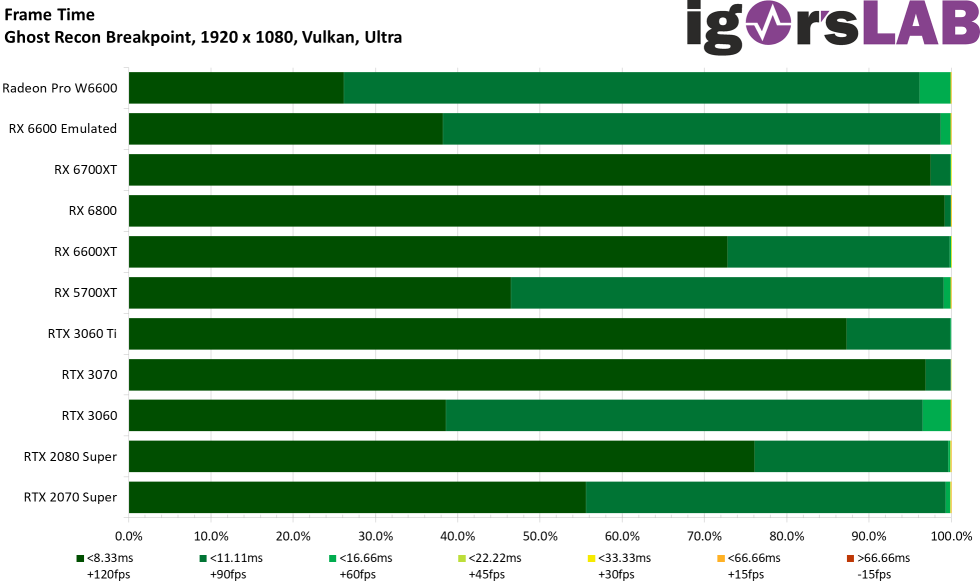
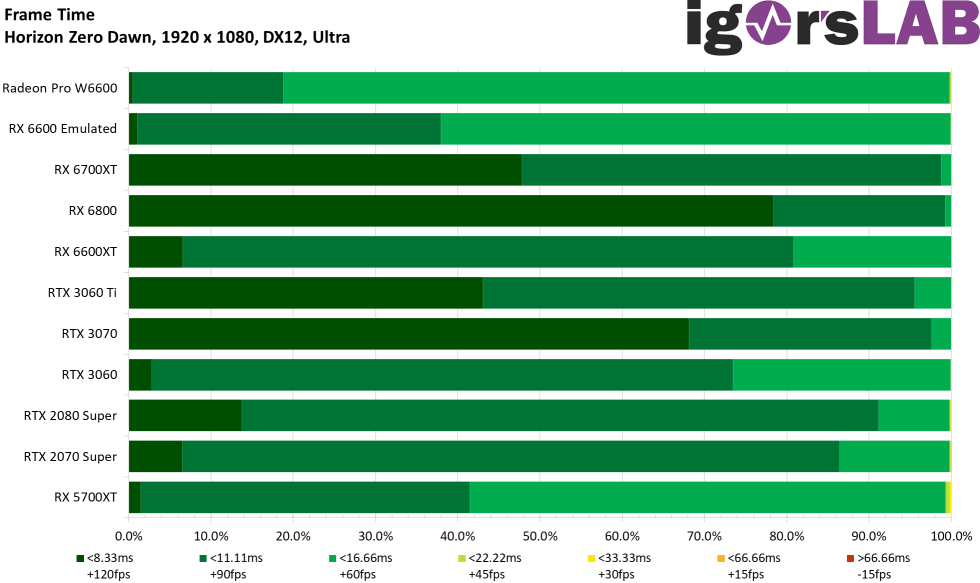
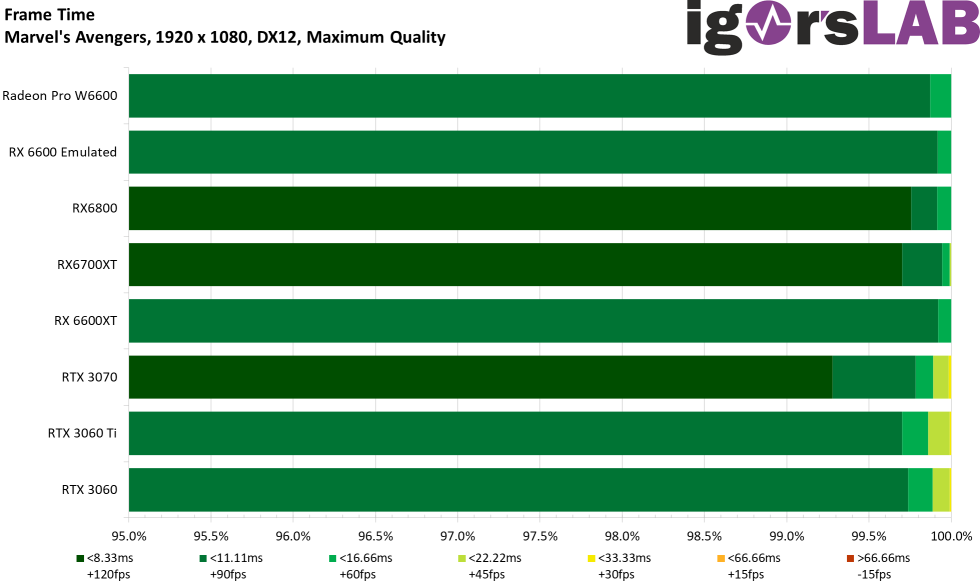
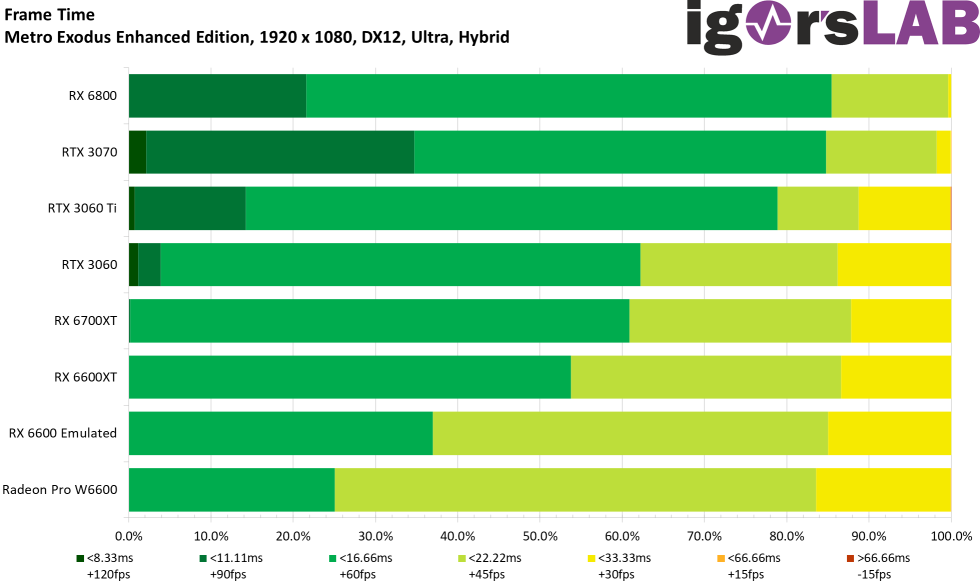
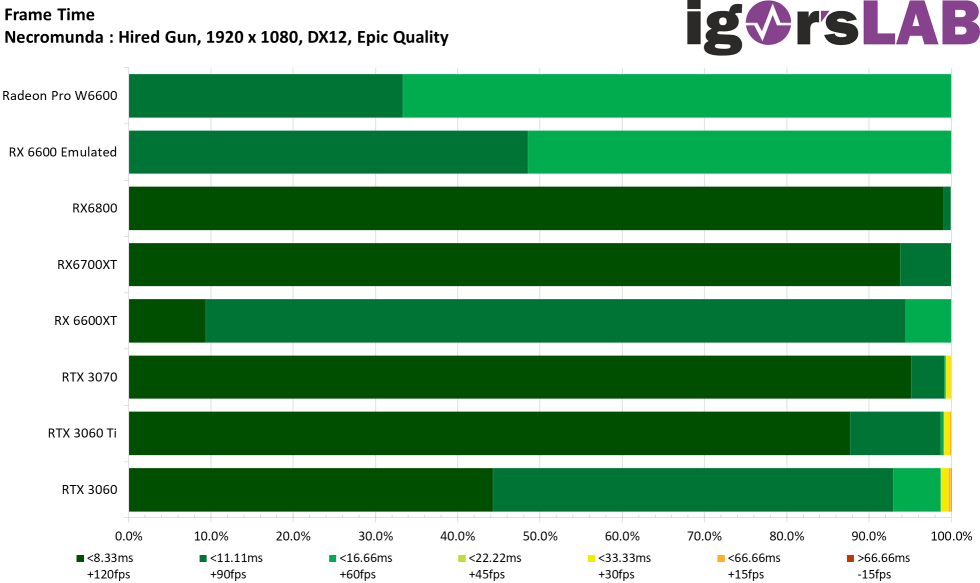
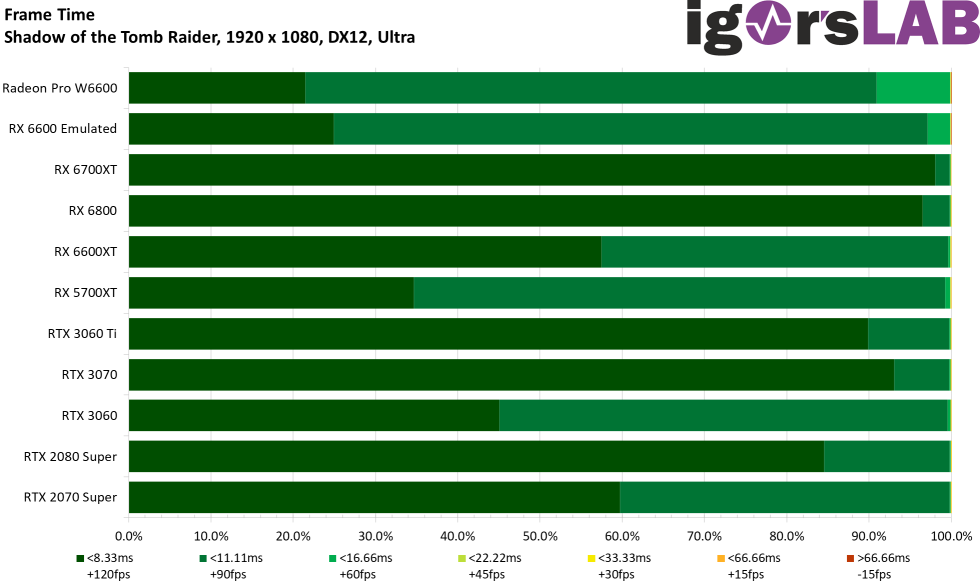
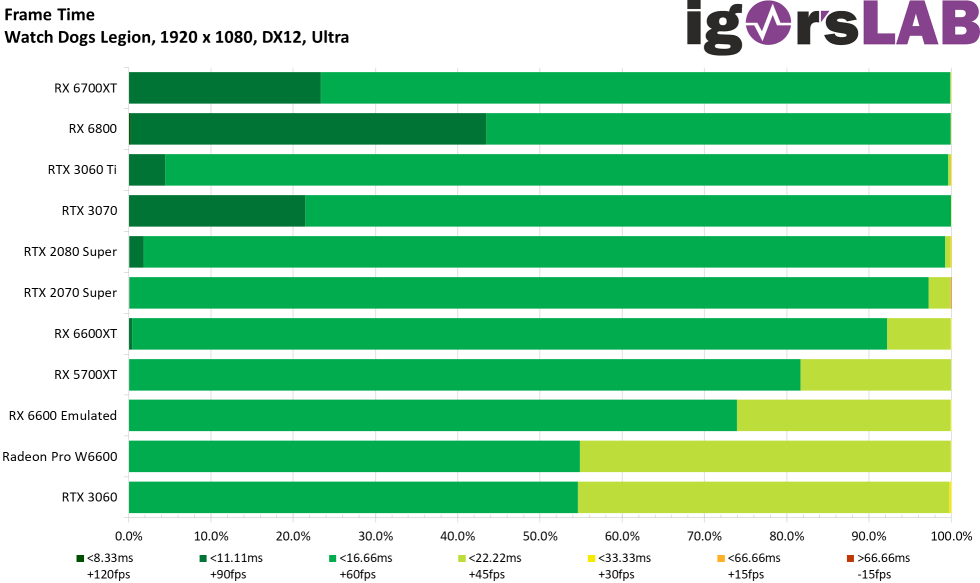
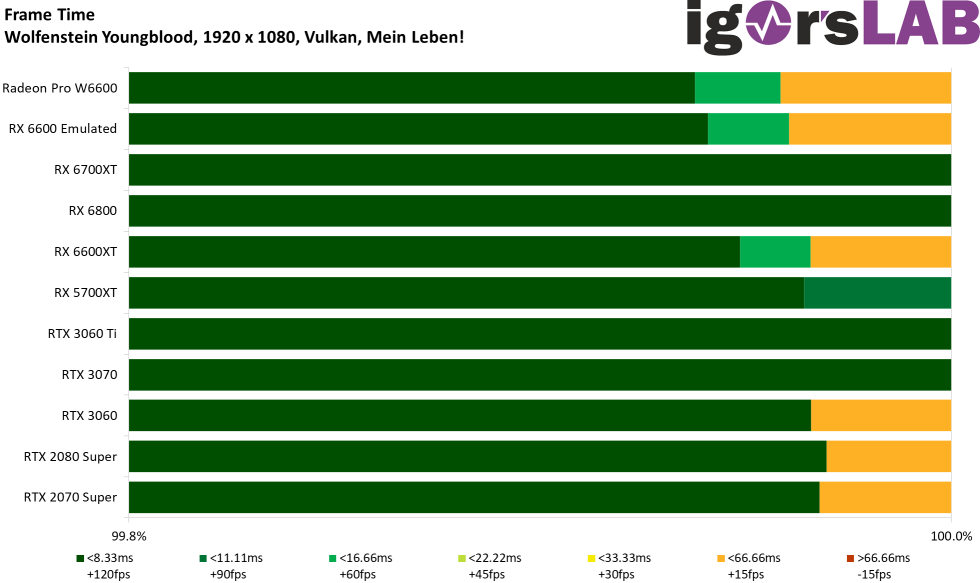
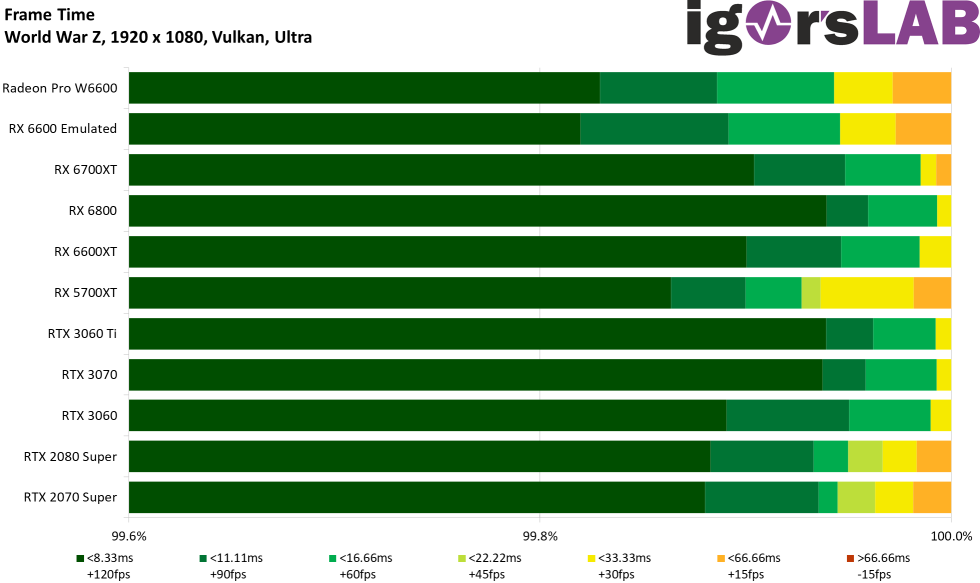
Of course, curves lying on top of each other are not very clear. But you can also record the progressions in a bar chart. This is much clearer and the original frame times are used again, whose number depends on the speed of the card, because the benchmark duration is always the same.

- 1 - Einführung und Technische Daten
- 2 - Testsystem und Methodik
- 3 - Gaming Performance Full-HD
- 4 - FPS-Verläufe als Kurven pro Karte und Spiel
- 5 - Kurven der Percentile pro Karte und Spiel
- 6 - Frame Time Kurven pro Karte und Spiel
- 7 - Frame Time Balkengrafiken pro Karte und Spiel
- 8 - Varianzen pro Karte und Spiel
- 9 - Leistungsaufnahme pro Karte und Spiel
- 10 - Leistungsaufnahme CPU pro Karte und Spiel
- 11 - Effizienz pro Karte und Spiel
- 12 - Kumulation, Zusammenfassung und Fazit


14 Antworten
Kommentar
Lade neue Kommentare
Urgestein
Mitglied
Veteran
Veteran
Veteran
Moderator
Mitglied
Urgestein
Mitglied
Mitglied
Veteran
Urgestein
Urgestein
Urgestein
Alle Kommentare lesen unter igor´sLAB Community →