


One knows and hates it, the beloved moment when a power supply suddenly switches off in the middle of a game, even though it is new and shows no other conspicuous features. The user’s annoyance becomes even greater when you think you have calculated the power supply size correctly. But is what the manufacturers of graphics cards or power supplies indicate as the performance value sufficient? With power supplies you can be relatively sure, but what about the graphics cards?
And in return one always amuses oneself about the power supply calculators of the graphics card providers, which often enough spit out much higher values than what one finds in normal measurements. If you know my graphics card tests, you also know that I always include the so-called spikes (<20 ms), but I also like to relativize these much higher values. Modern power supplies should be able to handle such very short load peaks easily. Should.
But can they really do that? And above all: how long ? And what is the difference between a game and a continuous load such as calculations or a stress test? Exactly this question I’m following now, because apparently and unfortunately nobody else really cares about it in detail. And what about the protective circuits built into the power supplies?
PCGH colleagues recently reported in an article that Seasonic had found unusual load peaks on an AMD RX Vega56 that could lead to the shutdown of a particular type of power supply. The conclusion is that up to 600 watts would be present in a 10ms interval, which would correspond to a current of over 50 amps on the 12V line for a card. The fact that a 550 watt power supply would then switch off after such loads have accumulated would actually only be logical. But what is the real point?
However, as an update I have to add that this information comes from the Seasonic support and that the graphics card alone was not measured here, but the entire system. Unfortunately, this is not so clear from the respective Reddit entry:
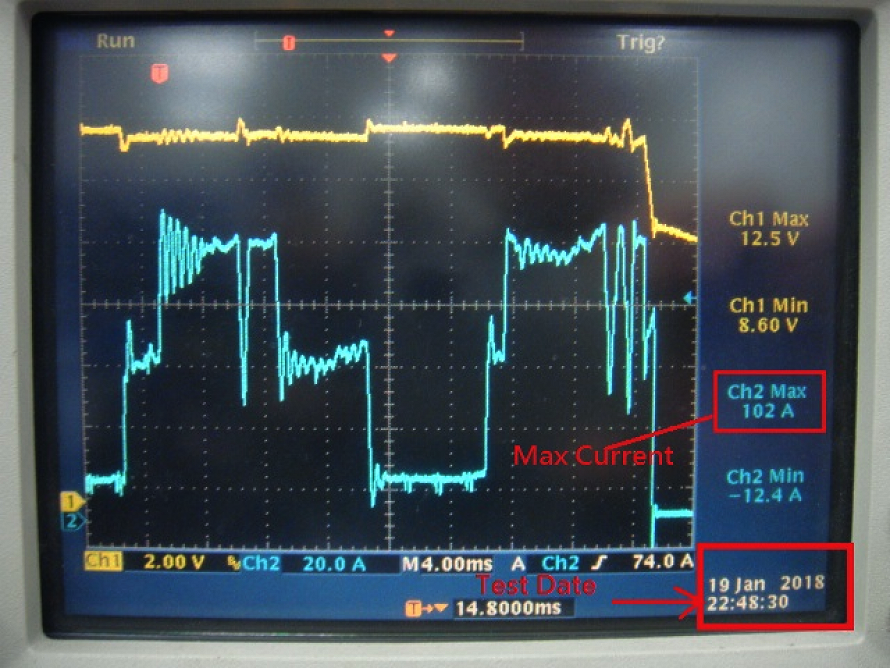
AMD’s Vega 56/64 graphics card has a very high transient power consumption. The oscilloscope screenshot below shows the transient current when using the two Vega 56 CrossFire for FurMark test, up to 102A / 10ms, which means the power supply must withstand 1200W peak wattage. Even a single Vega 56 graphics card may have nearly 600W of transient power consumption.
What awaits the reader? Measurements and facts!
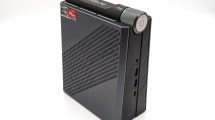
I think it’s a bit unfair to put AMD in the focus and color the Black Peter game bright red from the start. That’s exactly why I picked out three cards with similar power consumption: the AMD Radeon RX Vega64 (approx. 250 watts, reference and custom), the Nvidia GeForce GTX 1080 Ti FE (approx. 250 watts) and the GeForce RTX 2080 Ti FE (approx. 275 watts), whereby these watt specifications refer to the actually measured power consumption.
So I’m clearly above what Seasonic (supposedly) could have produced with a much more economical RX Vega56 nominally in terms of loads. And I will also show which currents and which intervals I really determined in over 200 automated single measurements per card. So there will also be a manufacturer- and generation-adjusted summary, which card generates the longest and or the highest load peaks when exactly.
We will immediately see how the cards regulate the whole thing, each with maximum gaming load and the constantly demanding stress test. Power Tune (AMD) and Boost (Nvidia) are more restrictive than you might think, and many things are getting better. And it will also show that the power supply manufacturers should write a few more things into their own specifications instead of demonizing the graphics cards alone. Here, cause and effect would be blatantly exchanged.
The colleagues at the power supply manufacturer complain that they were able to measure current peaks of more than 50 amps with a duration of 10ms, which sounds complicated at first, but is very easy to check in the laboratory. I have therefore limited the entire measurement period to 20 milliseconds, but I measure everything there at intervals of 10 microseconds! We can rule out aliasing effects by using a measurement setup and equipment. At the same time, I also check the stability of the power supply’s voltages at the same intervals.
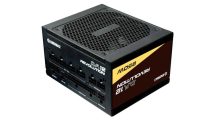
I also bundle the two external power connections to a common rail and measure as the currents would flow at a single-rail power supply. The 550 watt mains used especially for this test (Be Quiet Dark Power Pro 11 550 watts, OC mode as single rail) overvolts slightly, but this is rather marginal and full within the specifications. Since we’re only interested in the currents, that’s fine, because an overload protection (OPP) is also based on the overcurrent protection (OCP).
Test system and measurement methods
The test system and methodology are well known, but since I now test independently here in Germany, the test system has also been upgraded again without having to consider the former US colleagues.
The summary in tabular form offers interested readers a quick overview:
| Testsysteme und Messräume | |
|---|---|
| System: |
Intel Core i7-8700K @5 GHz MSI MEG Z390 Ace 16 GB KFA2 DDR4 4000 Hall of Fame 1x 1 TByte Toshiba OCZ RD400 (M.2, System SSD) 2x 960 GByte Toshiba OCZ TR150 (Storage, Images) Be Quiet Dark Power Pro 11, 550-Watt-Netzteil |
| Cooling: |
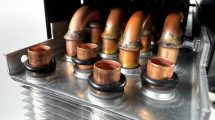
Alphacool Eisblock XPX 5x Be Quiet! Silent Wings 3 PWM (Closed Case Simulation) Thermal Grizzly Kryonaut (Thermal Grease) |
| Case: |
Lian Li PC-T70 (modified with shroud) Modi: Open Benchtable, Closed Case |
| Monitor: | Eizo EV3237-BK |
| Power Consumption: |
Non-contact direct current measurement on the PCIe-Slot (Riser-Card) Non-contact direct current measurement at the external PCIe power connectors Direct voltage measurement at the respective connectors and at the power supply unit 2x Rohde & Schwarz HMO 3054, 500 MHz Multichannel Oscilloscope 4x Rohde & Schwarz HZO50, Current Clamps 4x Rohde & Schwarz HZ355, Probes 1x Rohde & Schwarz HMC 8012, Digitalmultimeter |
| Infrared / Thermal Imager: | 1x Optris PI640, 2x Xi400 Thermal Imager Pix Connect Software |
| Noise / Acoustics: | NTI Audio M2211 (calibrated) Steinberg UR12 Creative X7, Smaart v.7 Semi-anechoic measuring room, 3,5 x 1,8 x 2,2 m (LxDxH) Axial measurements, perpendicular, measuring distance 50 cm Noise emission in dBA (slow) as RTA measurement Frequency spectrum as graphic |
| Operating System |
Windows 10 Pro (1903, all Updates) |


Kommentieren