


Write Performance Real-World (AJA)
Since I naturally like to record reader feedback, I have added the test once again and test the SSD once new and quasi out-of-the box as well as once with 90% occupancy, after I write random content (variable size) for one day up to the approximate full occupancy and then replaced parts of these files with new content over and over again. After approx. For 23 minutes, the SSD reached the maximum temperature of 53 °C in the top . Aorus Z390 Master's M2 slot with the cooling cover provided by the motherboard. The following graphs are taken from the measurements that most closely corresponded to the average value in the respective run of 5 measurements.
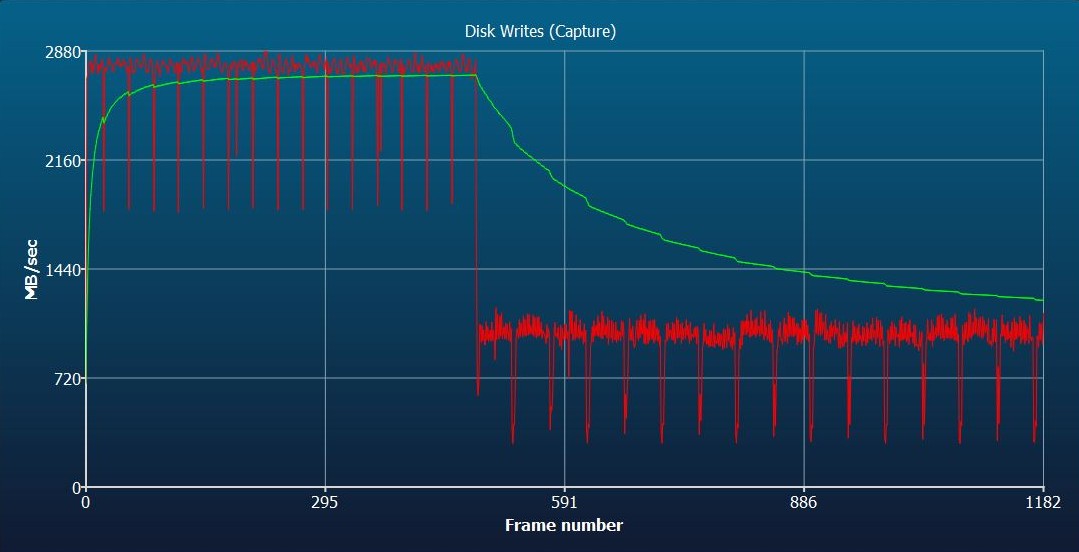
First, let's look at the writing performance of the empty new SSD. The write rate of initially approx. 2650 MB/s (peak value of 2880 MB/s), reached after the elimination of the filled SLC cache (approx. 24 GB, see chart) only has an average value of approx. 1233 MB/s, with slumps of up to 290 MB/s. The performance degradation after the full write of the SLC cache is typical of such disks and, in the end, nothing for applications that rely on constant write rates. Sample recordings in my video studio with low-compressed 4K streams are already bringing this SSD to the edge of what is possible.
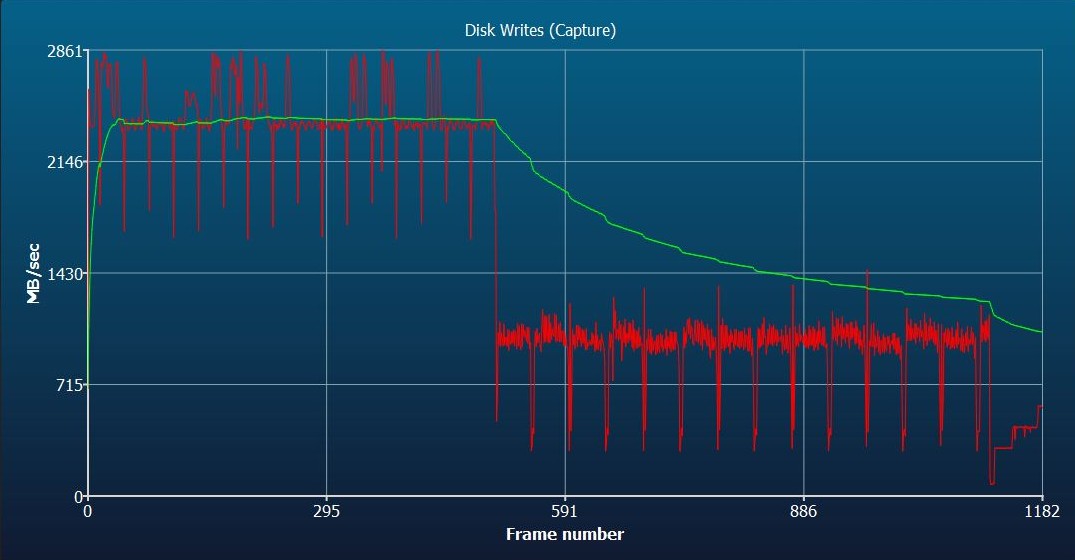
But much more interesting is the behavior of the SSD after the 24-hour stress test and with 90% occupancy! The initial 2420 MB/s (peaks at 2862 MB/s) are already well below the rate of the first test. The write rate after utilization of the SLC cache drops to approx. 1052 MB/s and is approx. 180 MB/s lower than in the first attempt. This is also due to the general decline in the performance of the SSD. Especially since the break-ins when writing without a cache with only 76 MB/s were almost dramatic.
Reading Performance Real World (AJA)
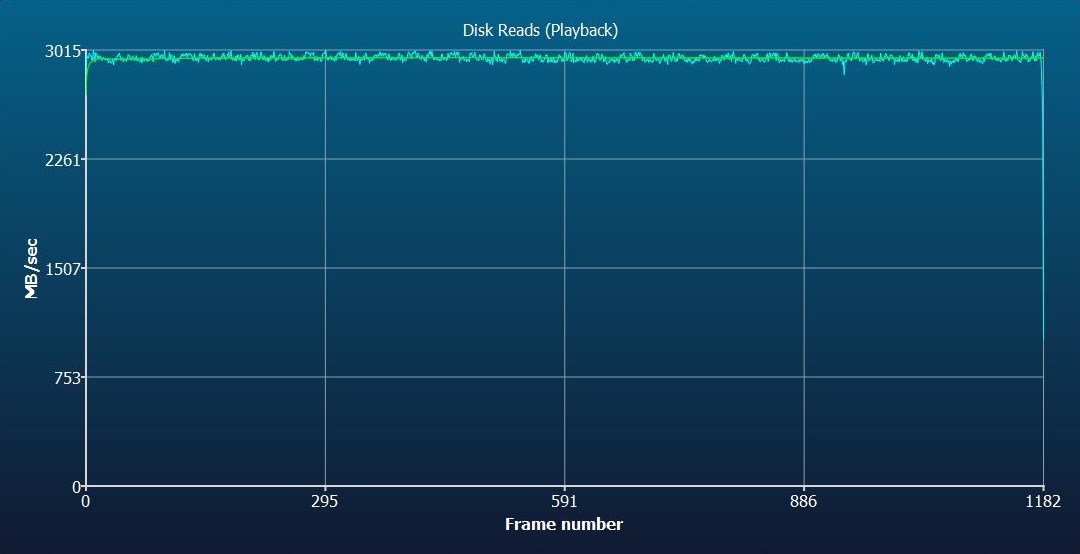
But what happens when you read? I can spoil this before: something very similar! The initial read rate of 2953 MB/s on average (peak values up to 3015 MB/s) looks really good and it remains fairly constant throughout the stream. The manufacturer's promises, as synthetic test programs such as CrystalDiskMark suggest, are visibly undercut. Nevertheless, this value is good and appropriate for an SSD of this price range.
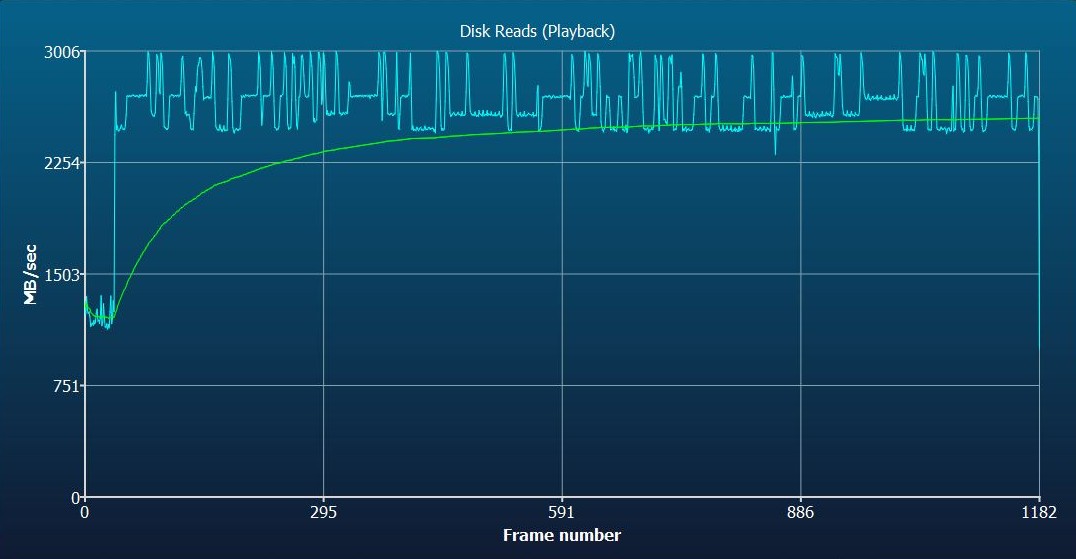
However, the SSD used brings a slightly different knowledge when it is 90% filled and has been intensely stressed for a day. The average reading rate drops by approx. 400 MB/s (!) to only 2549 MB/s with peaks up to 3006 MB/s and sometimes very clear access problems at the start, which have break-ins of up to 1001 MB/s. The very uncircular curve also shows very clearly that such SSDs should really never be completed. I was able to 65% occupancy did not detect any slumps at all, then the drop in performance in writing and reading increased rapidly.
The high read rate of the new SSD is never reached again even after the explicit deletion of all data, partitioning and subsequent formatting. The values listed below are averages from a total of 5 measurements per pass and differ slightly from the above individual measurements. Already after the one-off (!) The SSD offers a full letter and subsequent reset by approx. 290 MB/s lower read rate of only 2665 MB/s (new 2953 MB/s). The write rate after the SLC cache is eliminated drops only minimally to 1205 MB/s (new 1233 MB/s). After a day of extensive use, the reading rate drops to approx. 2583 MB/s further, the writing also loses slightly with the measured 1189 MB/s.
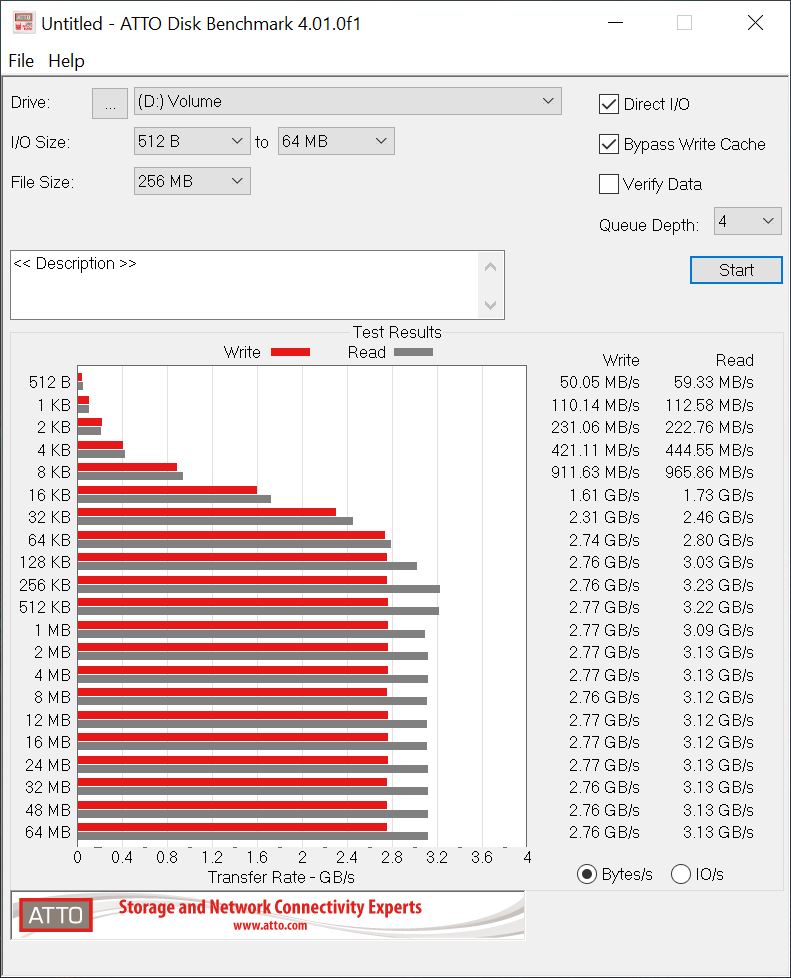
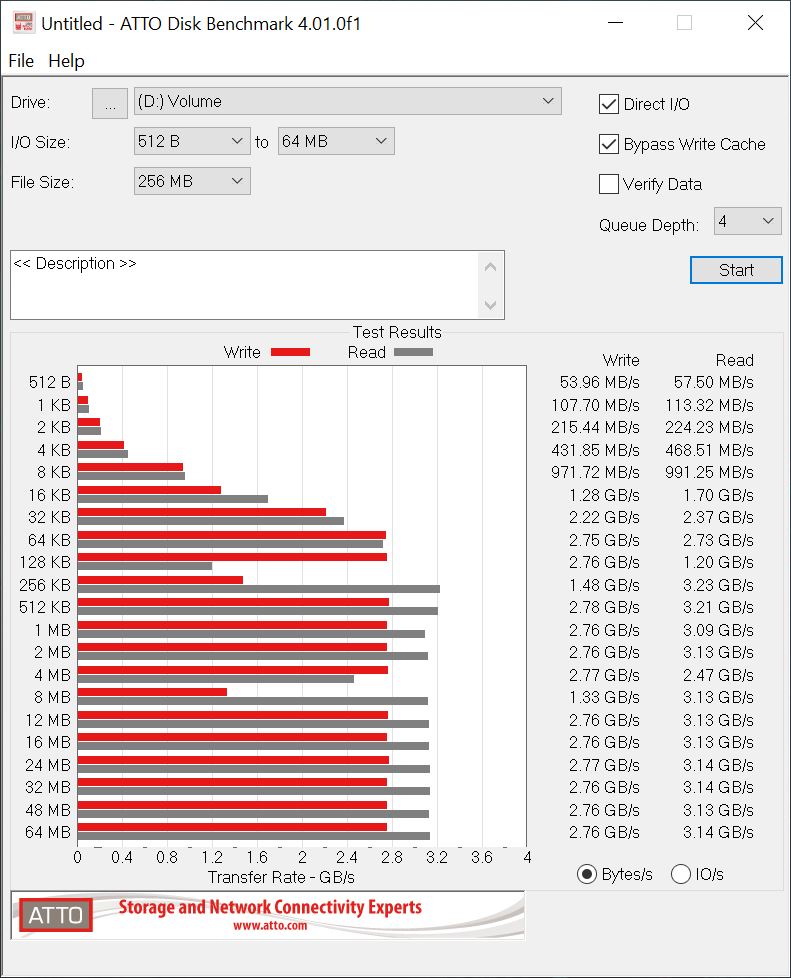
What CrystalDiskMark does to us and at least captures ATTO
Well, what does the much-loved Crystal say? Nothing that then permanently disqualifies him for practice, because the values determined above are reproducible and also correspond to logic. On the contrary, with the CrystalDiskMark even the write rates of the full and stressed record increase, which completely contradicts any experience. So you can safely forget these values, because in the end you only "measure" the 24 GB SLC cache and not the entire SSD as such.


And what does ATTO do? You can see, at least from the bar flutter of the right graphic (90% fill), that something is no longer true. However, again, all values are only with active SLC cache, which never comes to full runs. Practice looks different!
Summary and conclusion
No 120 Euros is a fight announcement, even if the SSD should never be used in its full size, even for a short time or once. The "damage" can be measured immediately. Despite this criticism and the measurement results, it is still a fast SSD with a solid controller. But both Micron's TLC and Phison's E12 are and remain mediocre, but the manufacturer can't pay extra. So the price and performance go well together and this knowledge can also be used resiliently.
This one day stress test simulates almost a year of normal use at the end due to the frequent writing and especially deletion cycles, which then puts the whole thing into perspective a little. What I liked are the low temperatures, which on average barely exceeded 45 °C and could not advance into red areas even with a peak of 53 °C during full writing. That's all still ok and well tolerated. In this way, I would even make a verbal recommendation to this SSD if you do not want to use it as a permanent data slingshot, but e.g. as a fast system disk.


Kommentieren