


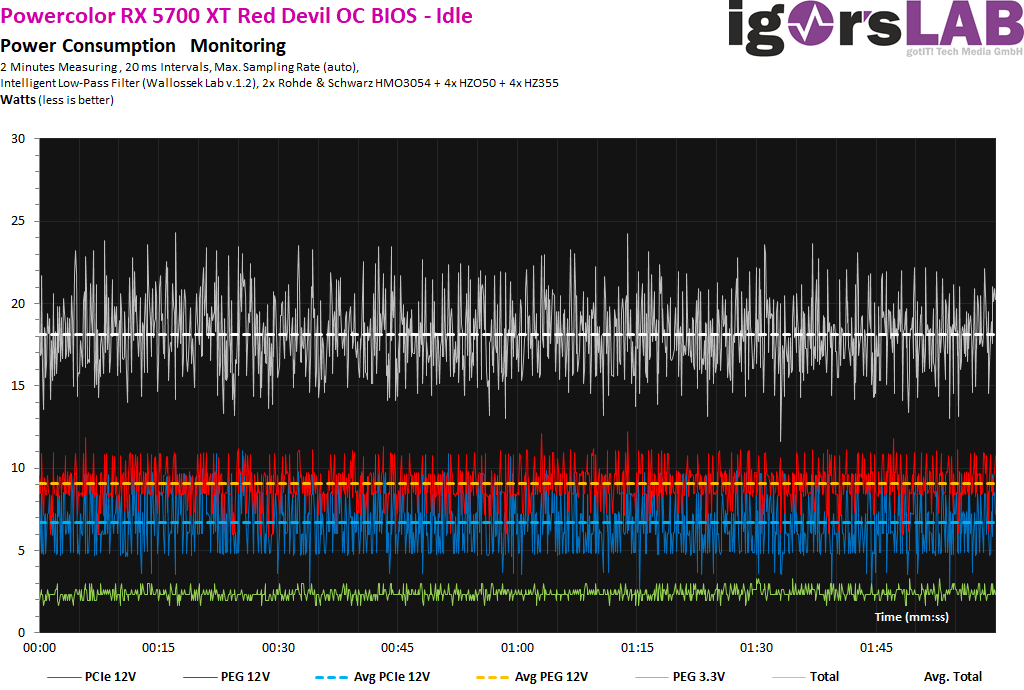
Power consumption and loads
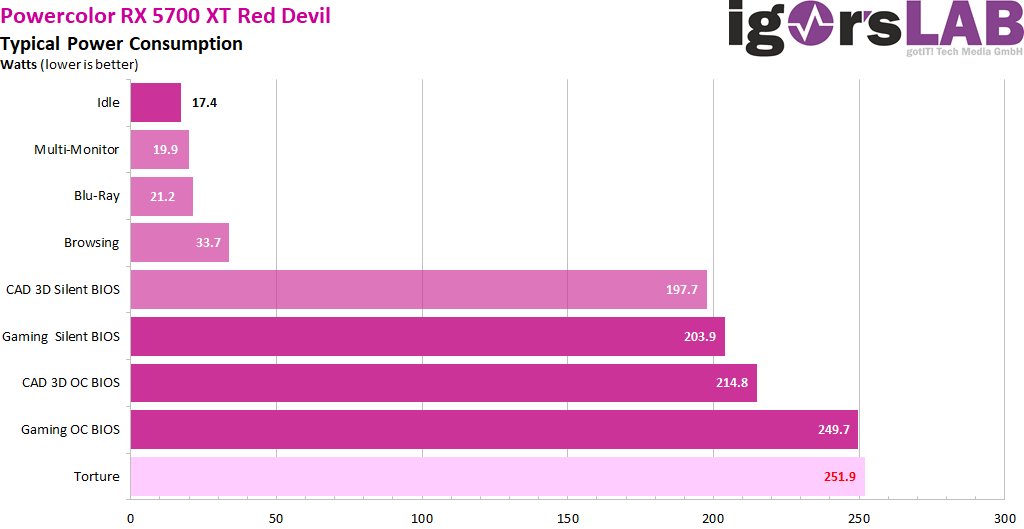
First, let's consider the power consumption in different load states from the idle to the absolute maximum as an average value over a longer measurement period. The two BIOS modes are interesting here, because for a total performance difference of up to 8 percent, up to 22 percent more electrical power is due!
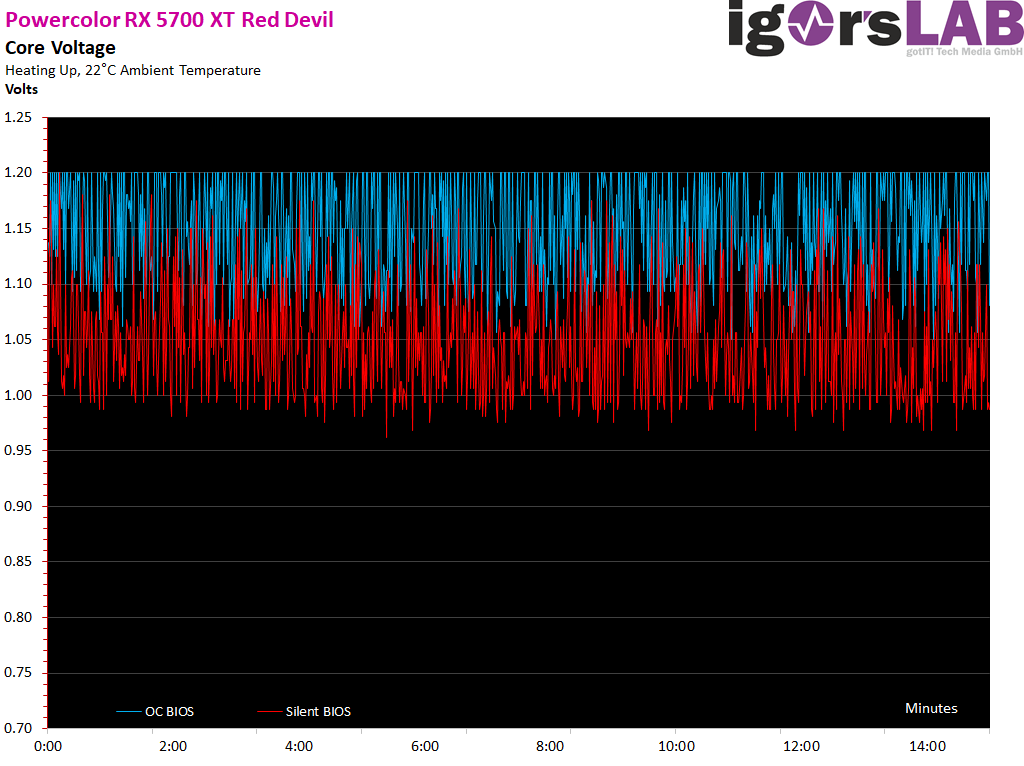
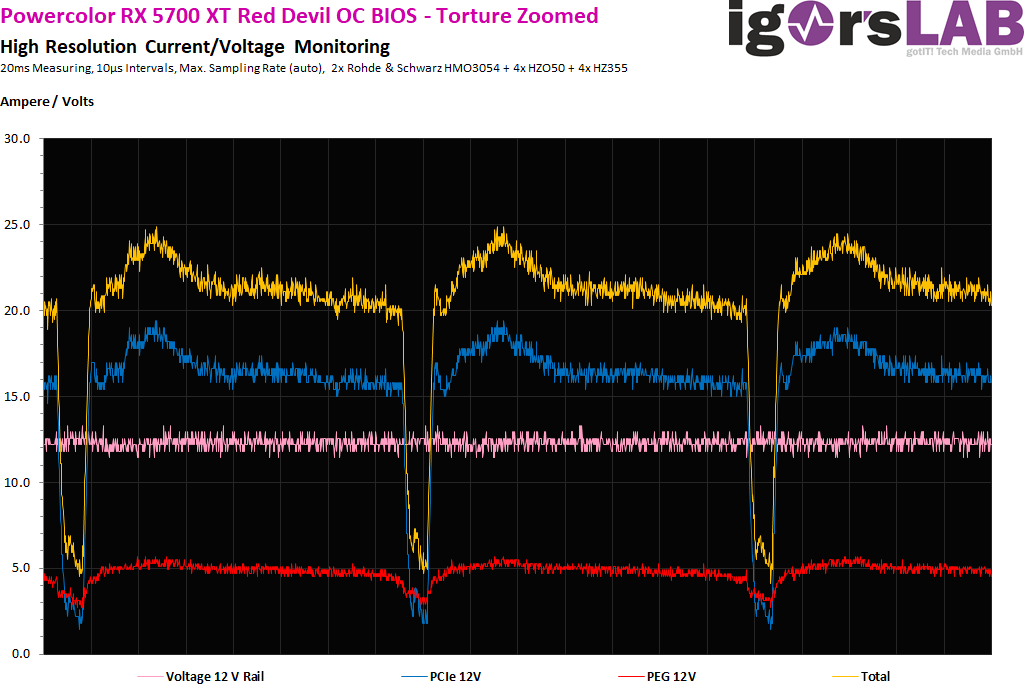
The temperature-dependent voltage curve is also interesting, because we see that the firmware activates the limiter at exactly 1.2 volts:
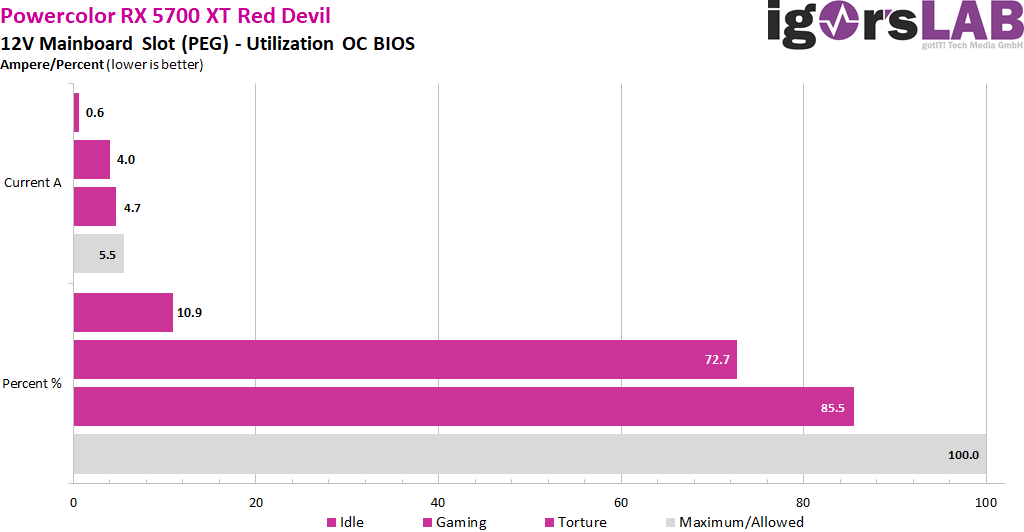
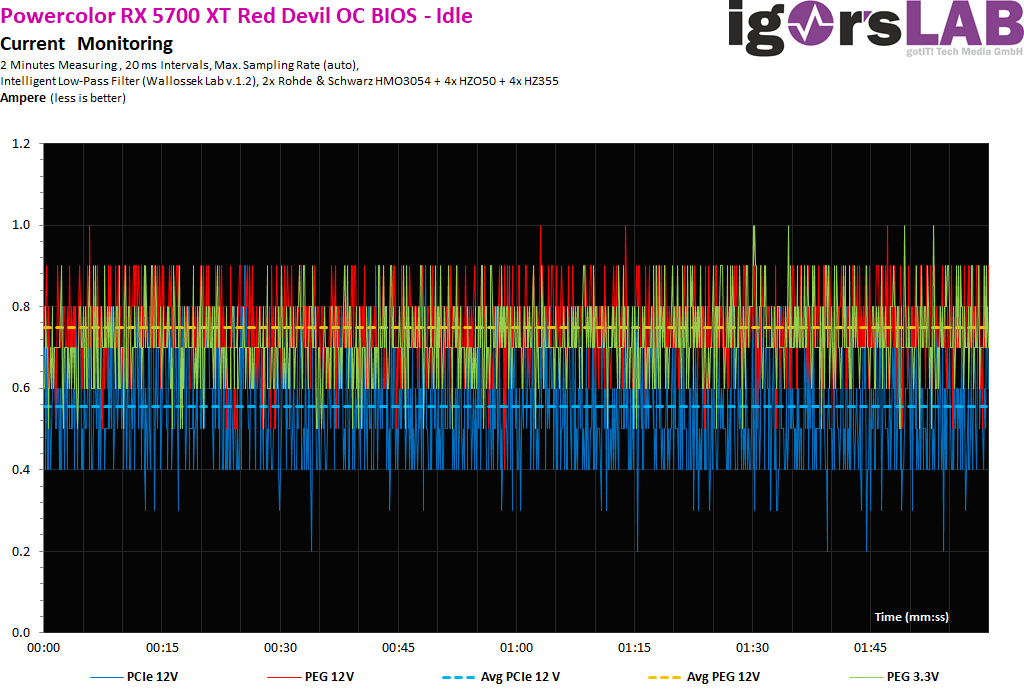
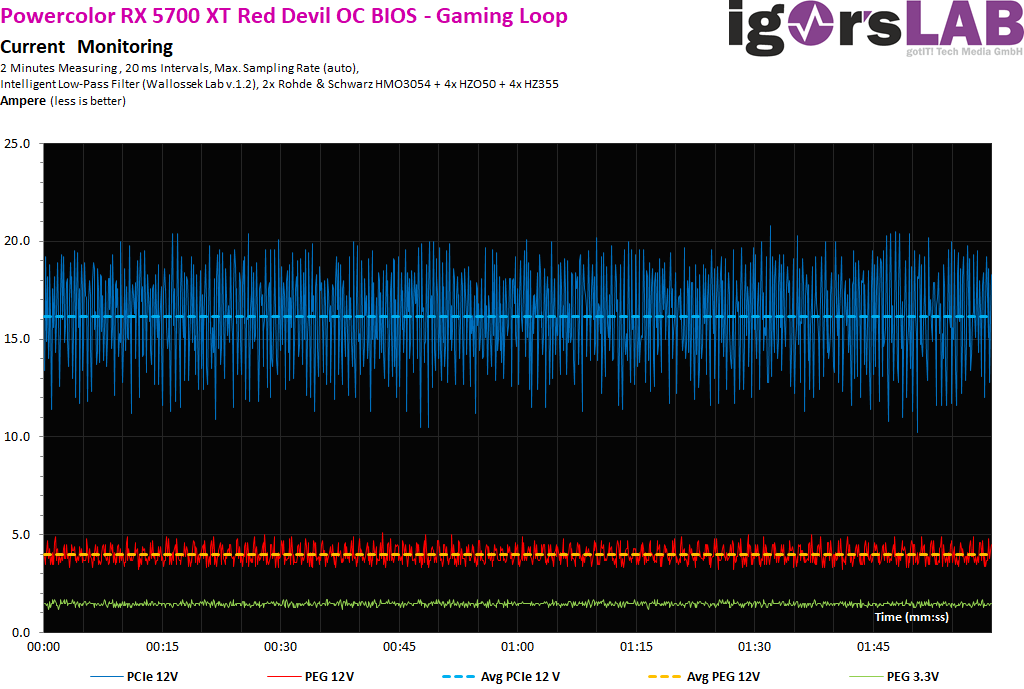
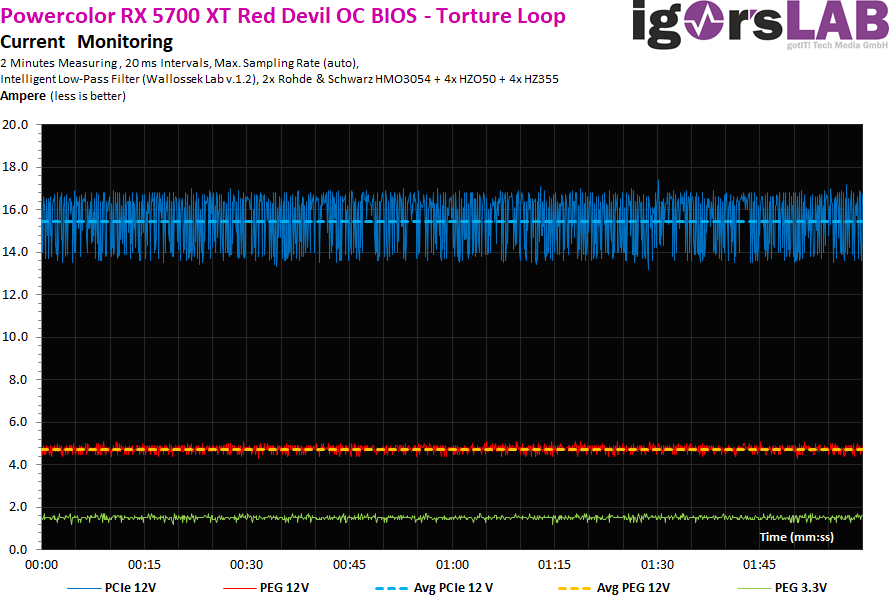
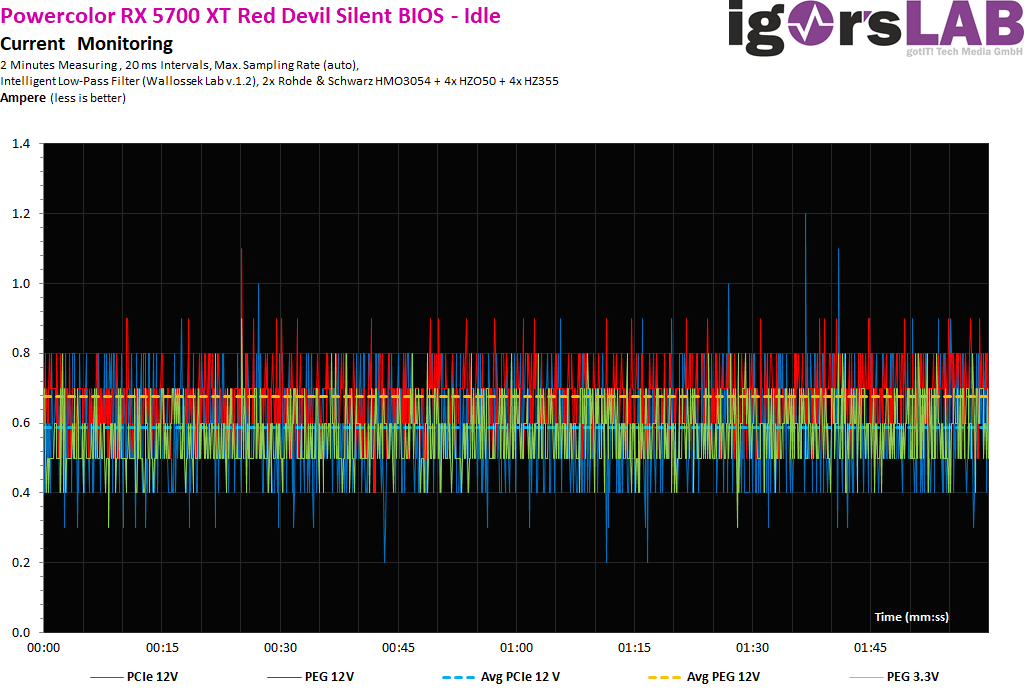
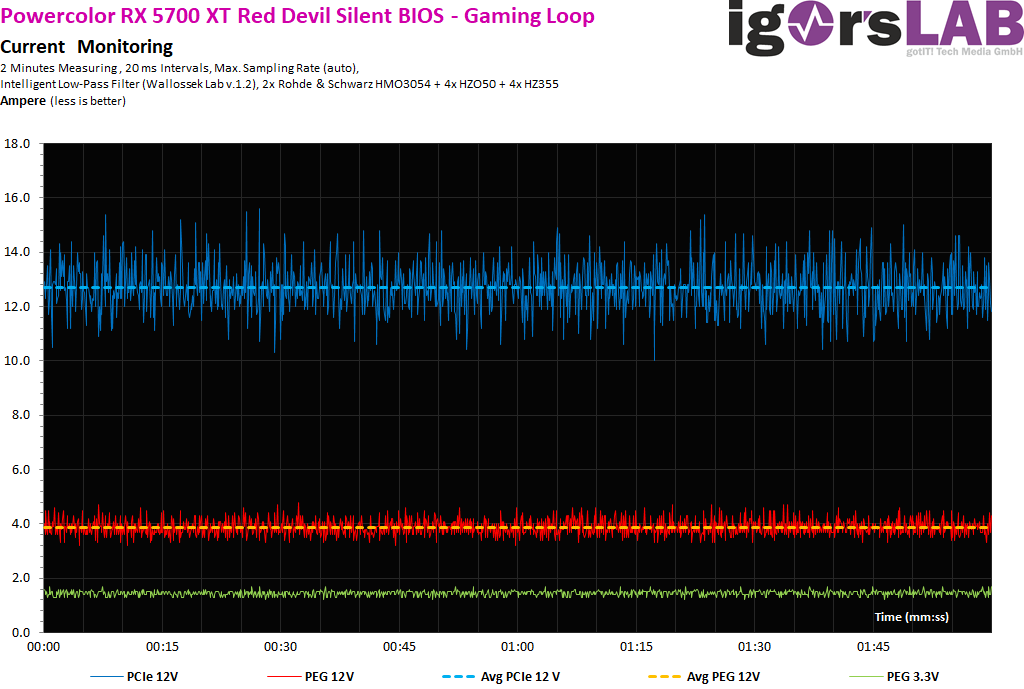
The load distribution on the rails is perfect, because in normal operation and with the OC the maximum permissible 5.5 amperes of the motherboard slot are never exceeded:
Power supply design and peak loads/currents
As I have already demonstrated in detail in my basic article "The fight of graphics card against power supply – power consumption and load peaks demystified", there are also temporarily higher loads in the millisecond range, which are unfavorable in case of unfavorable designed or improperly equipped power supplies can already lead to unexplained shutdowns. The TBP (Typical Board Power) measured by the graphics card manufacturer or the reviewers does not really help for a stable design of the system.
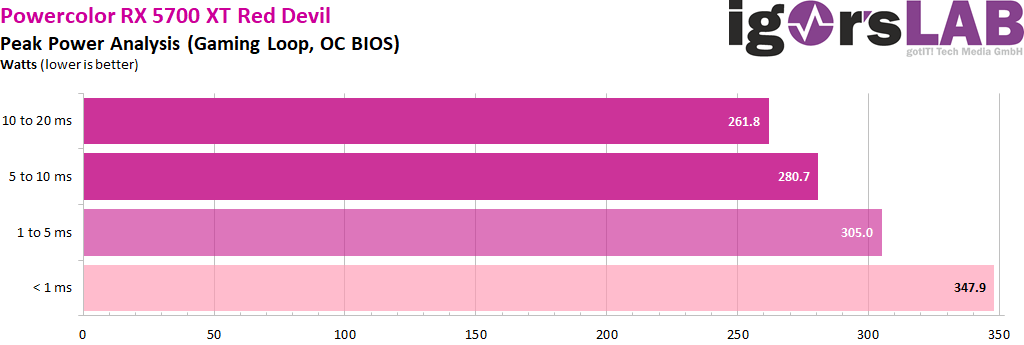
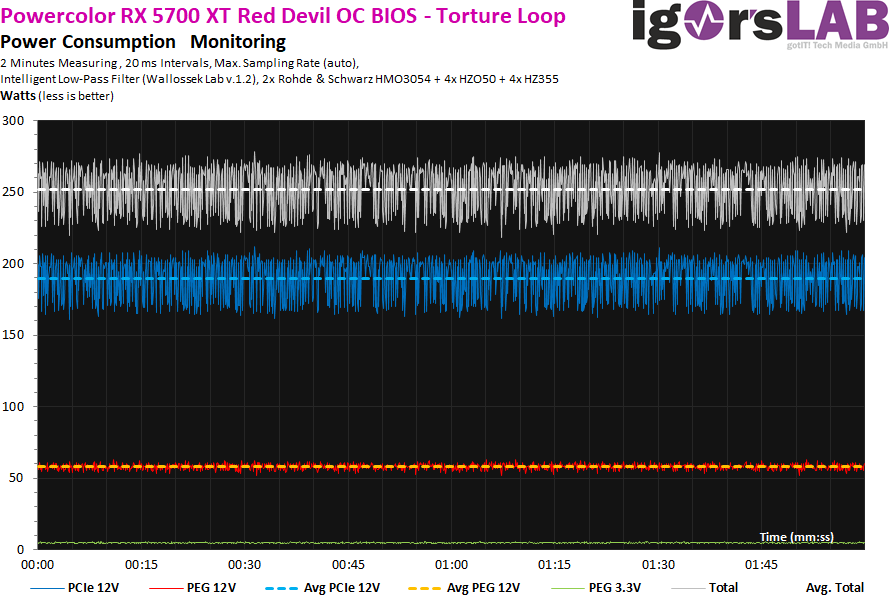
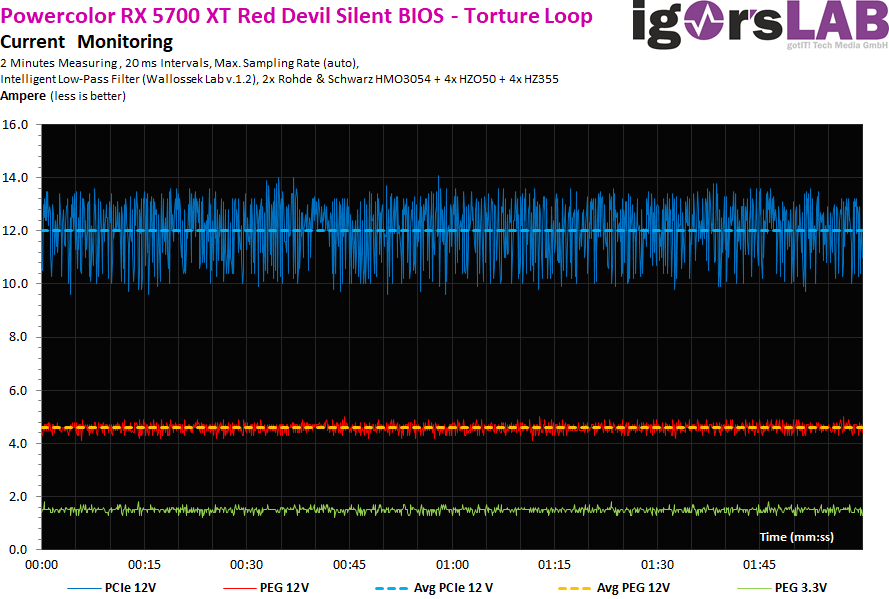
Peaks with intervals between 1 and 10 ms can lead to shutdowns with very fast-reacting protective circuits (OPP, OCP), especially for multi-rail power supplies, although the average power consumption is still in the norm. For this card, I would therefore calculate with almost 300 watts for the graphics card as such, in order to have enough reserves in case of cases. A short excerpt with high resolution now show us the 20 ms intervals, how I run them automatically for valuation:
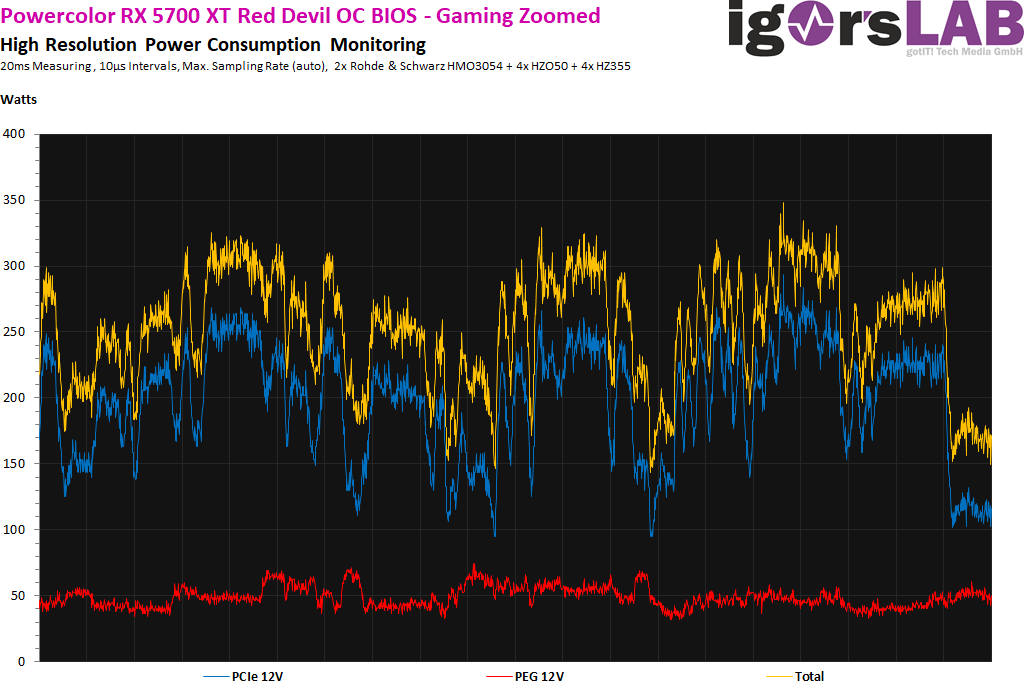

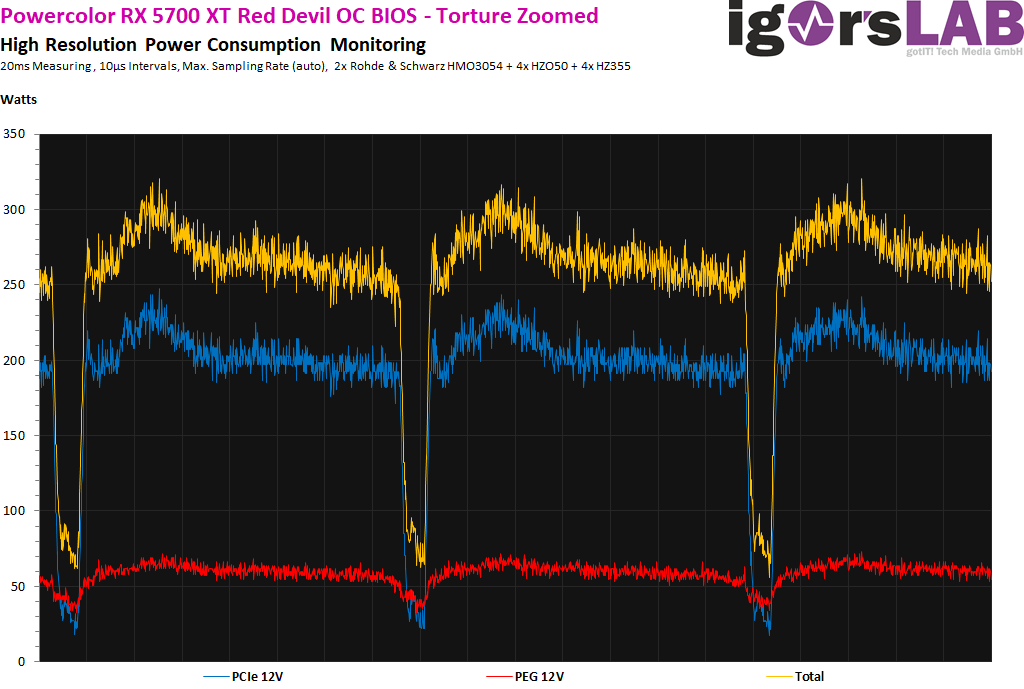
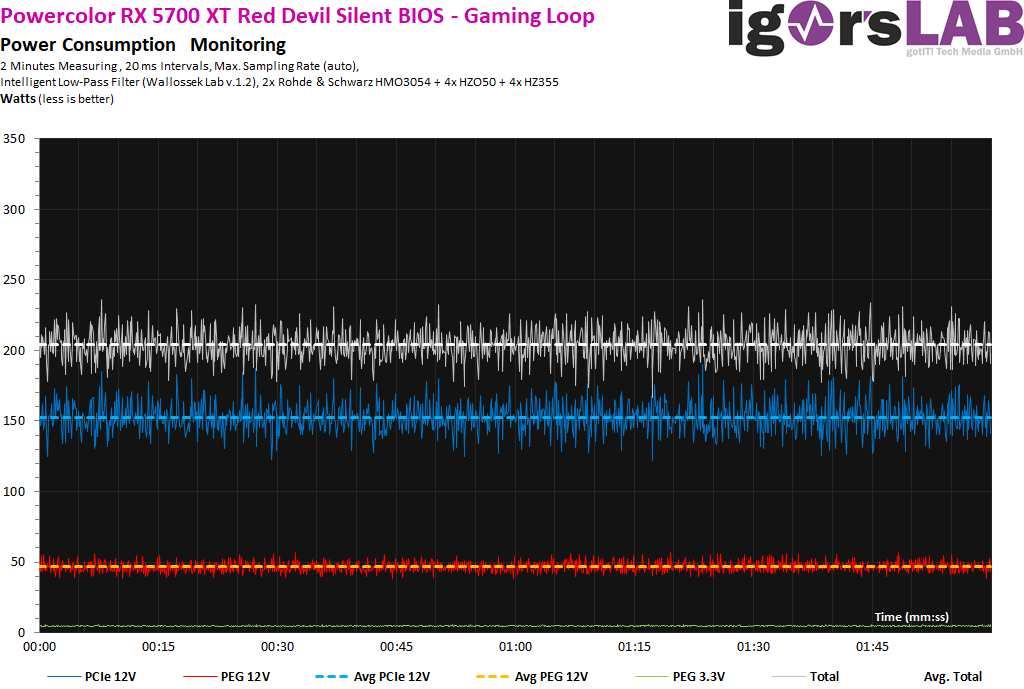
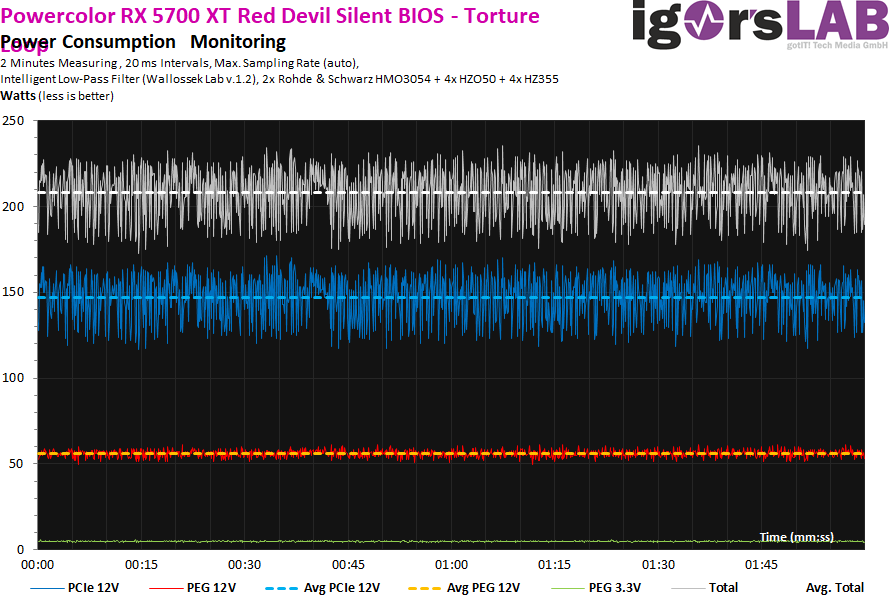
Detailed recording of average power consumption and flowing currents
As usual, I now also set aside the power consumption and the flowing currents as detailed graphics of my oscillograph measurements. A service that hardly anyone else offers and which shows how the maps "tick" in detail:
Normal BIOS:

Silent BIOS:


Kommentieren