


Just before the launch of Ampere, NVIDIA is quickly unleashing two tools that can make life easier for reviewers and technology enthusiasts. In today’s article “NVIDIA LDAT – Latency Display Analysis Tool Introduced and Quite Exclusively Tested” you will learn everything about latencies and their origin, as well as how to measure them conveniently. So much for the digressiveness, but still appropriate to the topic, because NVIDIA now seems to be doing it in tools. At last you almost think.
In this article here, however, we’ll talk about measuring the power consumption (colloquially “consumption”) with PCAT and the necessary hardware, linking this data via a suitable API with NVIDIA FrameView, a PresentMon LowLevel acquisition tool for the current frame times in the game, which can also retrieve system data and log everything more or less in real time and synchronously. A long sentence, but it’s a tough one!
If you don’t know my articles about power consumption measurement with high-resolution oscilloscope technology (8-channel analog in master/slave with two storage oscilloscopes) yet, I would like to refer you to the detailed explanation of my measurement technique and the actual problem, but I will have to come back to it later anyway. Also to explain what PCAT can and cannot do. Here first of all the two important links for a better understanding:
– Graphics card versus power supply – basics, causes of errors and correct power supply dimensioning
– The battle of graphics card against power supply – power consumption and load peaks demystified
PCAT – the hardware in detail
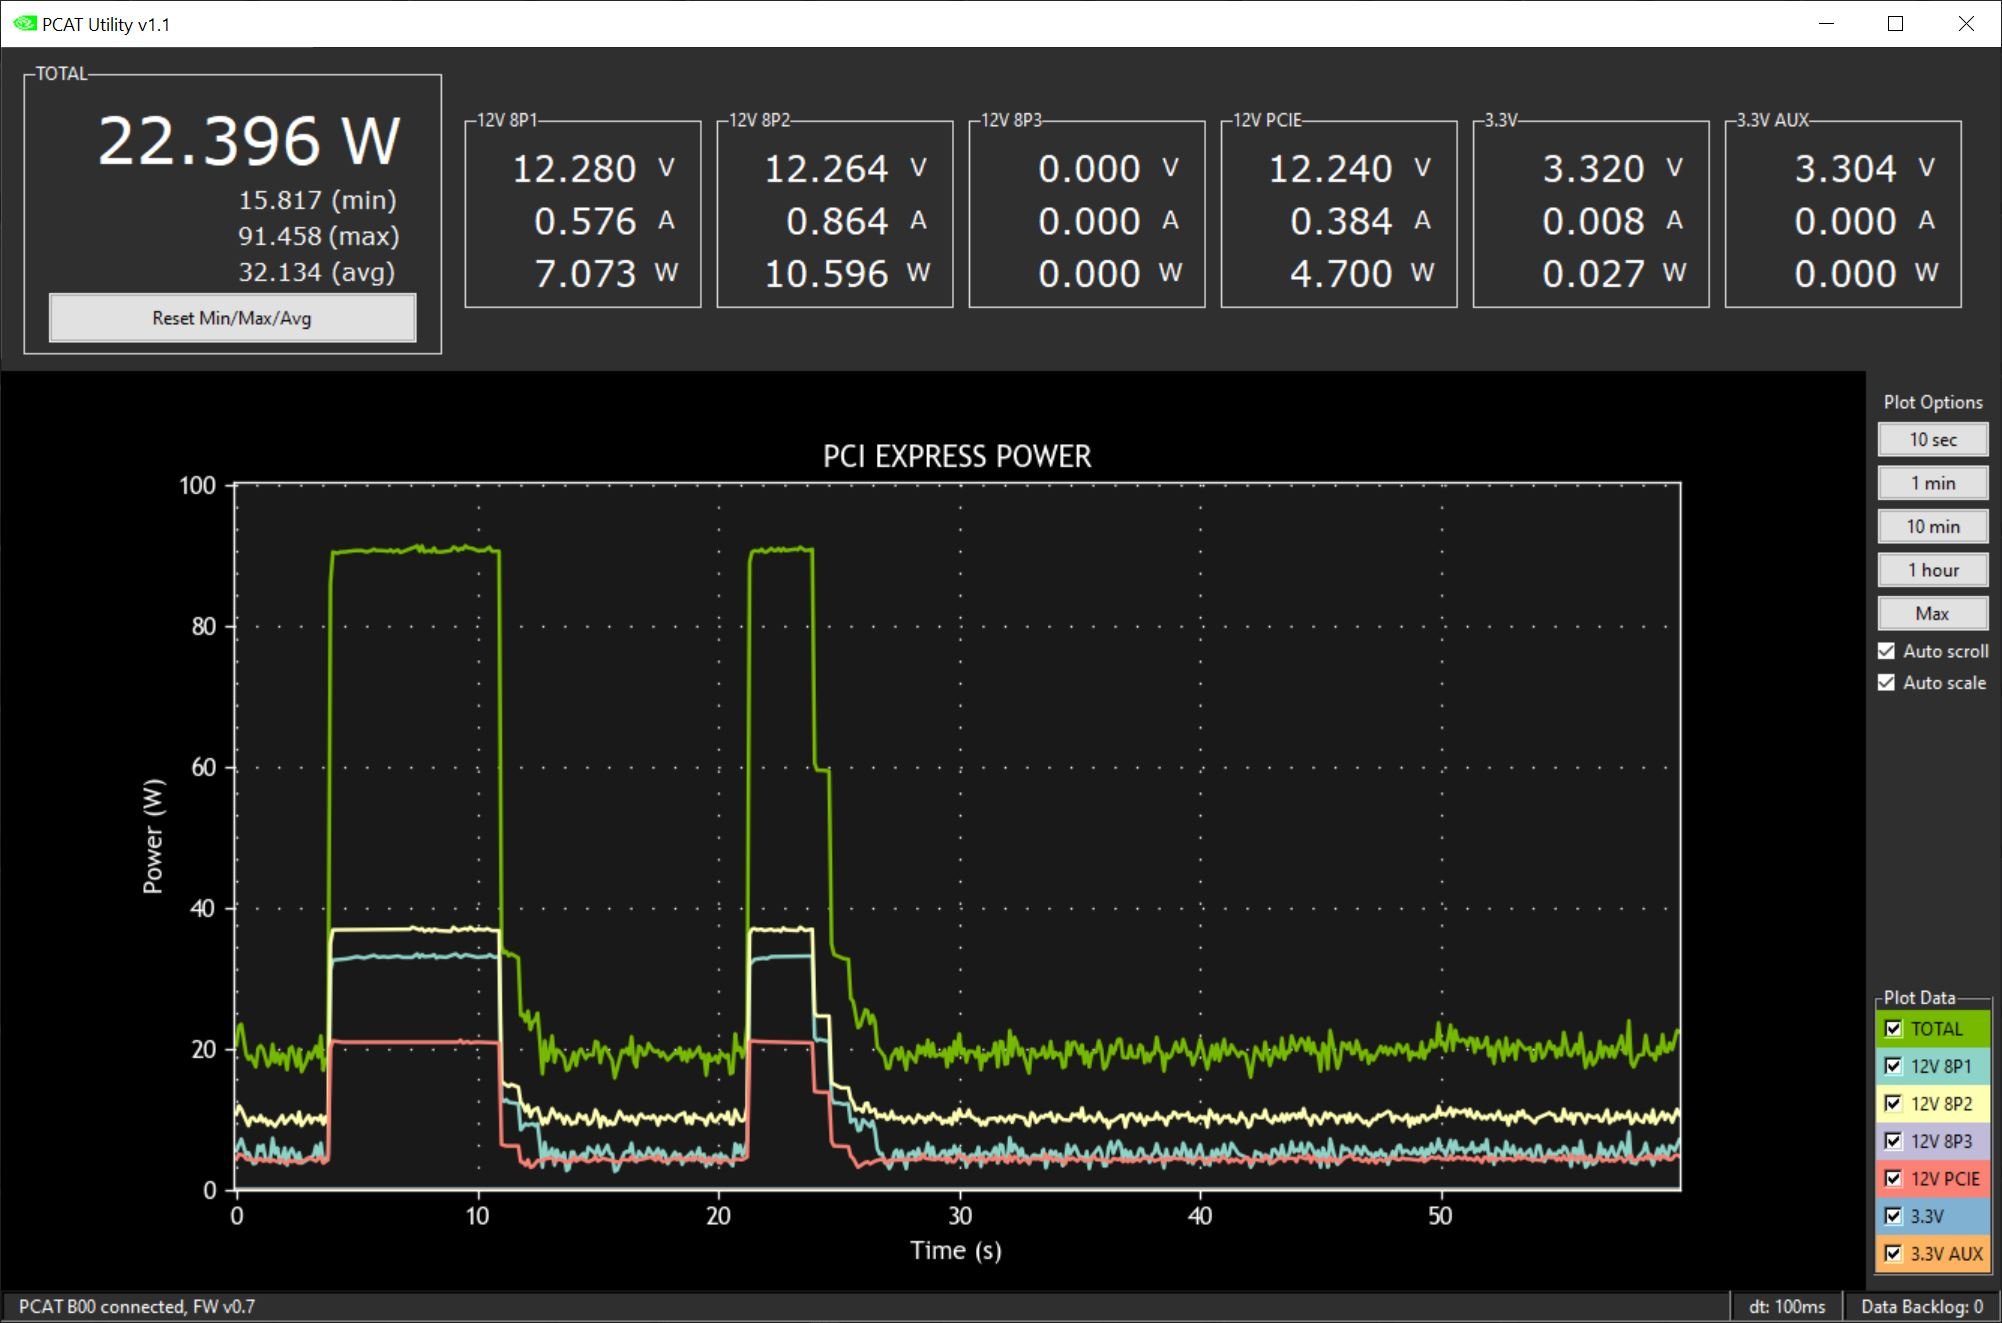
But back to PCAT and what you can do with this new tool. The comfortable and perhaps also financially or technically rather limited tester will actually be happy about such an offer, because PCAT elegantly solves two problems at once. As hardware, it reads out the power consumption of the 12V and 3.3V rails (PCIe and slot) on the graphics card more or less in real time (100 ms) and can also display the whole thing graphically. In addition, there is also an interface API that FrameView accesses in order to log everything chronologically in a single log file. But more on that in a moment. Let’s take a look at what NVIDIA has put in the box first:
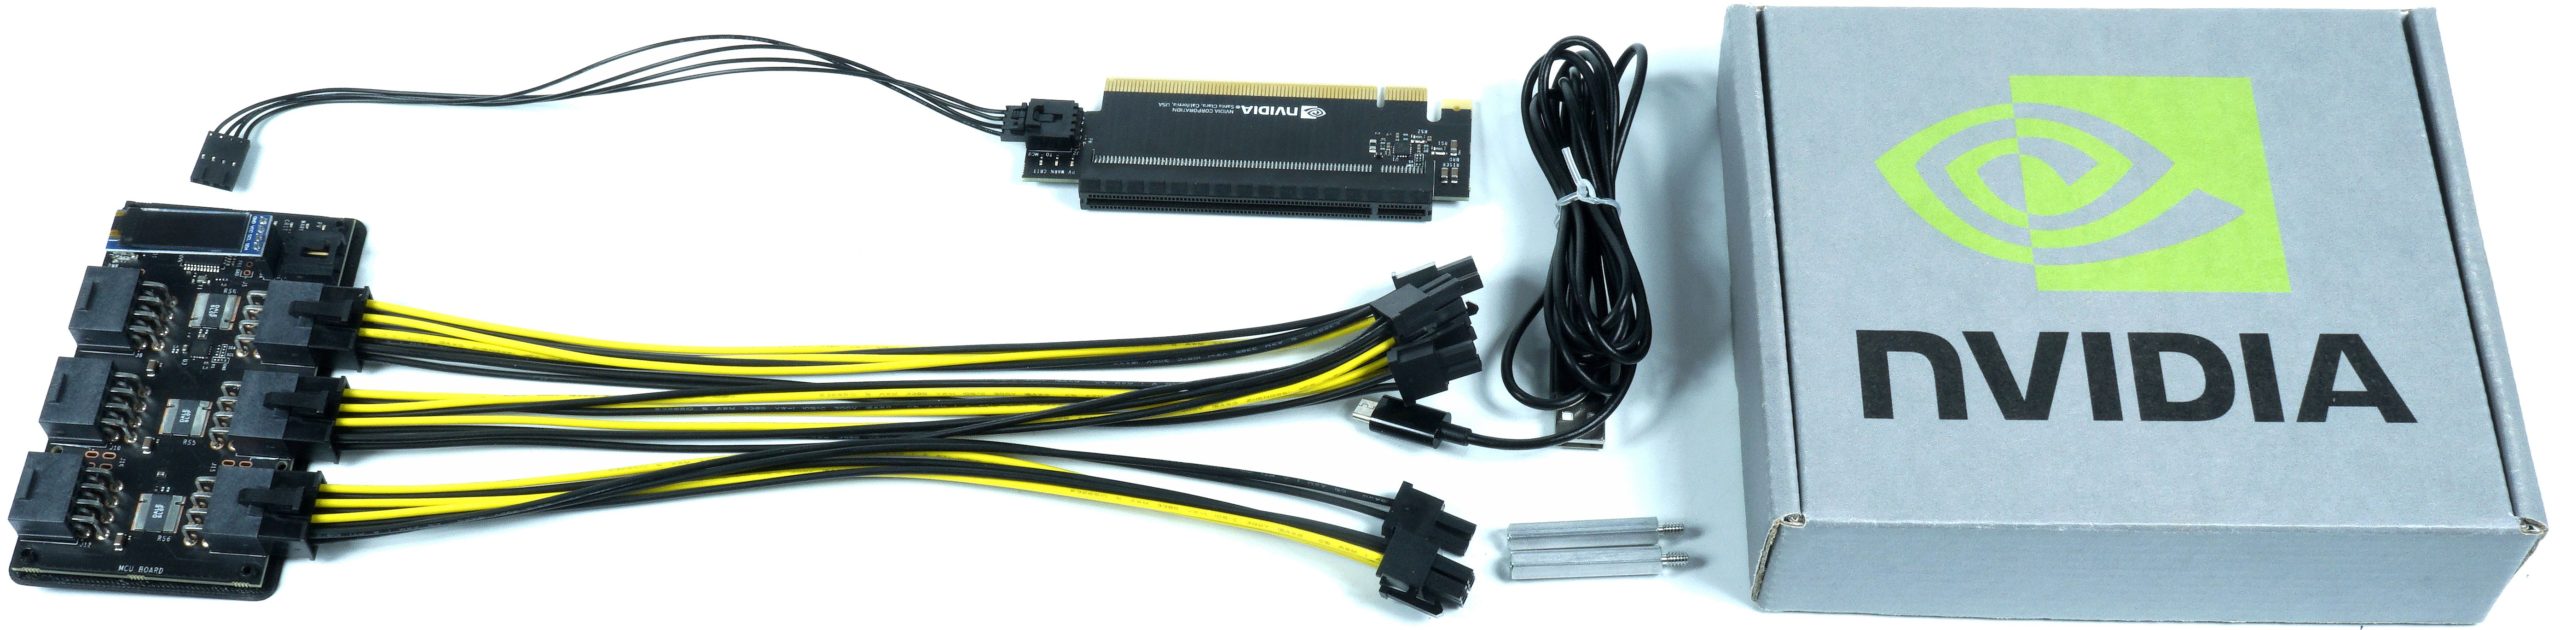
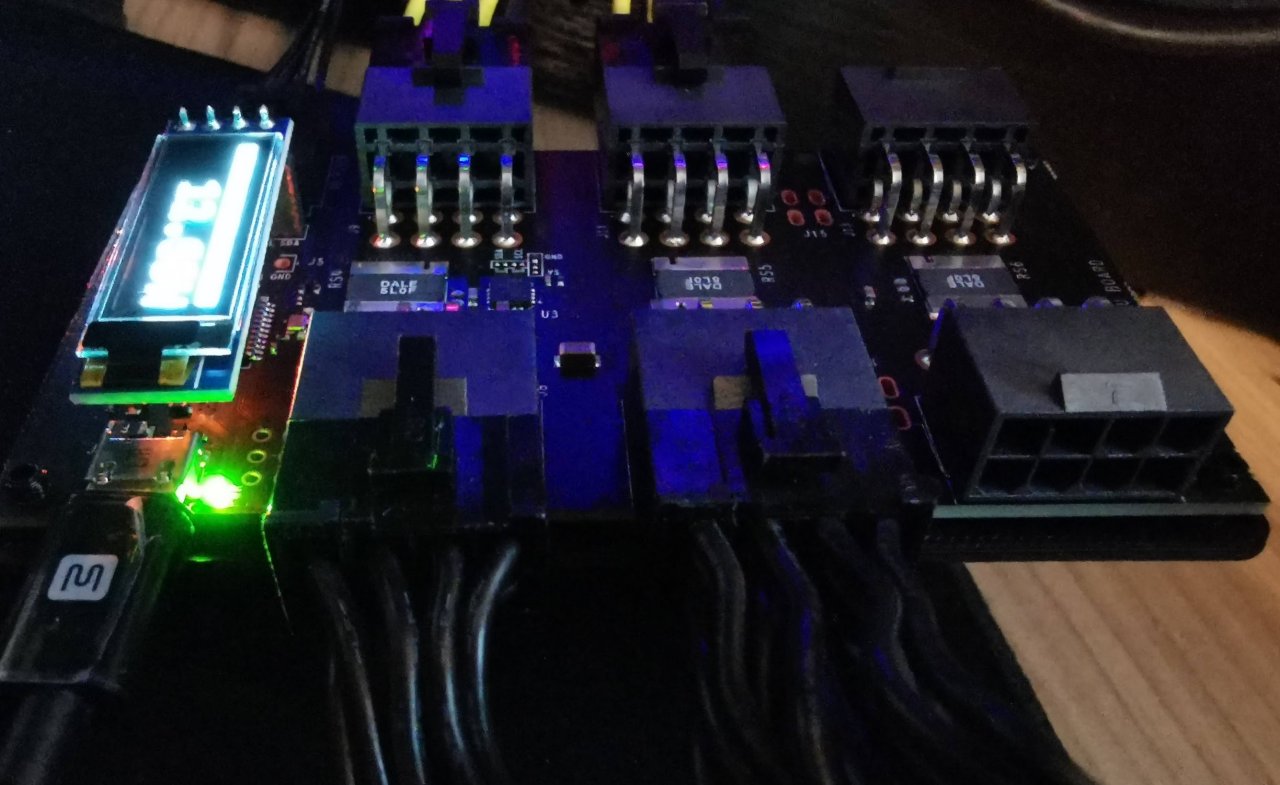
We see the MCU board (Multi Controller Unit) for measuring up to three 6+2 pin connectors (works also with the new FE) including an optional OLED display for “on-the-fly” display, the PCIe-4.0 compatible riser card for direct measurement at the motherboard slot and spacers that help to compensate the height difference of this card to be able to screw the graphics card securely anyway. Let’s take a closer look at the MCU board first.

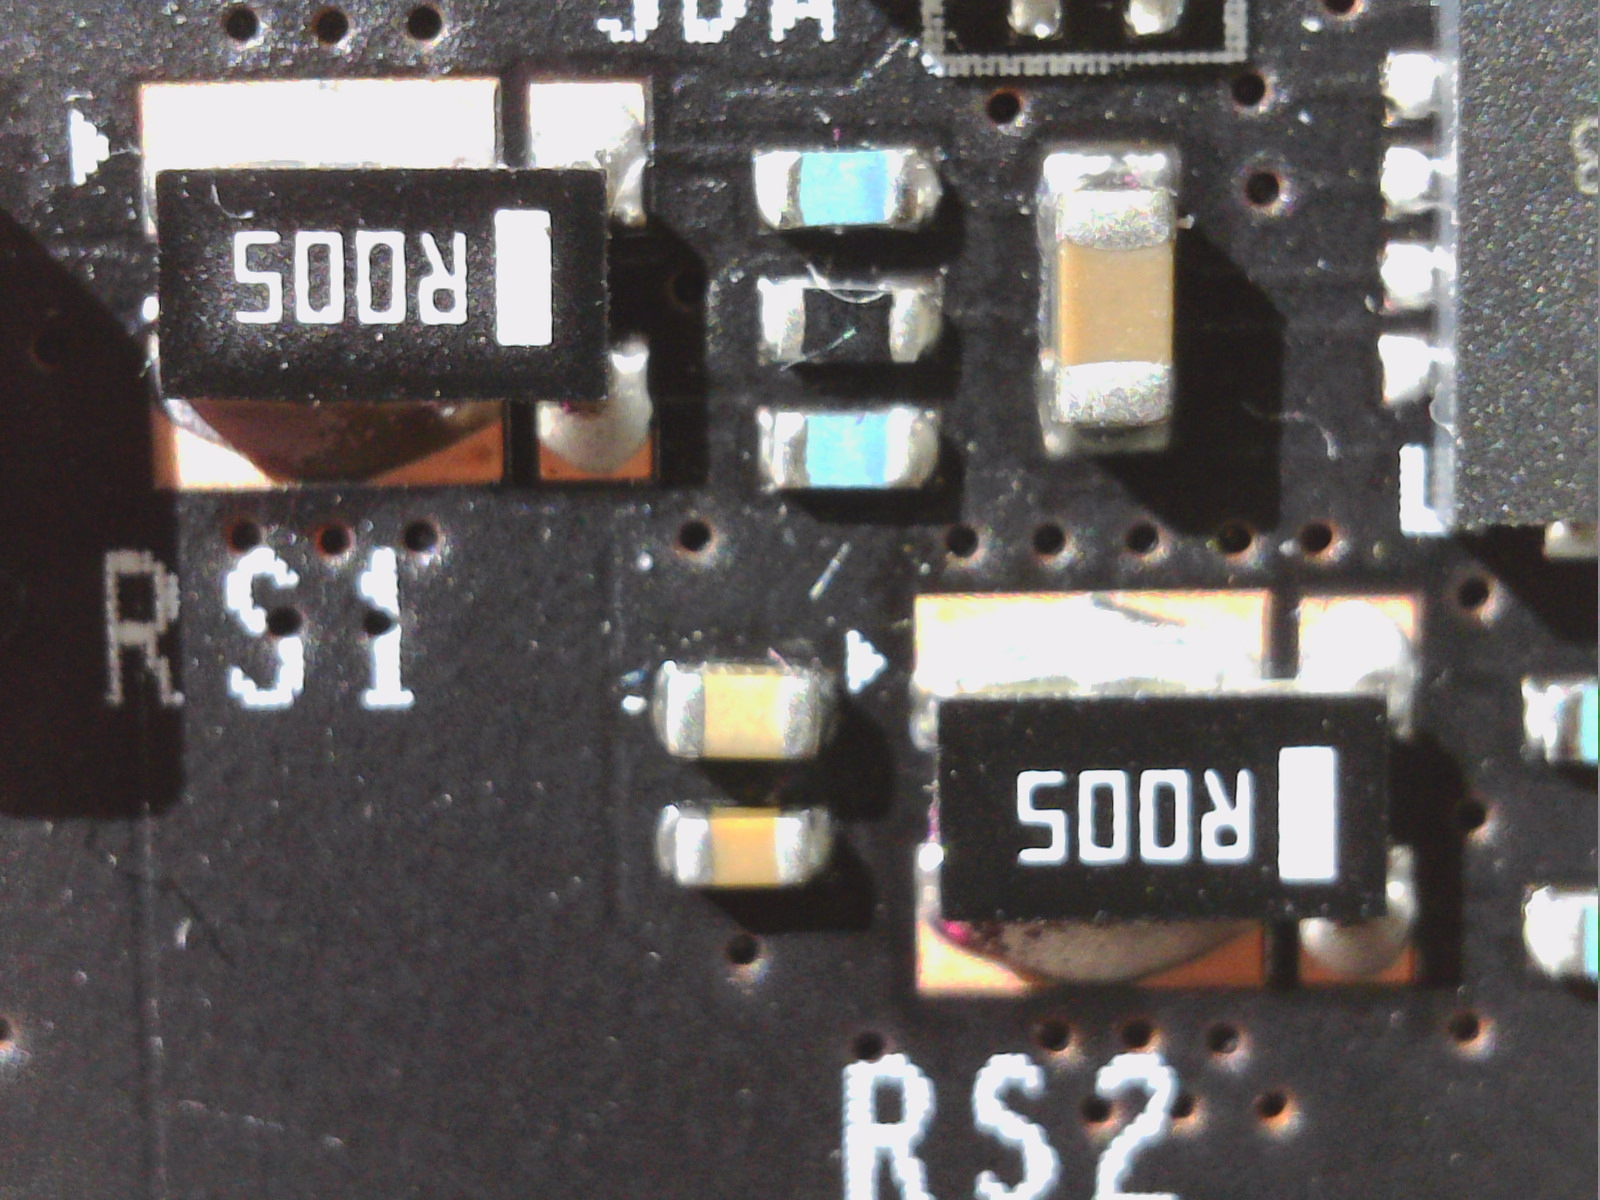
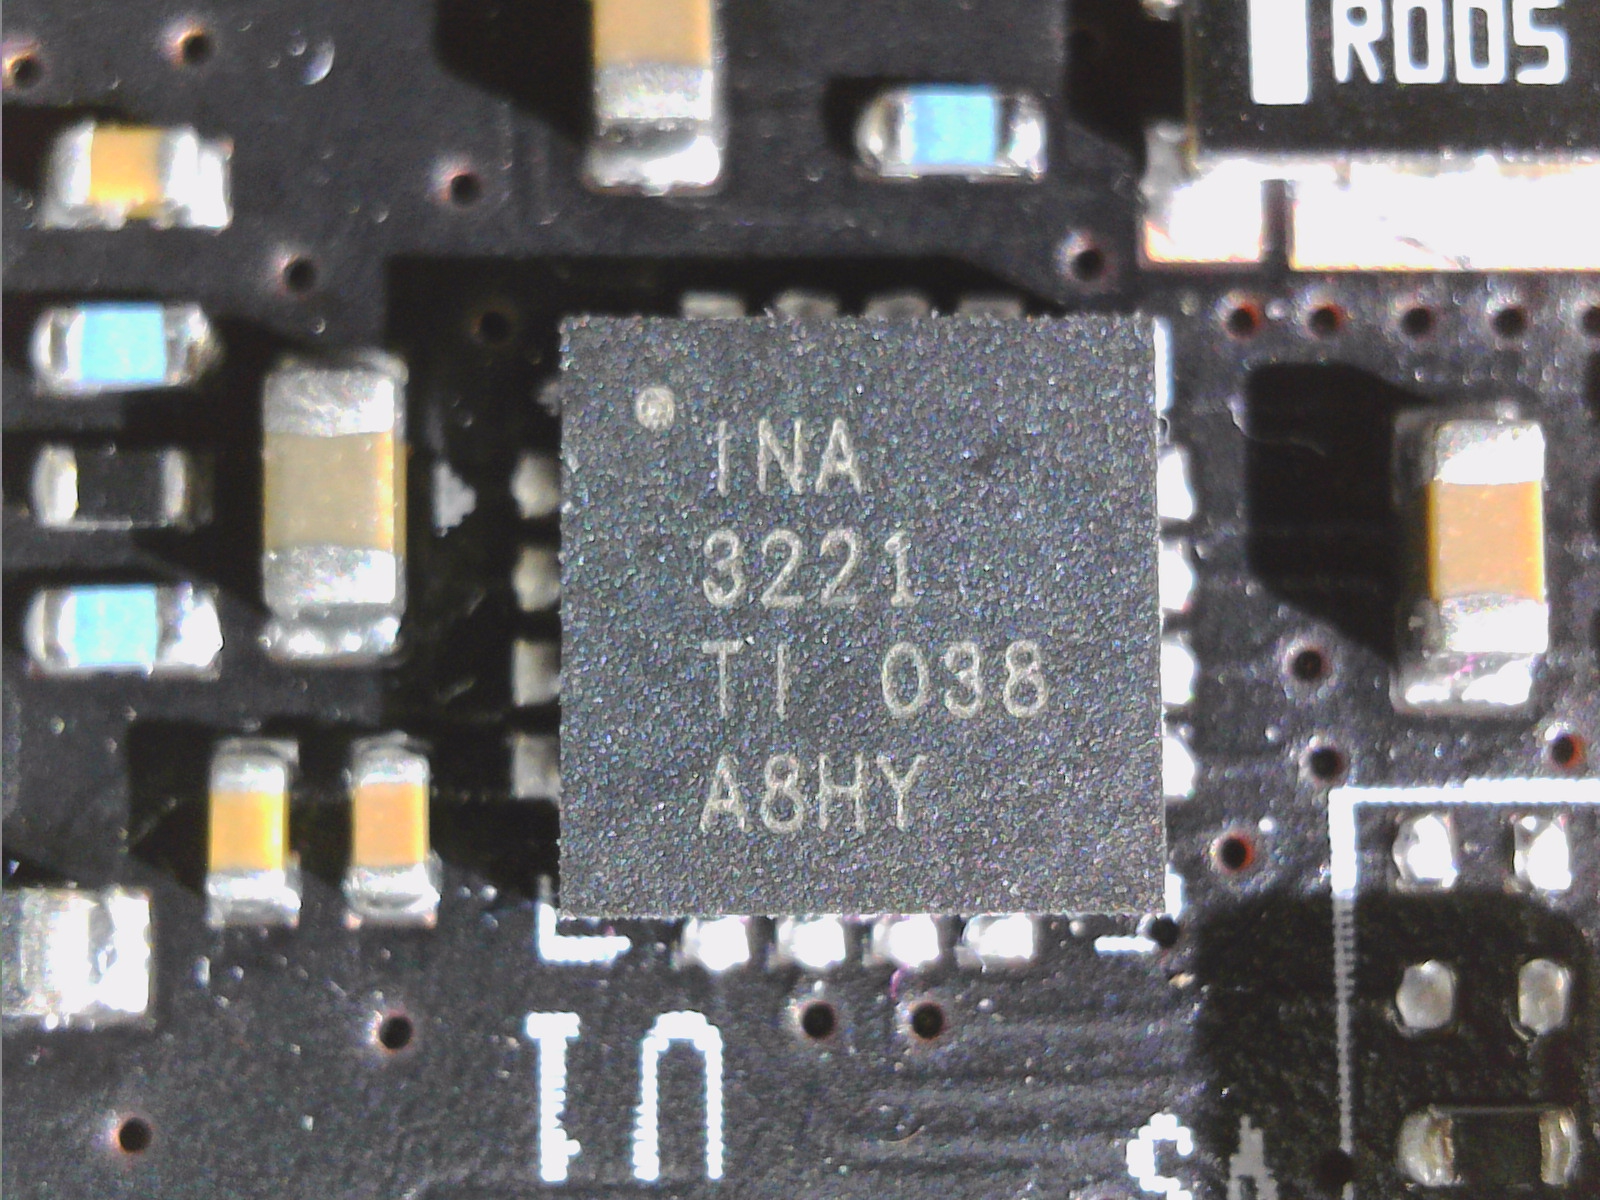
The measuring principle is simple. One simply measures the voltage drop parallel to a very low resistance (shunt), which is located in each individual live rail, in order to be able to deduce the flowing current. In addition, the remaining voltage after the shunt is measured, which automatically gives the power consumption that runs across the respective rail. If you add it all up, you get the total power consumption of the graphics card. This so-called monitoring is provided by the well-known INA3221, which could be found as a monitoring chip on many graphics cards, even though it is now often replaced by a similar chip from On Semi.


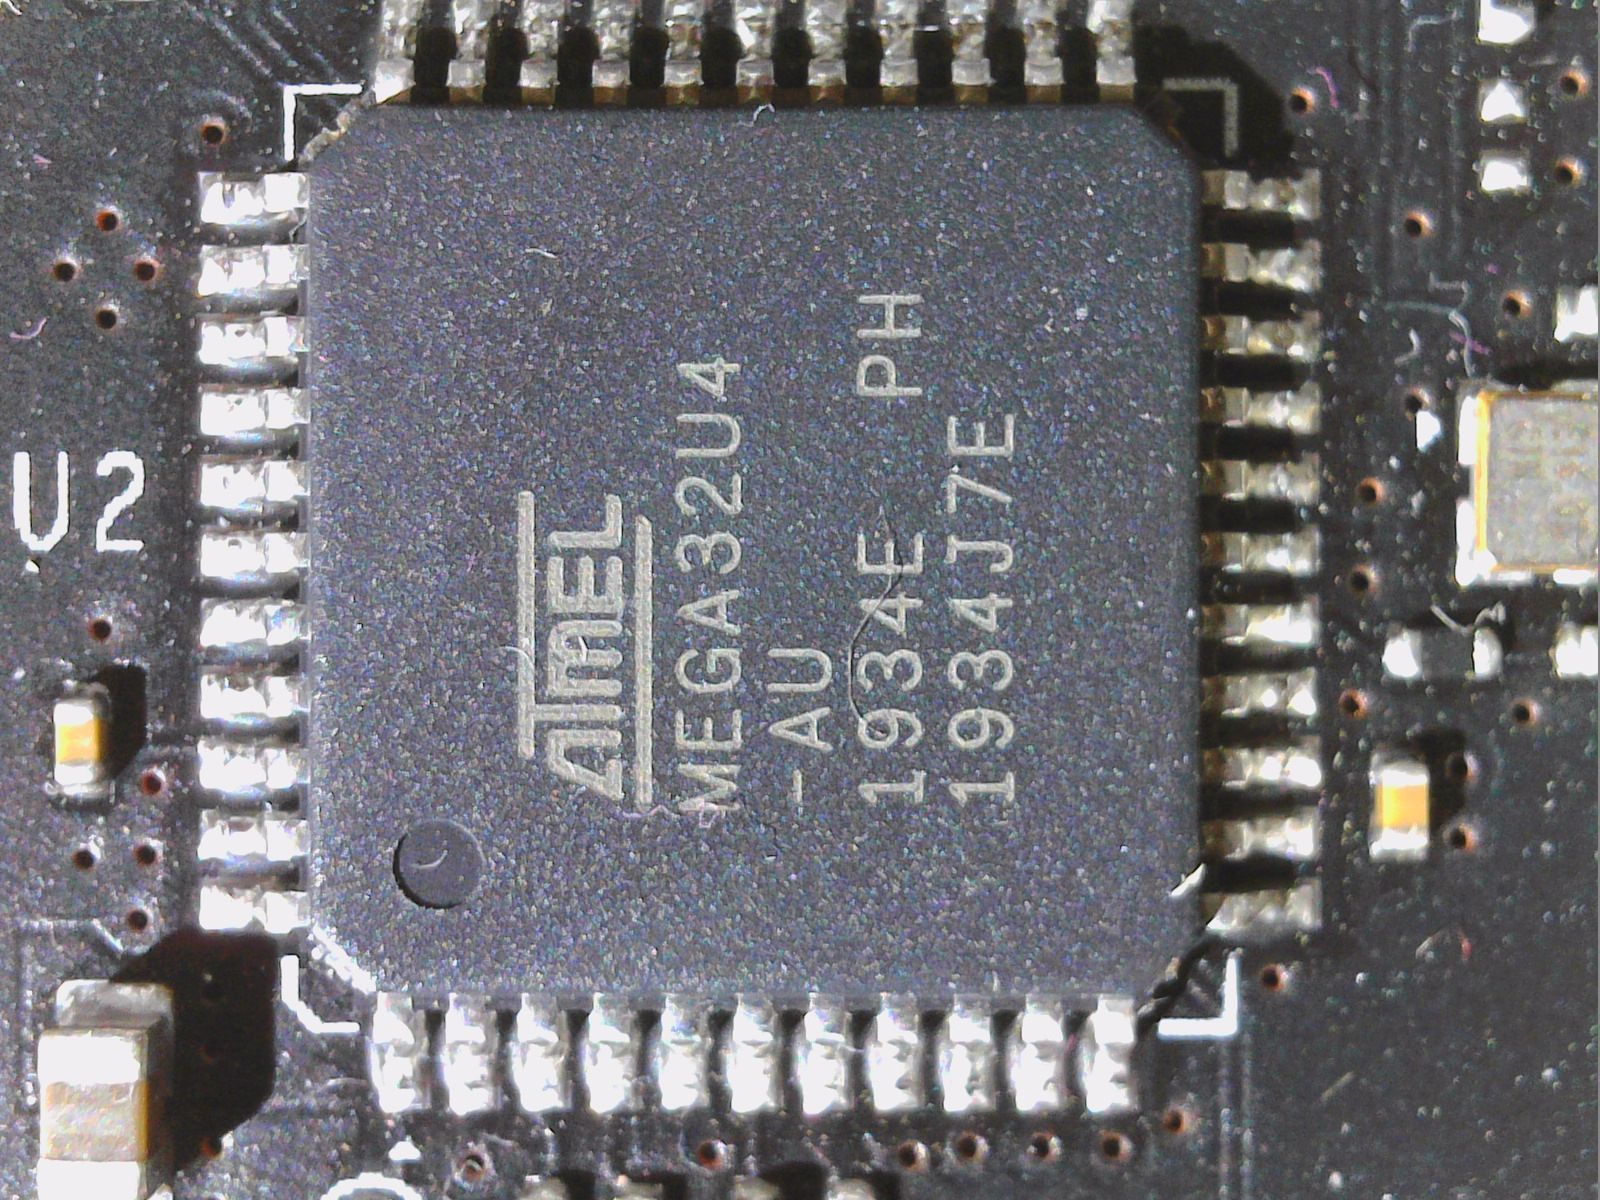
The MEGA32U4 from ATMEL serves as microcontroller. This is the usual low-power 8-bit AVR RISC microcontroller, which has 32 KB of programmable Flash program memory and also includes 2.5 KB SRAM and 1 KB EEPROM, supports USB 2.0 output, has a 12-channel 10-bit A/D converter and supports the JTAG interface. The computing power is about 16 MIPS and 16 MHz. Sounds a bit too much like Arduino? logically, the principle is always the same and very similar, which I also use for all my motherboard tests, which also include the graphics cards.
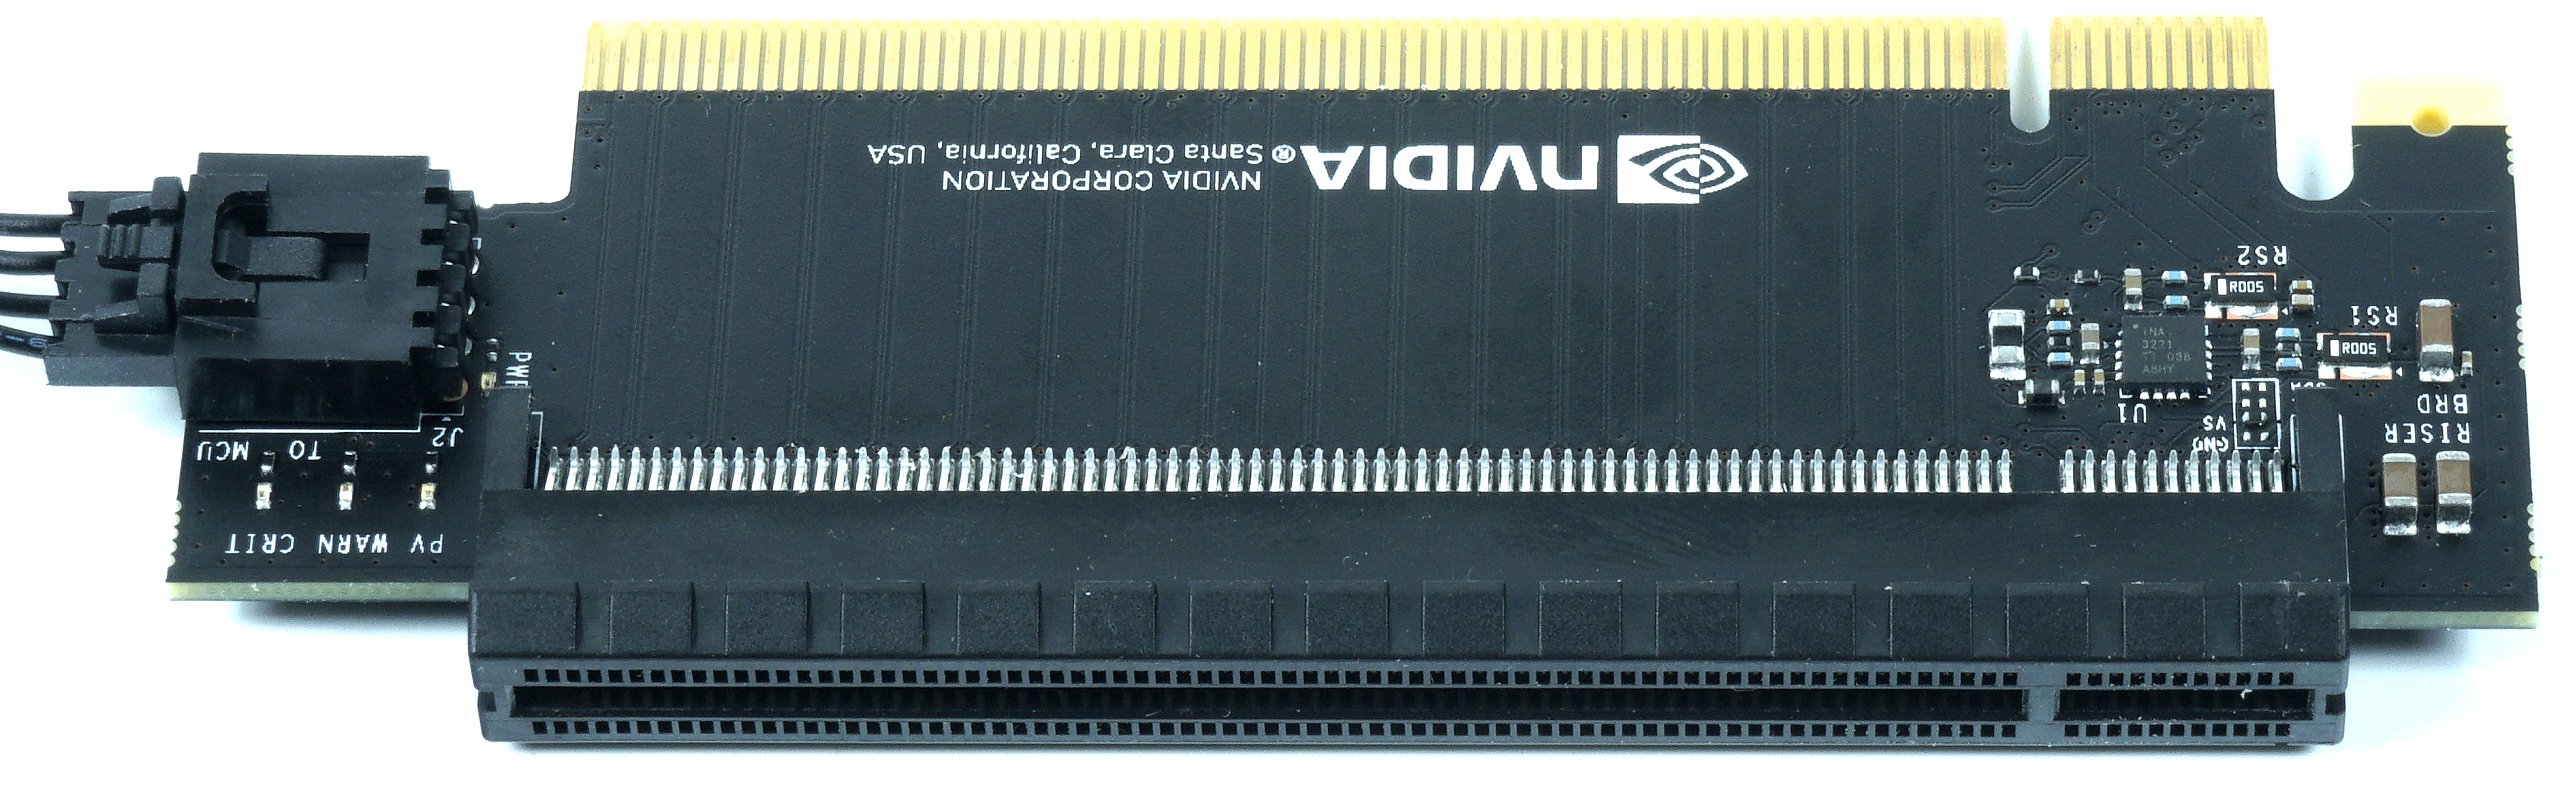
The riser card is knitted similarly in principle, here too an INA3221 is located, which monitors a total of 2 shunts, once for the 12-volt and once for the 3.3-volt rail. The shunts are of course much smaller, because the currents are also lower. Coupling and communication takes place via the already mentioned bus interface.
PCAT – The Software
The software reads out the whole story, i.e. it communicates via USB with the MCU board of the PCAT system. Arduino uses that too, but I switched to Ethernet for smaller intervals. The intervals of 100 ms used by PCAT are quite large, but are completely sufficient for simple acquisition over a longer period of time. A peak load will only be caught by chance, but with a bit of luck it will be possible. But for such analyses PCAT is, as fair as it has to be, simply not thought of. Then you quickly reach mid-five-digit figures, which is probably beyond the scope of most people and therefore not up for debate.
But what the PCAT software can do: it also functions as an API, so that the latest versions of NVIDIA’s FrameView can also access it and read out the relevant data. We will now see on the next page what you can do with it.


Kommentieren