


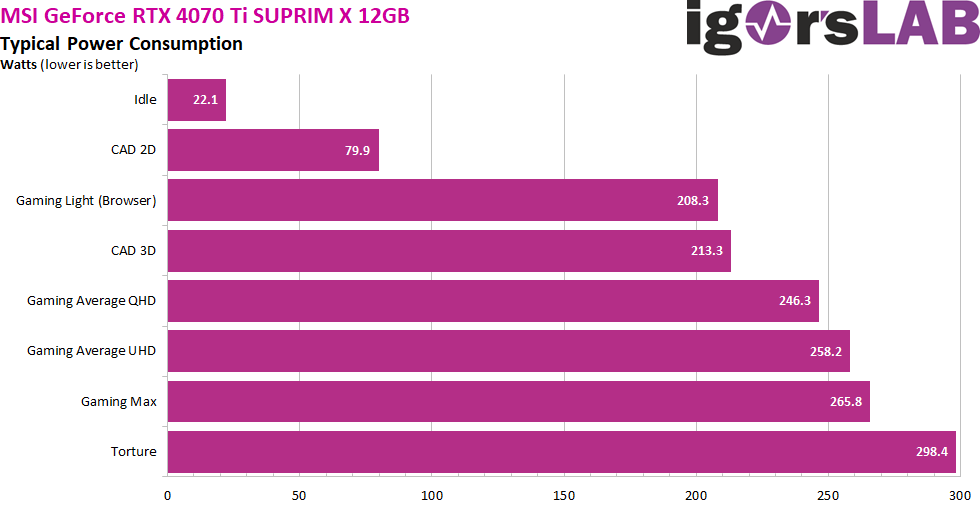
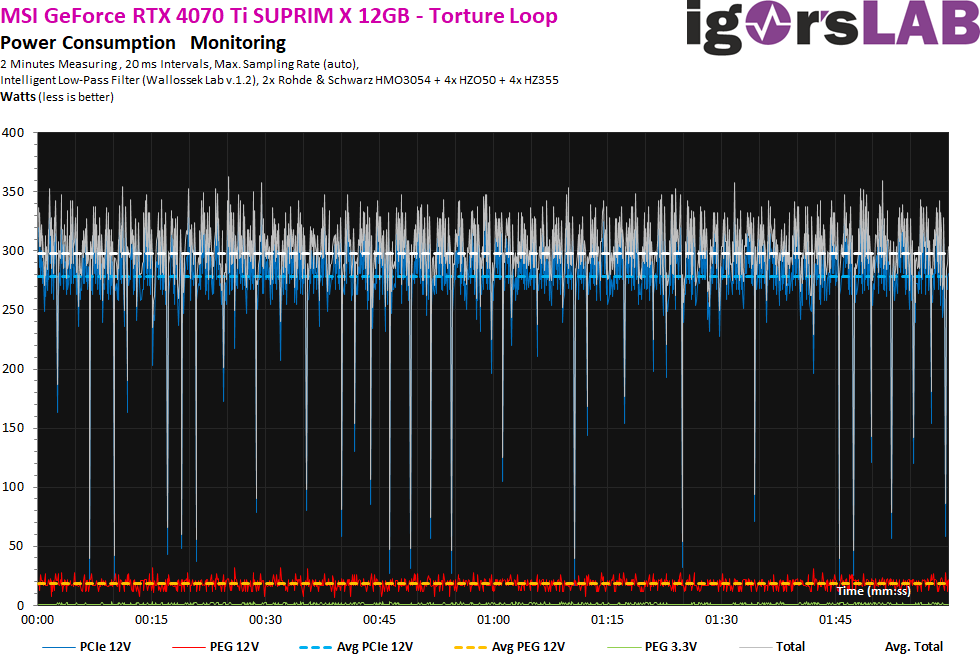
Power consumption in factory state as summary
The 22.1 watts in idle are quite high, whereby it fluctuates between 17 watts and up to 27 watts. With a second monitor and a different resolution, it quickly becomes 35 watts and more. By the way, we can see very well that the full TBP of 285 watts is never exhausted and only the torture loop clearly exceeds the frame because it clearly exceeds the set power limit. This is even more surprising because it gets up to 390 watts when the power limit is set to 128%, i.e. 365 watts. That is insanity in green bags.
Load distribution between PCIe slot and the PCIe sockets
NVIDIA does not share the motherboard for the NVVDD, which is really commendable. That’s why the currents flowing are far below half of what is allowed with a maximum of 5.5 amps.
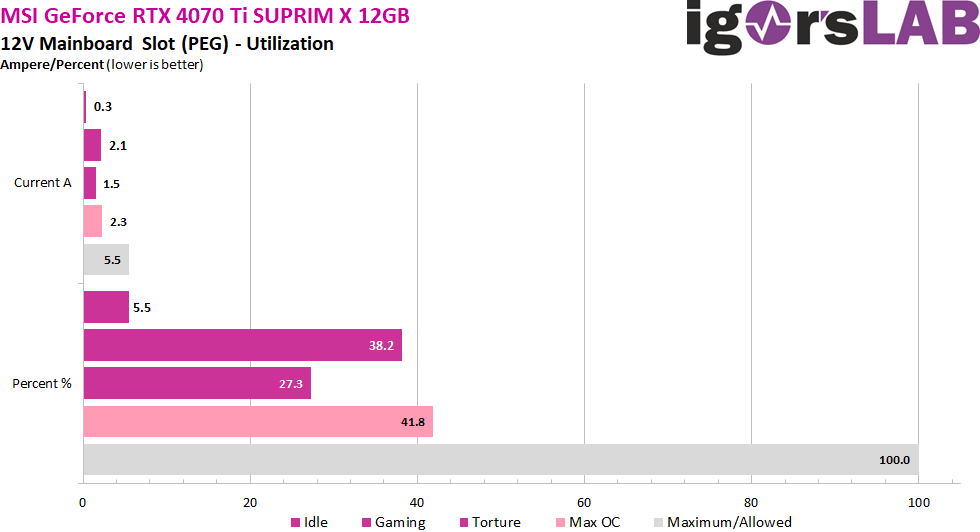
So, while NVIDIA has almost completely stopped supplying via the PEG, AMD continues to use this rail quite excessively.

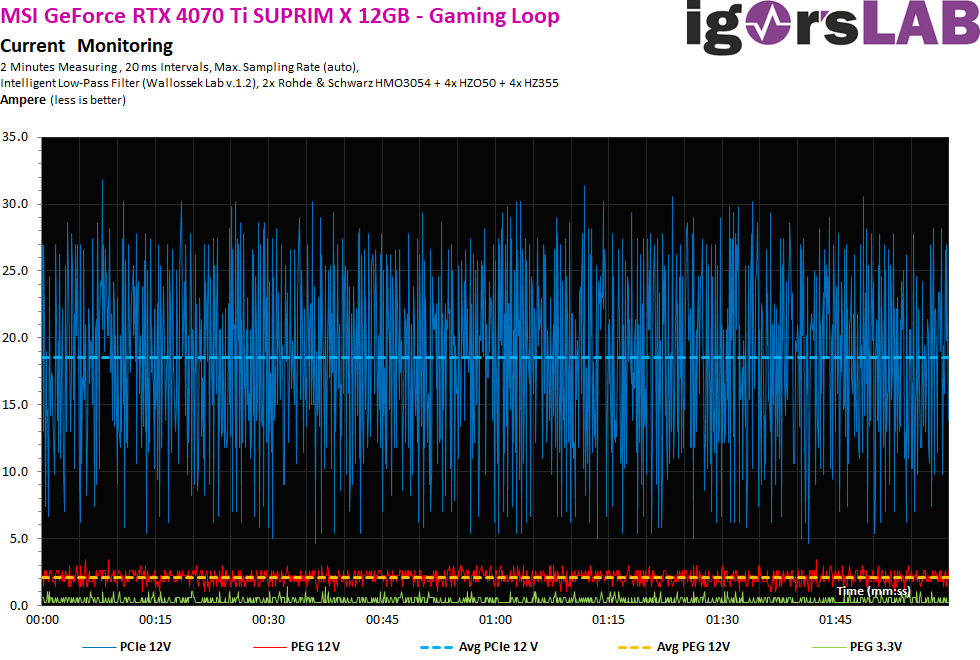
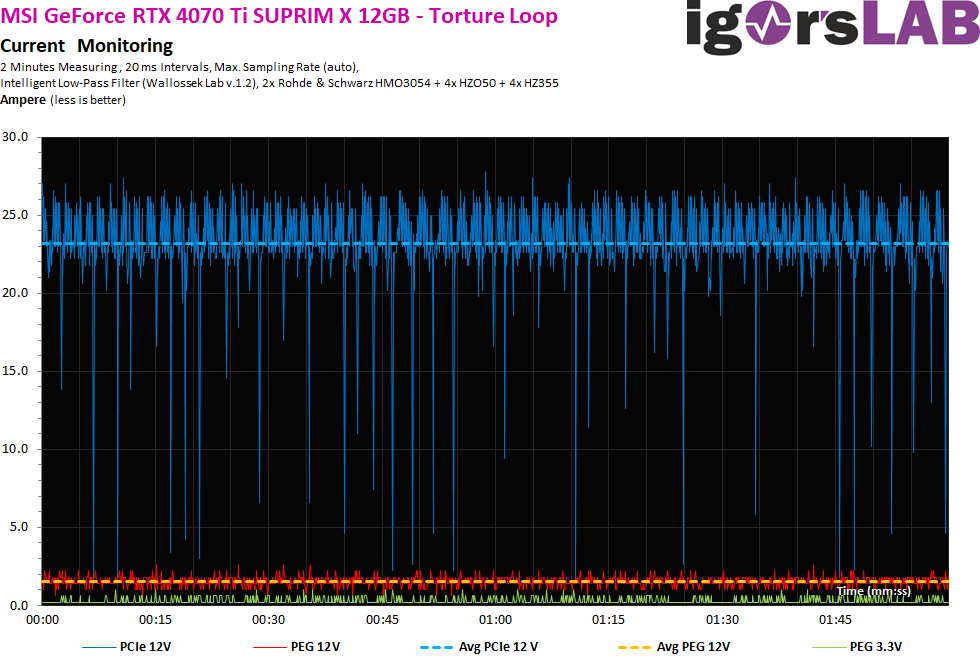
Rough 20 ms intervals
First, let’s take a look at the flowing streams. Measurements were taken at coarser 20-ms intervals, i.e. around 50 times per second, to simulate the load on the supervisor chip of the power supplies (shutdown). We see that even short load peaks are capped at 33 A at the latest. but a real limitation looks different. That is already quite a lot.
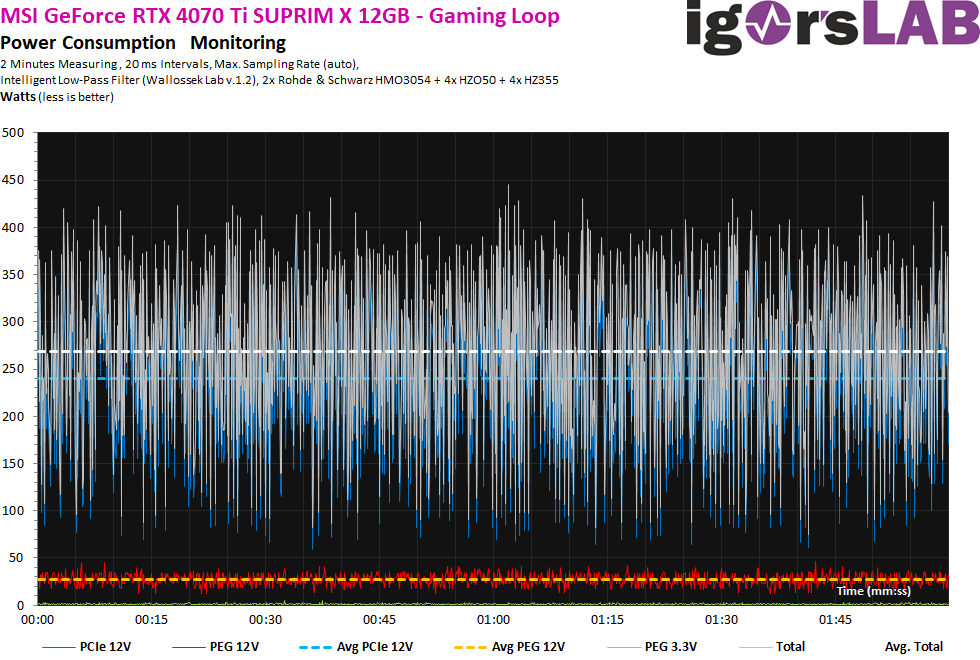
Nevertheless, we still need to take a look at the voltages, or the product of voltage and current flow. I already wrote that I measured here at three different power supply connections, even if all three connections meet again somehow at the end on the board of the graphics card. What we can now see here as much clearer fluctuations and peaks is due to the partial slightly overvolting power supply and thus the voltage and not the currents. This is due to technical reasons, but not a big deal. However, we also see that the few peak at over 450 watts is not due to the current flowing (graphics card), but actually results from the power supply! This is also due to the topology and especially the rather puny input filter with only one coil on the single rail.
It hardly looks different in the Torture test, even though you can see the RX 7900XT’s lower TBP here. But the individual voltage spikes look rather uncool, by the way, on both cards.
If you now add the voltage again, you will see a stronger ripple, which again results from the somewhat jittery operating voltage. However, in the power supply’s honor, it has to be said that this affects all current products of all manufacturers and is certainly hardly avoidable.

- 1 - Introduction, technical data and technology
- 2 - Test system and the igor'sLAB MIFCOM-PC
- 3 - Teardown: PCB and components, cooler
- 4 - Summary: gaming performance WQHD (2560 x 1440)
- 5 - Summary: gaming performance Ultra-HD (3840 x 2160)
- 6 - Detailled metrcis for WQHD (2560 x 1440)
- 7 - Detailled metrcis for Ultra-HD (3840 x 2160)
- 8 - Workstation and rendering
- 9 - Details: Power consumption and load sharing
- 10 - Load peaks, capping and PSU recommendation
- 11 - Temperatures, clock rates and infrared analysis
- 12 - Fan curves and noise with audio sample
- 13 - Summary and conclusion


139 Antworten
Kommentar
Lade neue Kommentare
Veteran
Mitglied
Urgestein
Neuling
Mitglied
Neuling
Veteran
Veteran
Mitglied
Urgestein
Urgestein
Mitglied
Urgestein
Veteran
Urgestein
Mitglied
Mitglied
Veteran
Veteran
Alle Kommentare lesen unter igor´sLAB Community →