


Important preliminary remark
We’ll do things a bit differently with the benchmarks today, as we did with the Radeon RX 7900 XT(X), because the peculiarities of the respective architectures quickly blur in the sum of all games. In the end, there are only 10 specially selected games, but I chose them as examples from over 20 titles and the pre-tests with two cards, because the result was almost exactly the same in the end. The weighting between the titles with pure raster graphics without DXR and with DXR was done in a ratio of 6:4, with the four DXR titles being very different. Full ray tracing fun in Cyberpunk 2077, combined with more mid-range effects like in Metro Exodus EE and the hybrid implementation of lighting all the way to Marvel’s Guardians of the Galaxy and Shadow of the Tomb Raider, where ray tracing really only comes into play humanely.
DXR is being implemented in more and more games and the current engines almost all allow it by now. From this point of view, it would be just as unfair to completely abandon such titles as it would be to use them exclusively with DXR. Since every user has different preferences and some prefer to do without DXR completely (why actually?), I accommodate all target groups a bit for once. Today’s summary is thus in three parts. Once only pure raster graphics, once only games with DXR and at the end the average of all games. I did that for WQHD and Ultra HD, because the faster cards would have mercilessly run into CPU bottleneck in Full HD. Who wants to admire many beams of almost the same length?
The tested Radeon RX 6950XT (with a significantly higher TBP) is a factory overclocked board partner card together with the MSI RTX 4070 Ti SUPRIM X 12 GB (which, however, adheres to the reference TBP), which makes the comparison to the reference cards a bit more difficult. However, unfortunately, nothing else was to be found. I have then summarized all the individual benchmarks on two additional pages in galleries, because transparency must of course be, also with regard to all the interesting metrics.
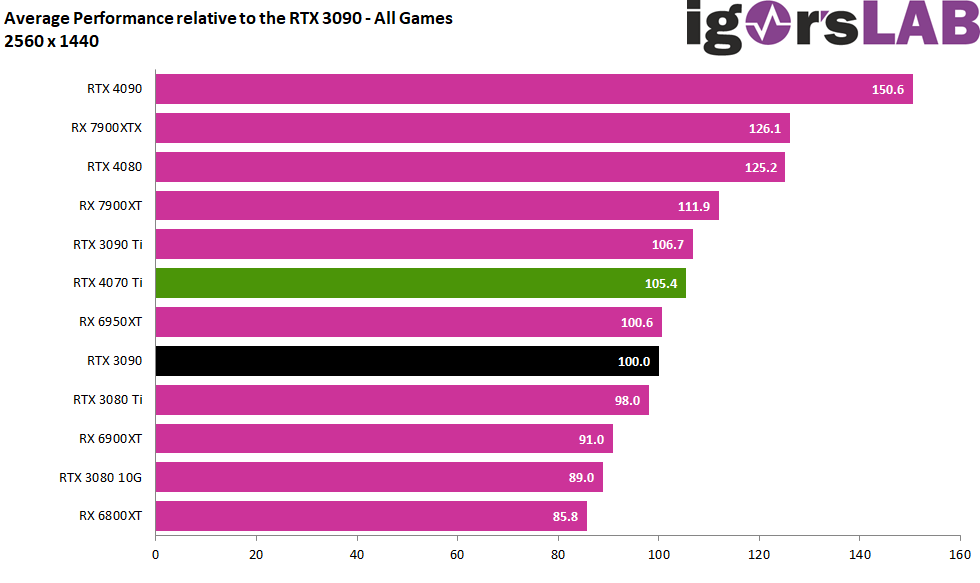
Sum of all games with and without ray tracing
The Radeon RTX 4070 Ti is 5.4 percentage points ahead of the GeForce RTX 3090 FE here, but almost 20 percentage points behind the RTX 4080 FE, which in turn is 3.4 percentage points ahead of the Radeon RX 7900XT. The gap to the Radeon RX 7900XT is 6.4 percentage points. Interestingly, the RTX 4070 Ti in WQHD is only 1.3 percentage points behind an RTX 3090 Ti and a whopping 7.4 percentage points ahead of the RTX 3080 Ti.
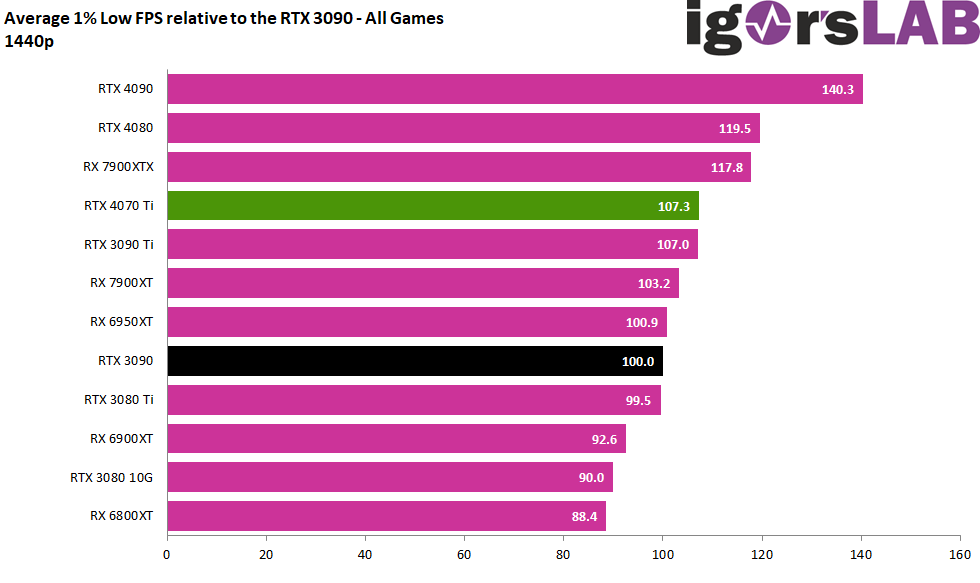
Now let’s look at the Min-FPS, which is the one percent of the slowest rendered frames (P1 Low). Here, the RTX 4070 Ti is more than 7 percentage points ahead of the RTX 3090, almost on par with the RTX 3090 Ti and only more than 12 percentage points behind the RTX 4080 FE. And sometimes it even manages to be 4 percentage points ahead of an RX 7900XT. Amazing all the same.
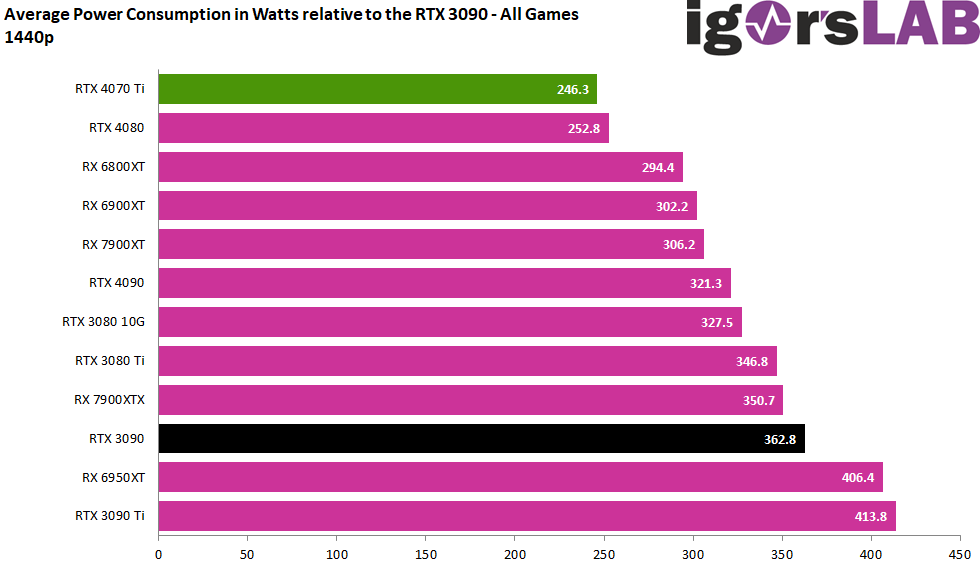
Even though I will have a very detailed chapter on power consumption and load peaks later (be sure to read it!), I also logged the power consumption over every benchmark for this game selection as always and also cumulated it at the end, so that a very clear picture already emerges here. The GeForce RTX 4070 Ti is uncatchably ahead, while the RX 7900XT allows itself almost 60 watts more! These are really worlds apart. But it is not that much less compared to the much faster RTX 4080, which is a bit surprising.
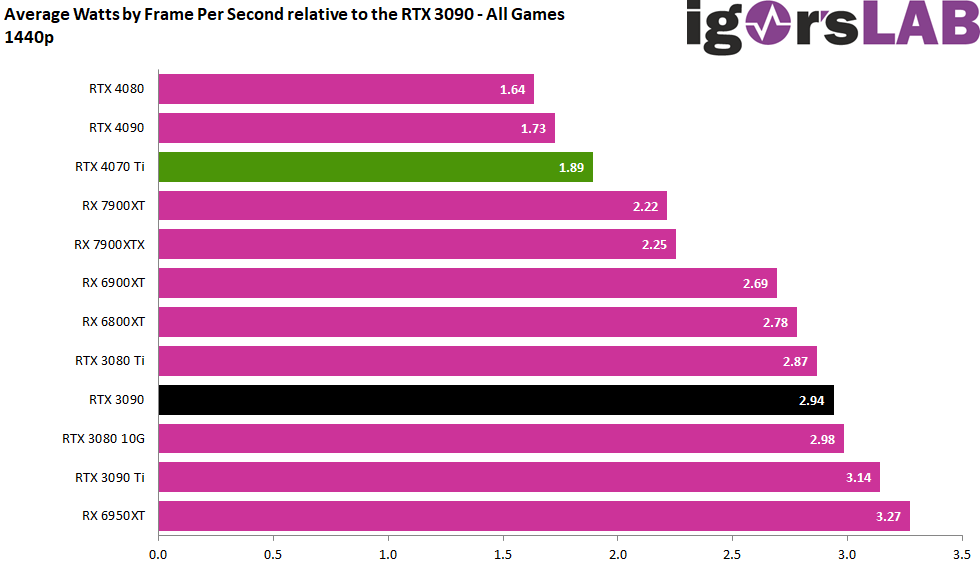
If we now look at the resulting efficiency, we see that it is only between an RTX 4090 and the RX 7900XT, while the RTX 4080 remains the unbeaten front-runner. Smaller chip, but more thirst? The somewhat higher TBP is certainly also due to the fact that the board partners wanted to have more leeway for cheaper voltage converters, because there are definitely more losses at this point.

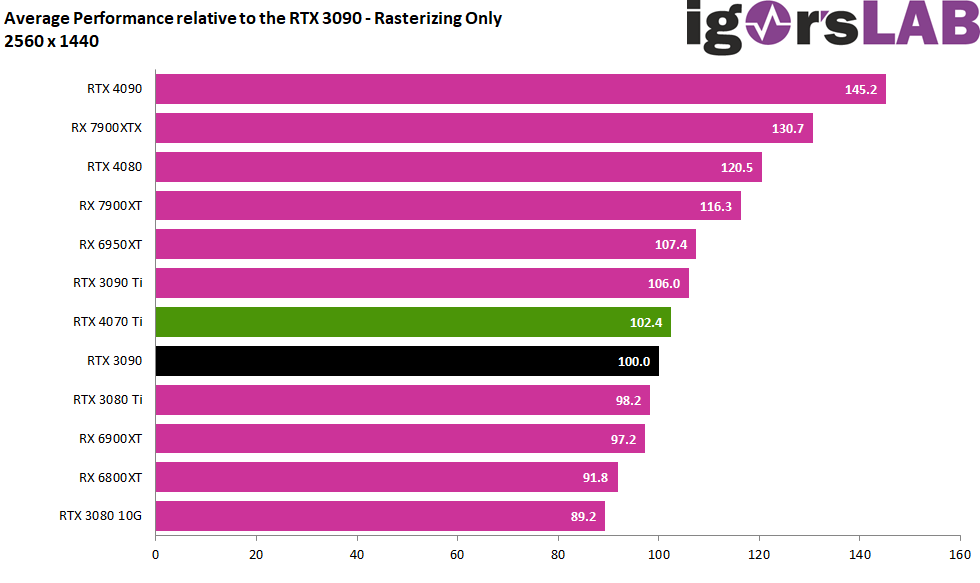
Sum of all games with simple raster graphics (RT Off)
Let’s now turn things around and only evaluate the games where ray tracing is not used. The GeForce RTX 4070 overtakes the RTX 3090 by a whole 2.4 percentage points, after all. However, the RTX 3090 Ti is now 3.6 percentage points ahead, and the RTX 4080 is again a good 20 percentage points ahead, while the Radeon RX 7900XT is still a very clear 14.1 percentage points ahead. The RTX 3080 Ti is 4.2 percentage points behind the RTX 4070 Ti.
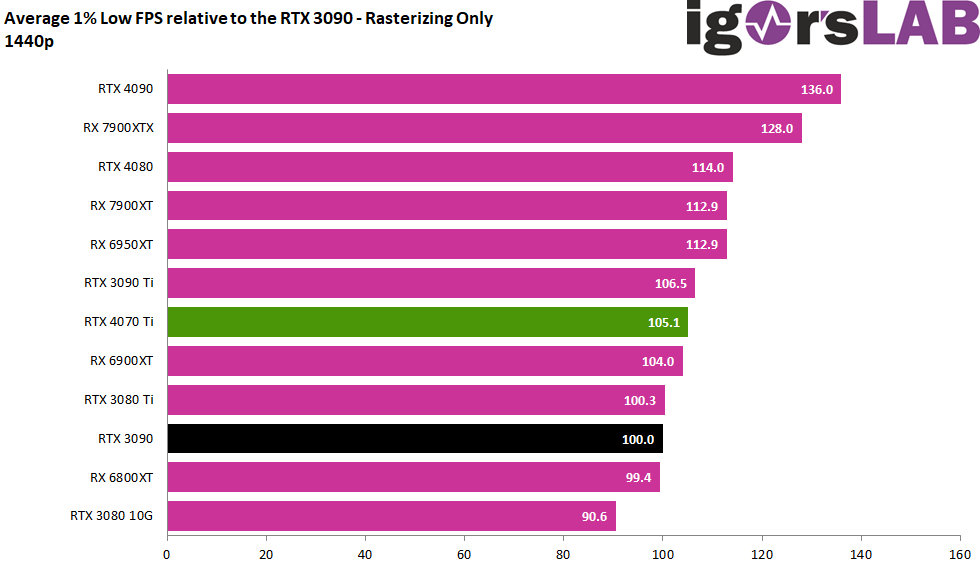
However, average FPS are unfortunately not everything here either. In the P1 Low, the RTX 4070 Ti is still a good 5 percentage points ahead of the RTX 3090 and the RTX 3080 Ti, but a bit more than one behind the RTX 3090 Ti. The RTX 4080 is almost 9 percentage points ahead of the RTX 4070 Ti.
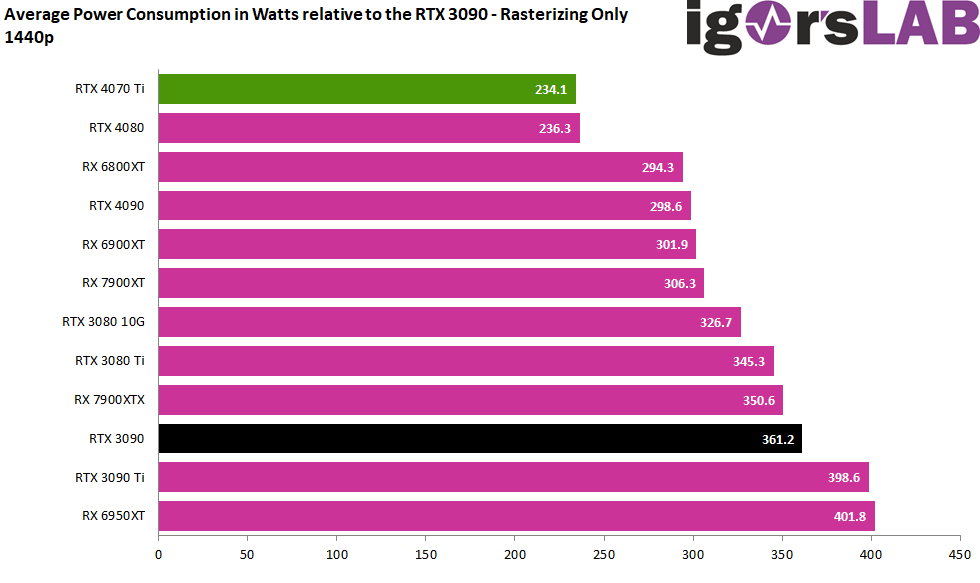
And what happens to the power consumption now? The RTX 4070 Ti is significantly slower than the RTX 4080 Fe, but it is almost on par in terms of power consumption. Good, but not top.
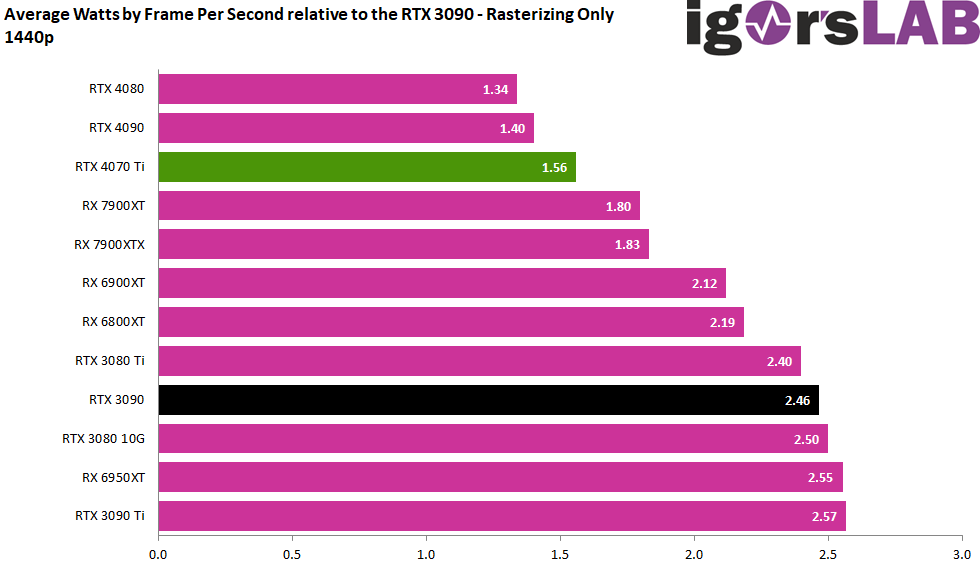
The efficiency is then the result of this tie and nothing changes in the known order either.

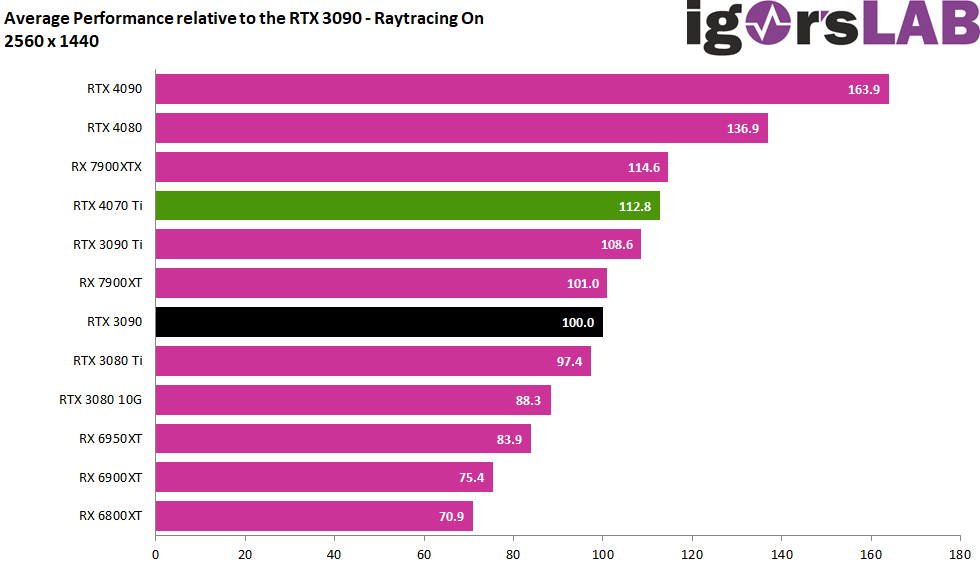
Sum of all games with ray tracing (RT On)
For the third evaluation I use all games with DXR / Raytracing. This certainly represents the new everyday life, where the number of games without DXR still predominates, but people usually don’t want to do without it anymore. The picture now looks like that the RTX 3090 can be beaten by almost 13 percentage points and even the RTX 3080 Ti is still a good four percentage points behind, while the RX 7900XTX is only missed by 1.8 percentage points and the RX 7900XT can even be outclassed by 11.8 percentage points.
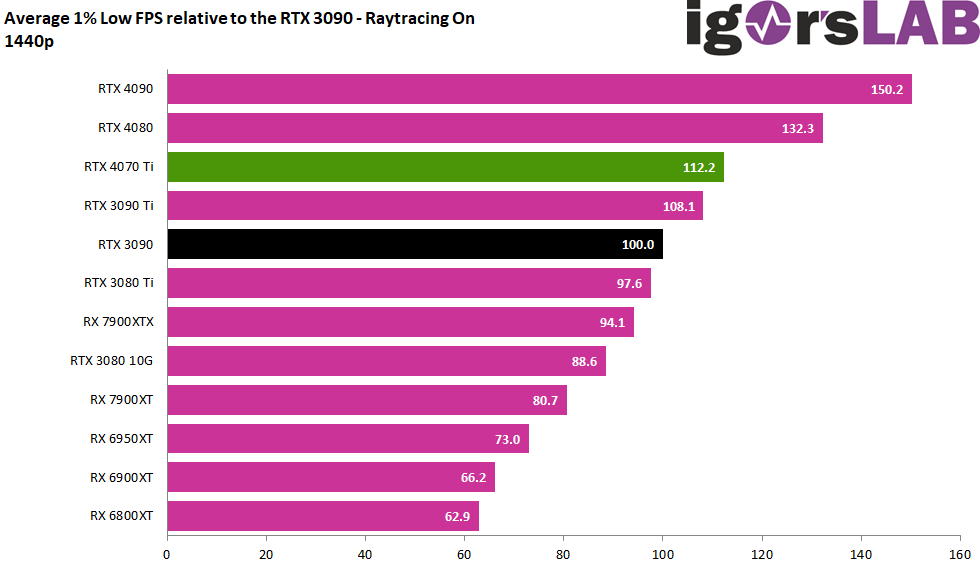
The P1 Low again sees the RTX 4070 Ti ahead of an RTX 3090 Ti, while the RTX 4080 manages to escape by the known 20 percentage points. The Radeons only play a supporting role here, unfortunately.
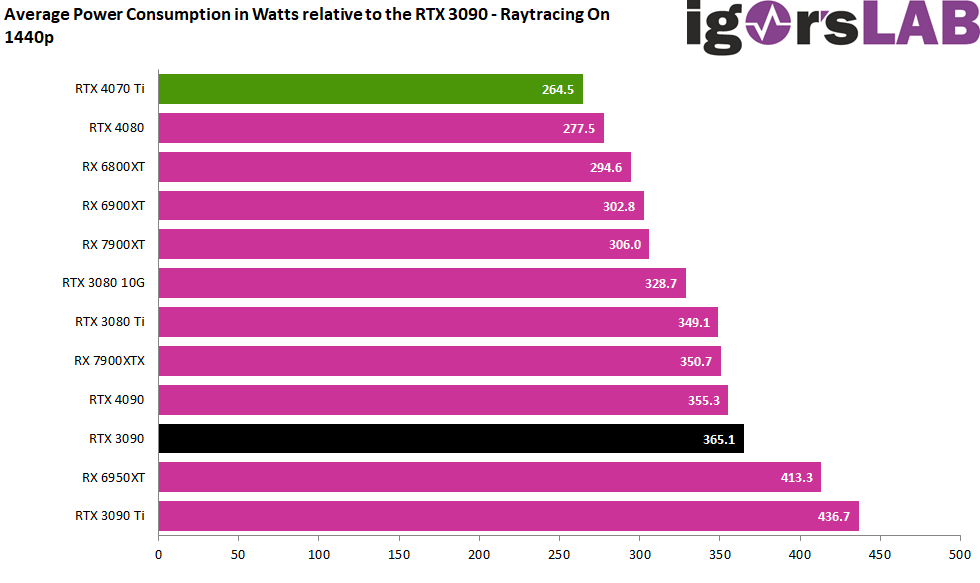
But what about the power consumption? The RTX 4070 Ti is now 13 watts below the RTX 4080 and is again the most frugal card in the test field.
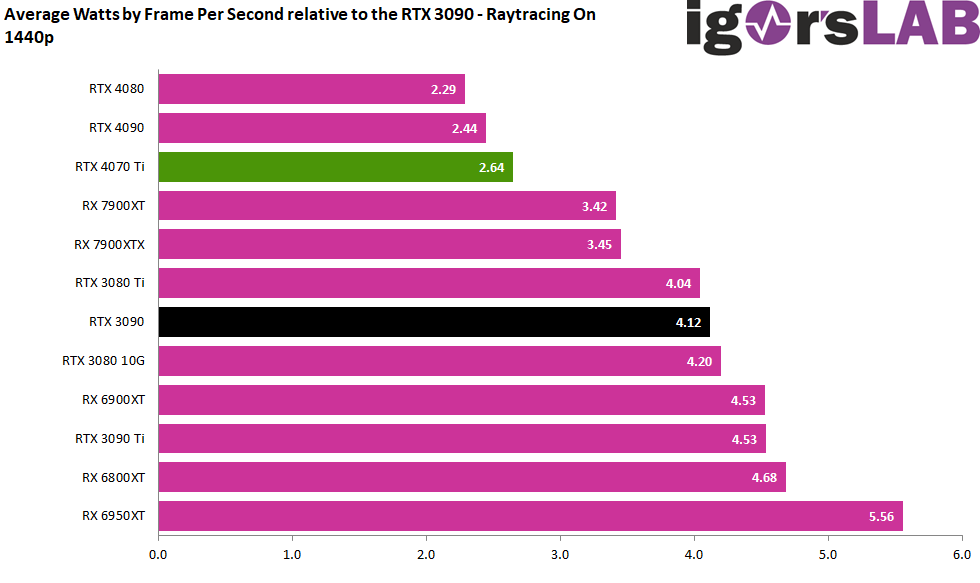
This is again reflected in the efficiency, which I also calculated for the sake of completeness, whereby the lead over the Radeons is much bigger than in pure raster graphics.
That brings us to the end of WQHD and we want to see if anything changes in Ultra HD. Please turn the page once!

- 1 - Introduction, technical data and technology
- 2 - Test system and the igor'sLAB MIFCOM-PC
- 3 - Teardown: PCB and components, cooler
- 4 - Summary: gaming performance WQHD (2560 x 1440)
- 5 - Summary: gaming performance Ultra-HD (3840 x 2160)
- 6 - Detailled metrcis for WQHD (2560 x 1440)
- 7 - Detailled metrcis for Ultra-HD (3840 x 2160)
- 8 - Workstation and rendering
- 9 - Details: Power consumption and load sharing
- 10 - Load peaks, capping and PSU recommendation
- 11 - Temperatures, clock rates and infrared analysis
- 12 - Fan curves and noise with audio sample
- 13 - Summary and conclusion


139 Antworten
Kommentar
Lade neue Kommentare
Veteran
Mitglied
Urgestein
Neuling
Mitglied
Neuling
Veteran
Veteran
Mitglied
Urgestein
Urgestein
Mitglied
Urgestein
Veteran
Urgestein
Mitglied
Mitglied
Veteran
Veteran
Alle Kommentare lesen unter igor´sLAB Community →