


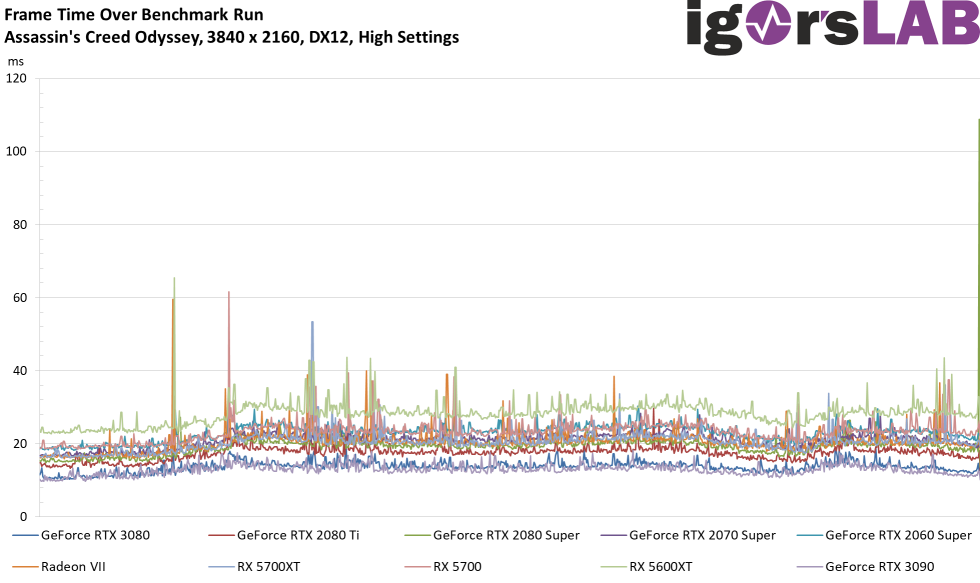
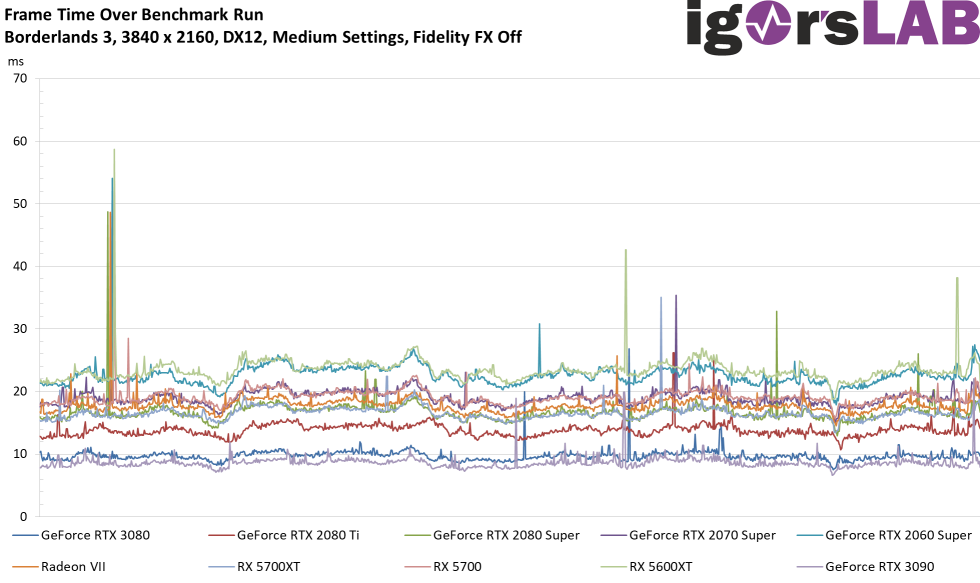
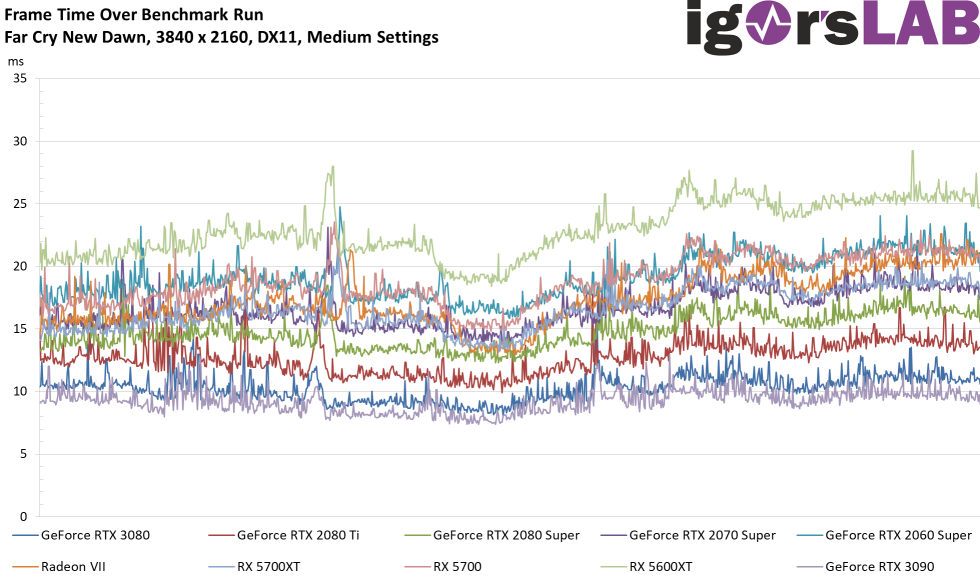
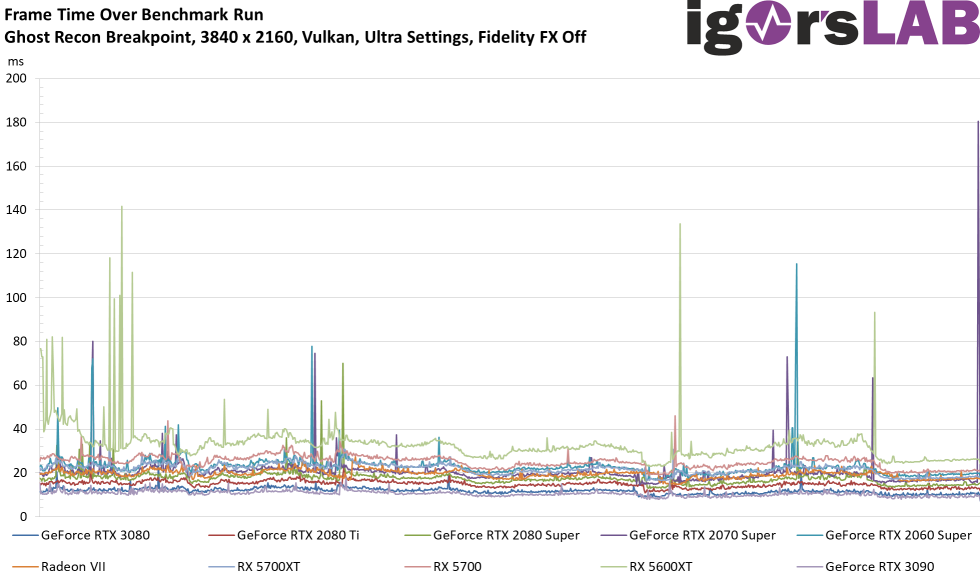
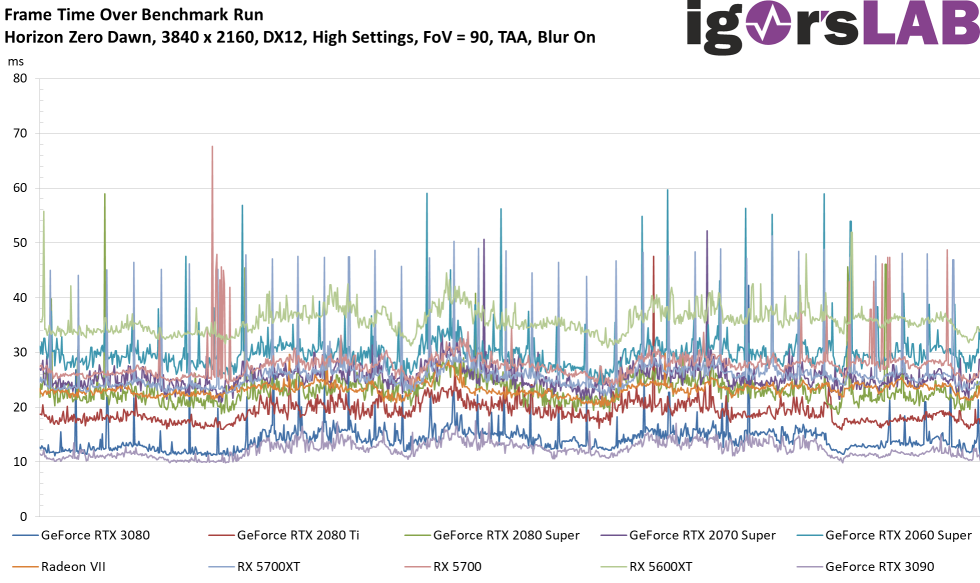
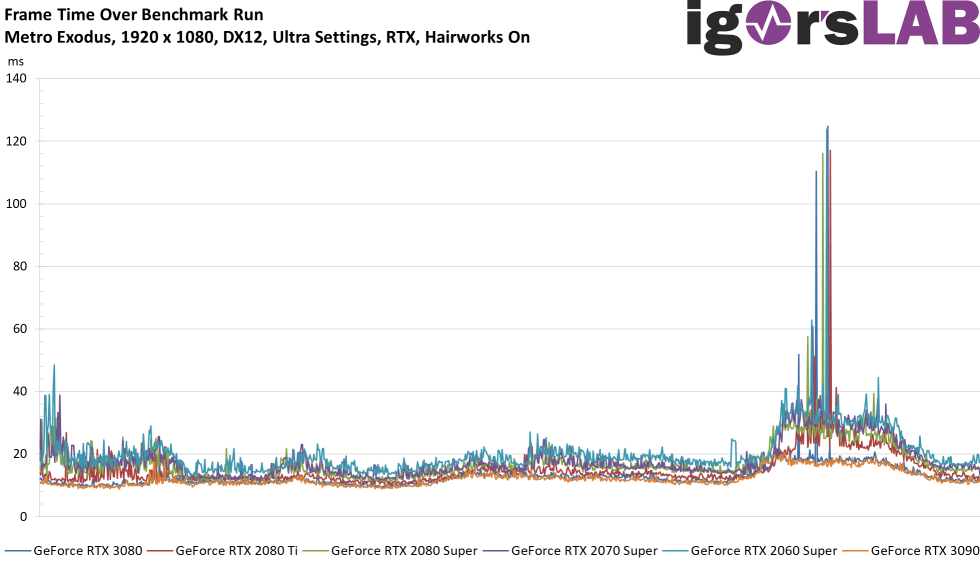
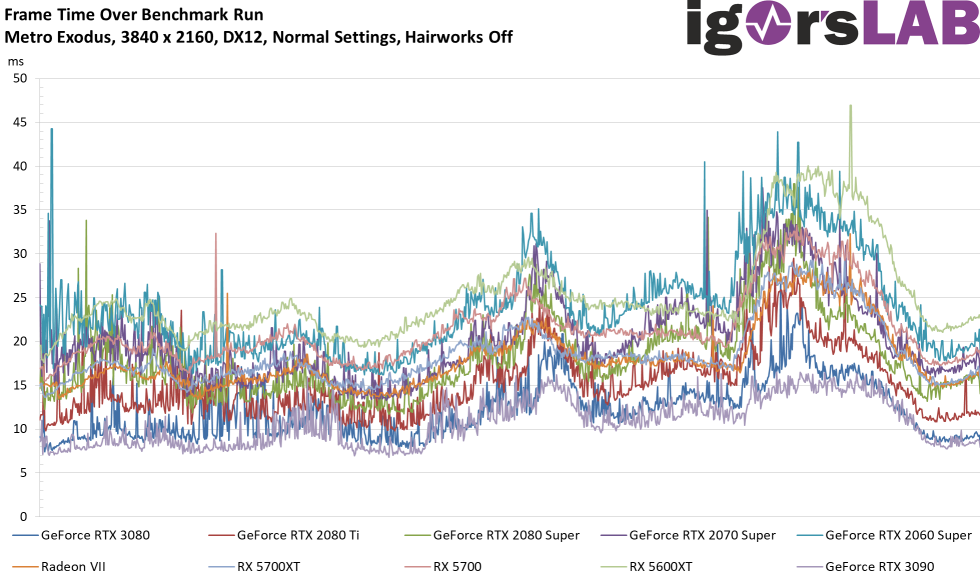
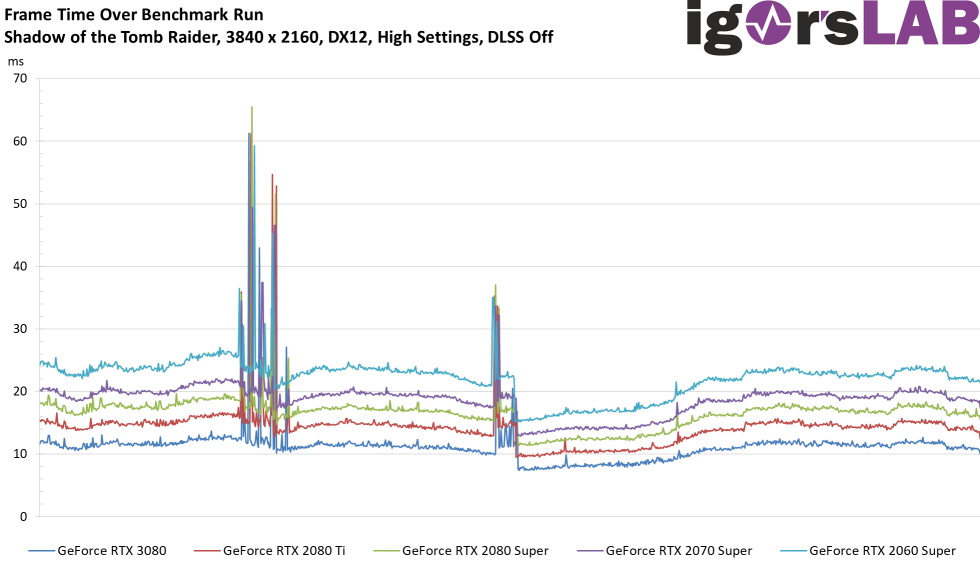
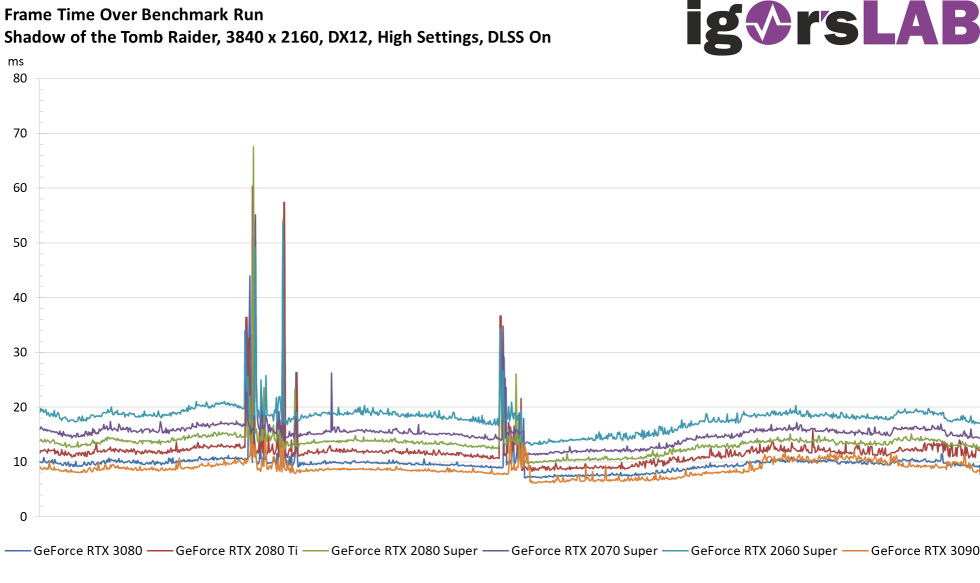
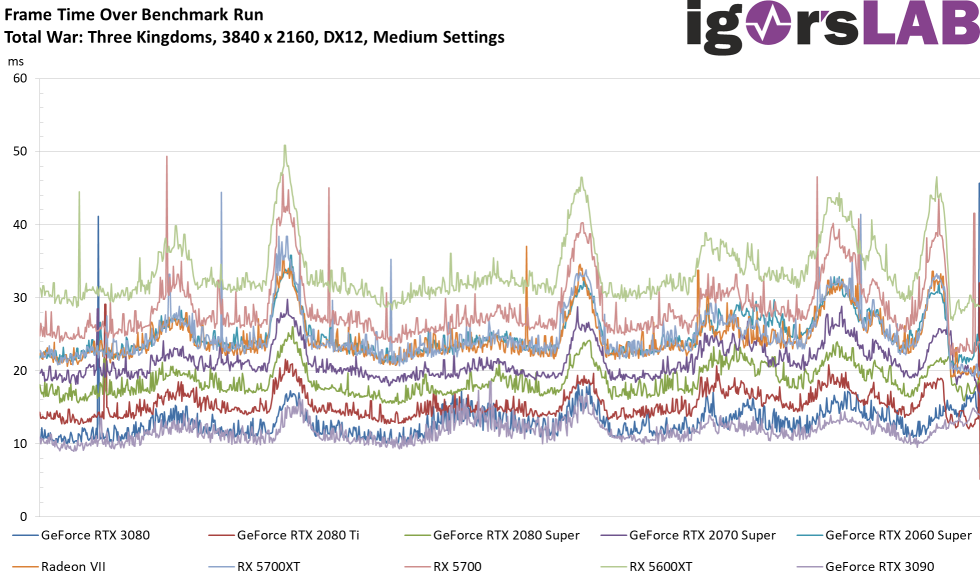
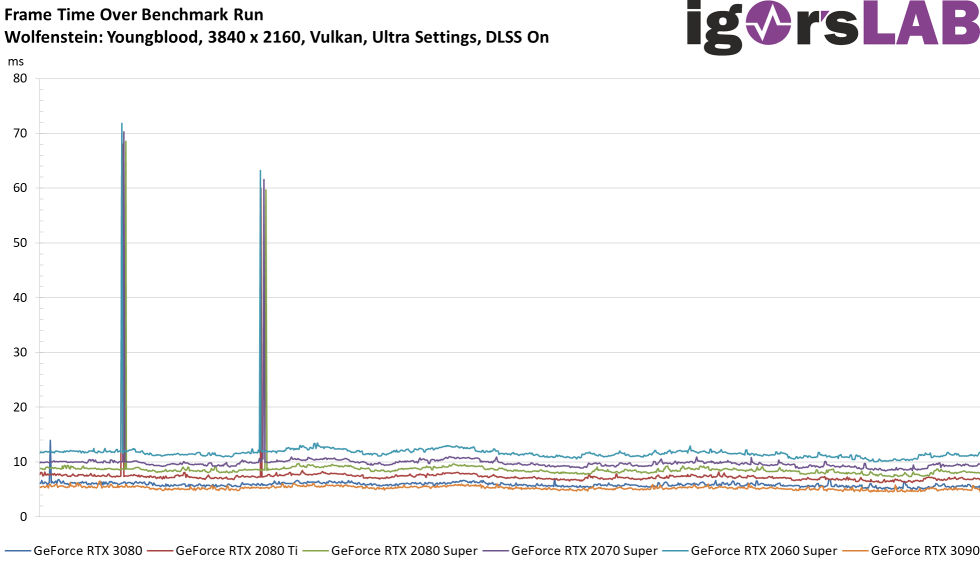
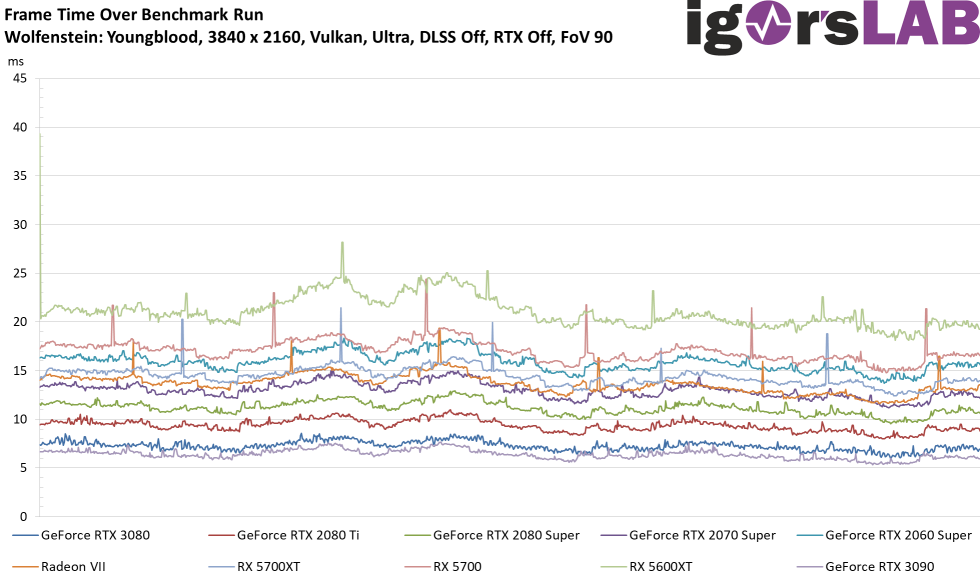
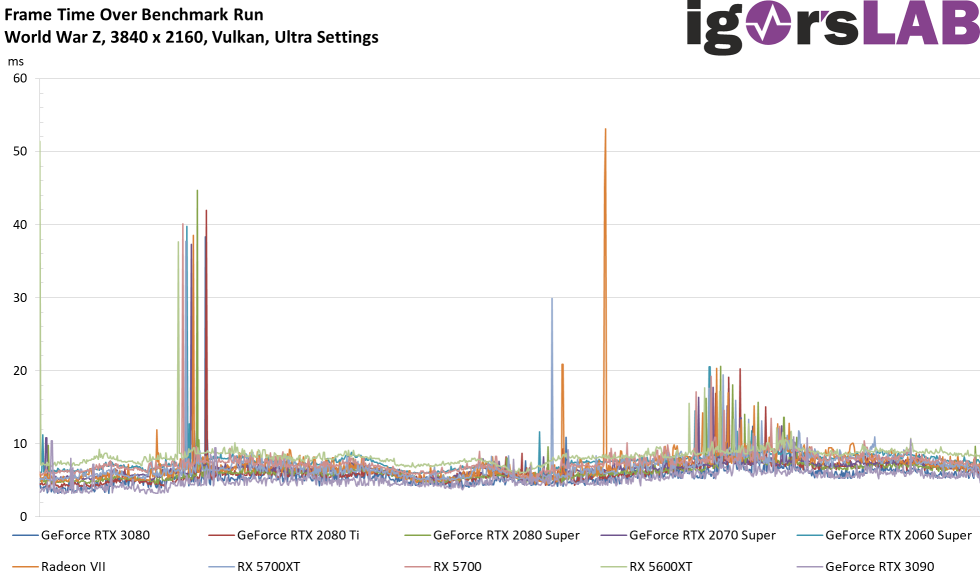
Now we come to what is actually even more important than the very granular FPS: the Frame Time. But I also don’t want to withhold the curves from anyone, even if they seem a bit confusing at first glance. The timeline is identical for each game on all maps, because I use an intelligent software interpolation for this, which plots everything uniformly on this timeline for the graphical output, regardless of the number of rendered frames and thus also the different number of acquired values.
- 1 - Intro, Unboxing and Test System
- 2 - Teardown, PCB and Cooler
- 3 - Gaming-Performance: FPS in Ultra-HD, DLSS and RTX On
- 4 - Gaming-Performance: FPS Curves
- 5 - Gaming-Performance: Percentile as Curves
- 6 - Gaming-Performance: Frame Time Curves
- 7 - Gaming-Performance: Frame Time Bar Charts
- 8 - Gaming-Performance: Variances
- 9 - Frame Times vs. Power Consumption
- 10 - Workstation: CAD
- 11 - Studio: Rendering
- 12 - Studio: Video- and Image Editing
- 13 - Power Consumption: GPU and CPU in all Games
- 14 - Page Title :Power Consumption: CPU in all Games (with Limits)
- 15 - Power Consumption: Efficiency in all Games
- 16 - Power Consumption: Summary, Details and PSU-Recommendation
- 17 - Clock Rate, OC, Temperatures and Thermal Imaging
- 18 - Fan Speed and Noise Level (Chamber)
- 19 - NVIDIA Broadcast - More than a Gimmick?
- 20 - Summary and Conclusion


Kommentieren