


RTX-OPS: Definition Attempts
As modern graphics processors become more complex and integrate resources that perform different functions but still affect the overall picture, it becomes increasingly difficult to summarize their capabilities as a overall performance factor. We already use terms such as fill rate to compare how many billions of pixels or texture elements a graphics processor can theoretically display on the screen in a second. Memory bandwidth, computing power, primitive rate – the graphics world is full of peak values that become the basis for back-of-the-unvelope calculations.
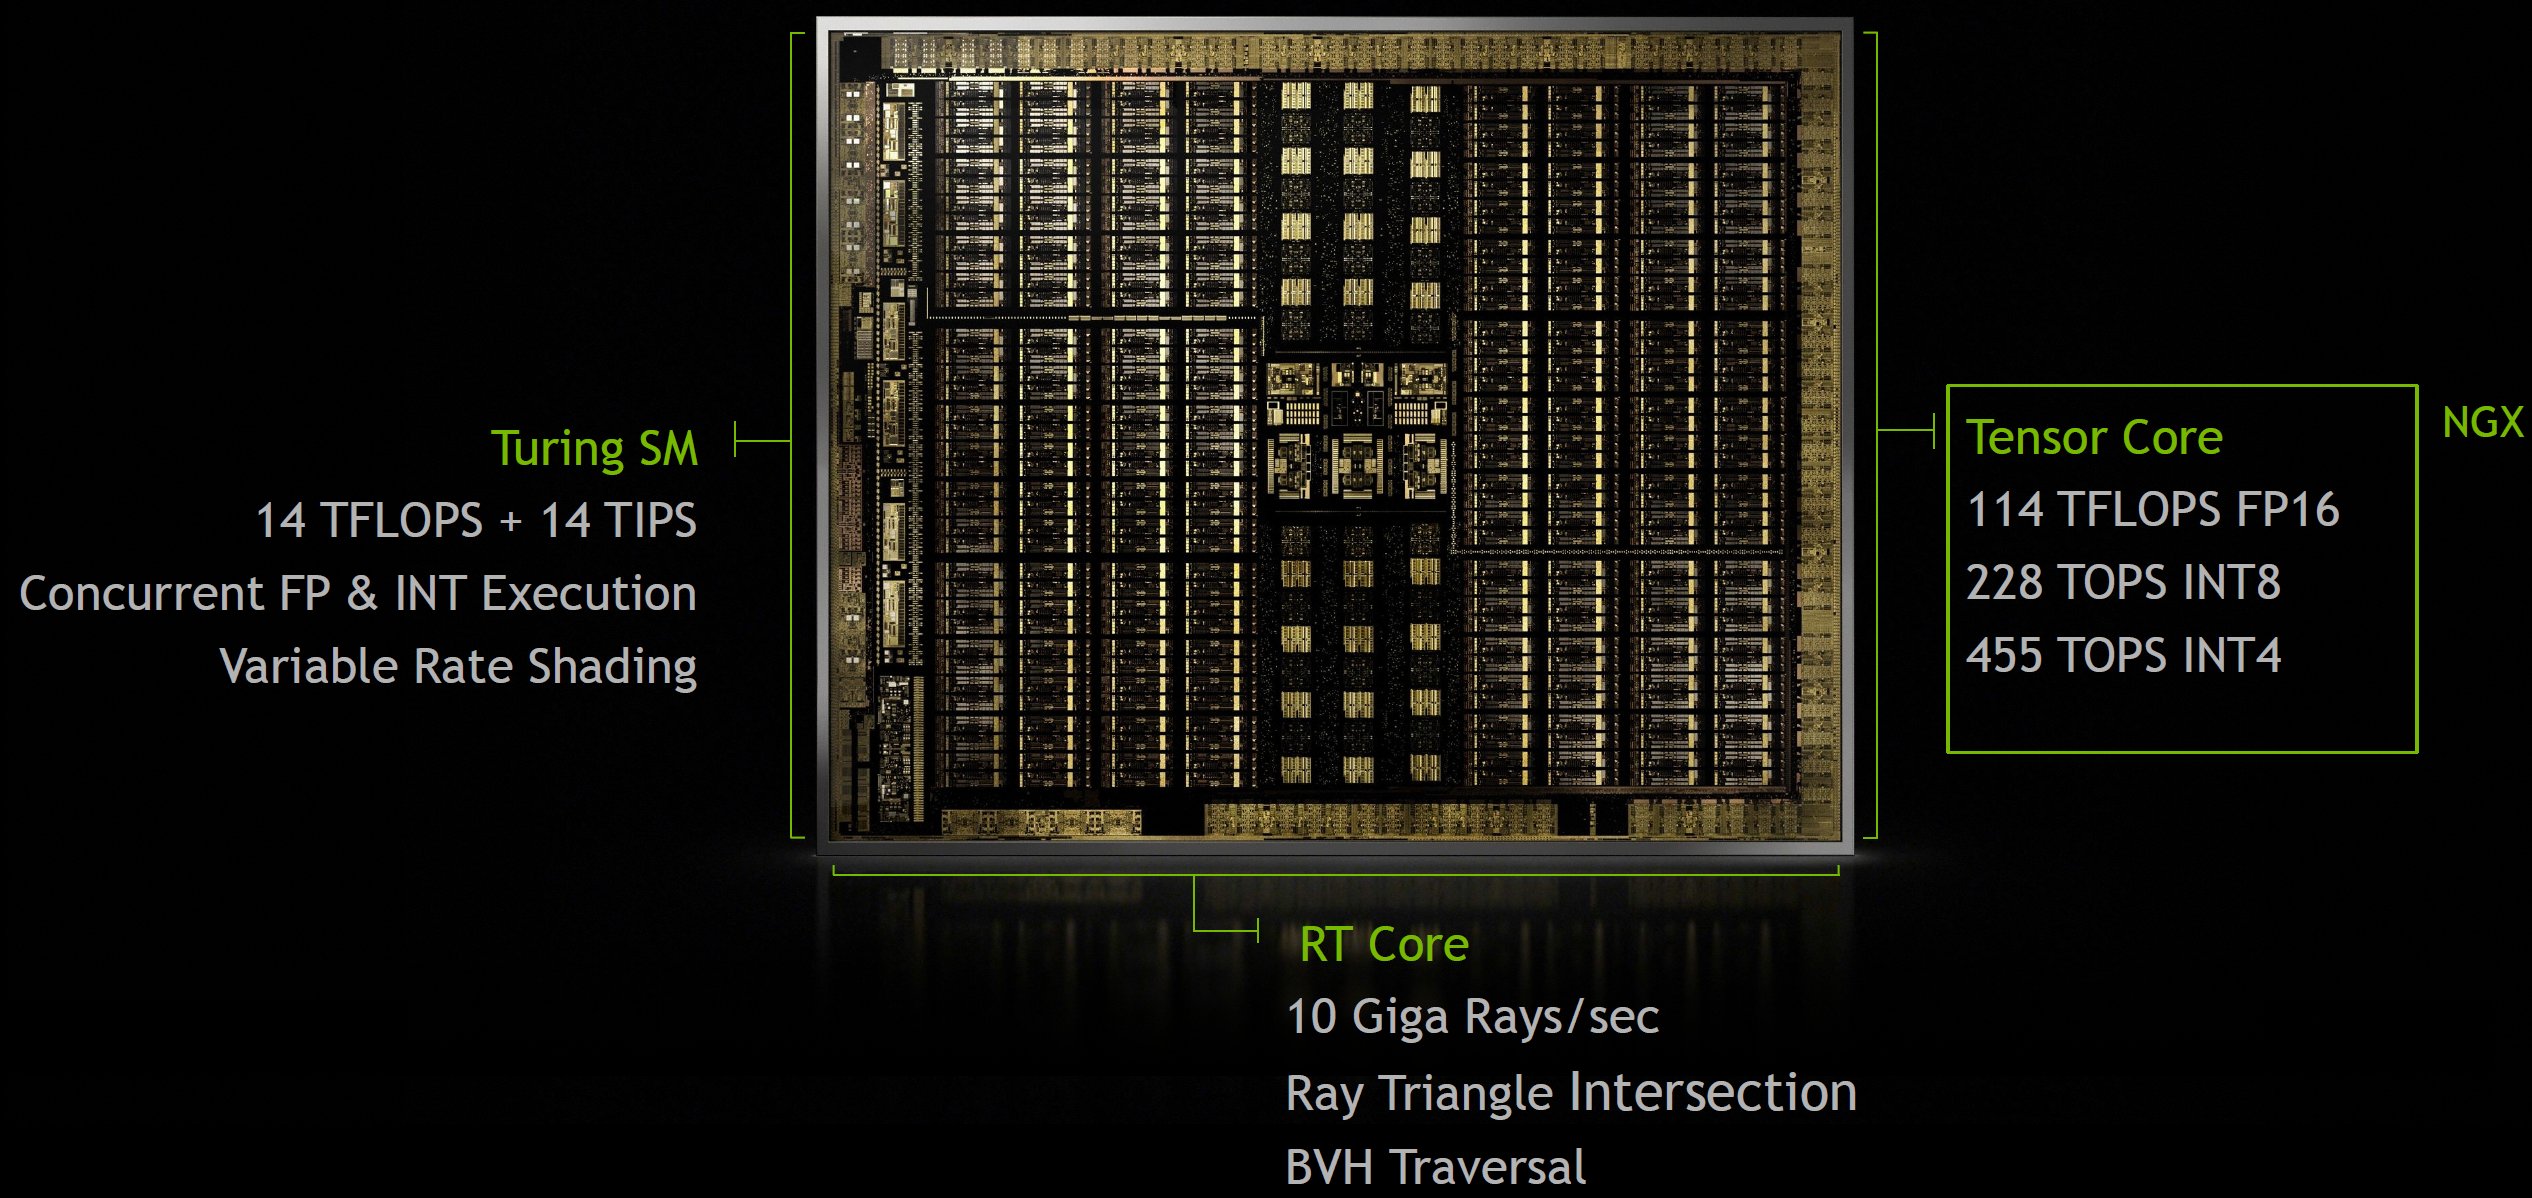
Now, with the addition of tensor and RT cores to its Turing streaming multiprocessors, Nvidia found it necessary to develop a new metric that adequately embraces the capabilities of its INT32 and FP32 math pipelines, its RT cores, and tensor cores. While we do not plan to use the resulting RTX-OPS specification for our comparisons, since Nvidia uses them, we want to at least describe the composition of the equation.
The RTX-OPS model requires the use of all resources, which is a very bold and very forward-looking assumption. Finally, until the games largely take over Turing's ray tracing and deep learning skills, RT and Tensor Kerne remain (mostly) idle. However, if they can be included, the image changes. That's why Nvidia developed its own approximation of processing in a frame rendered by a Turing-based graphics processor.
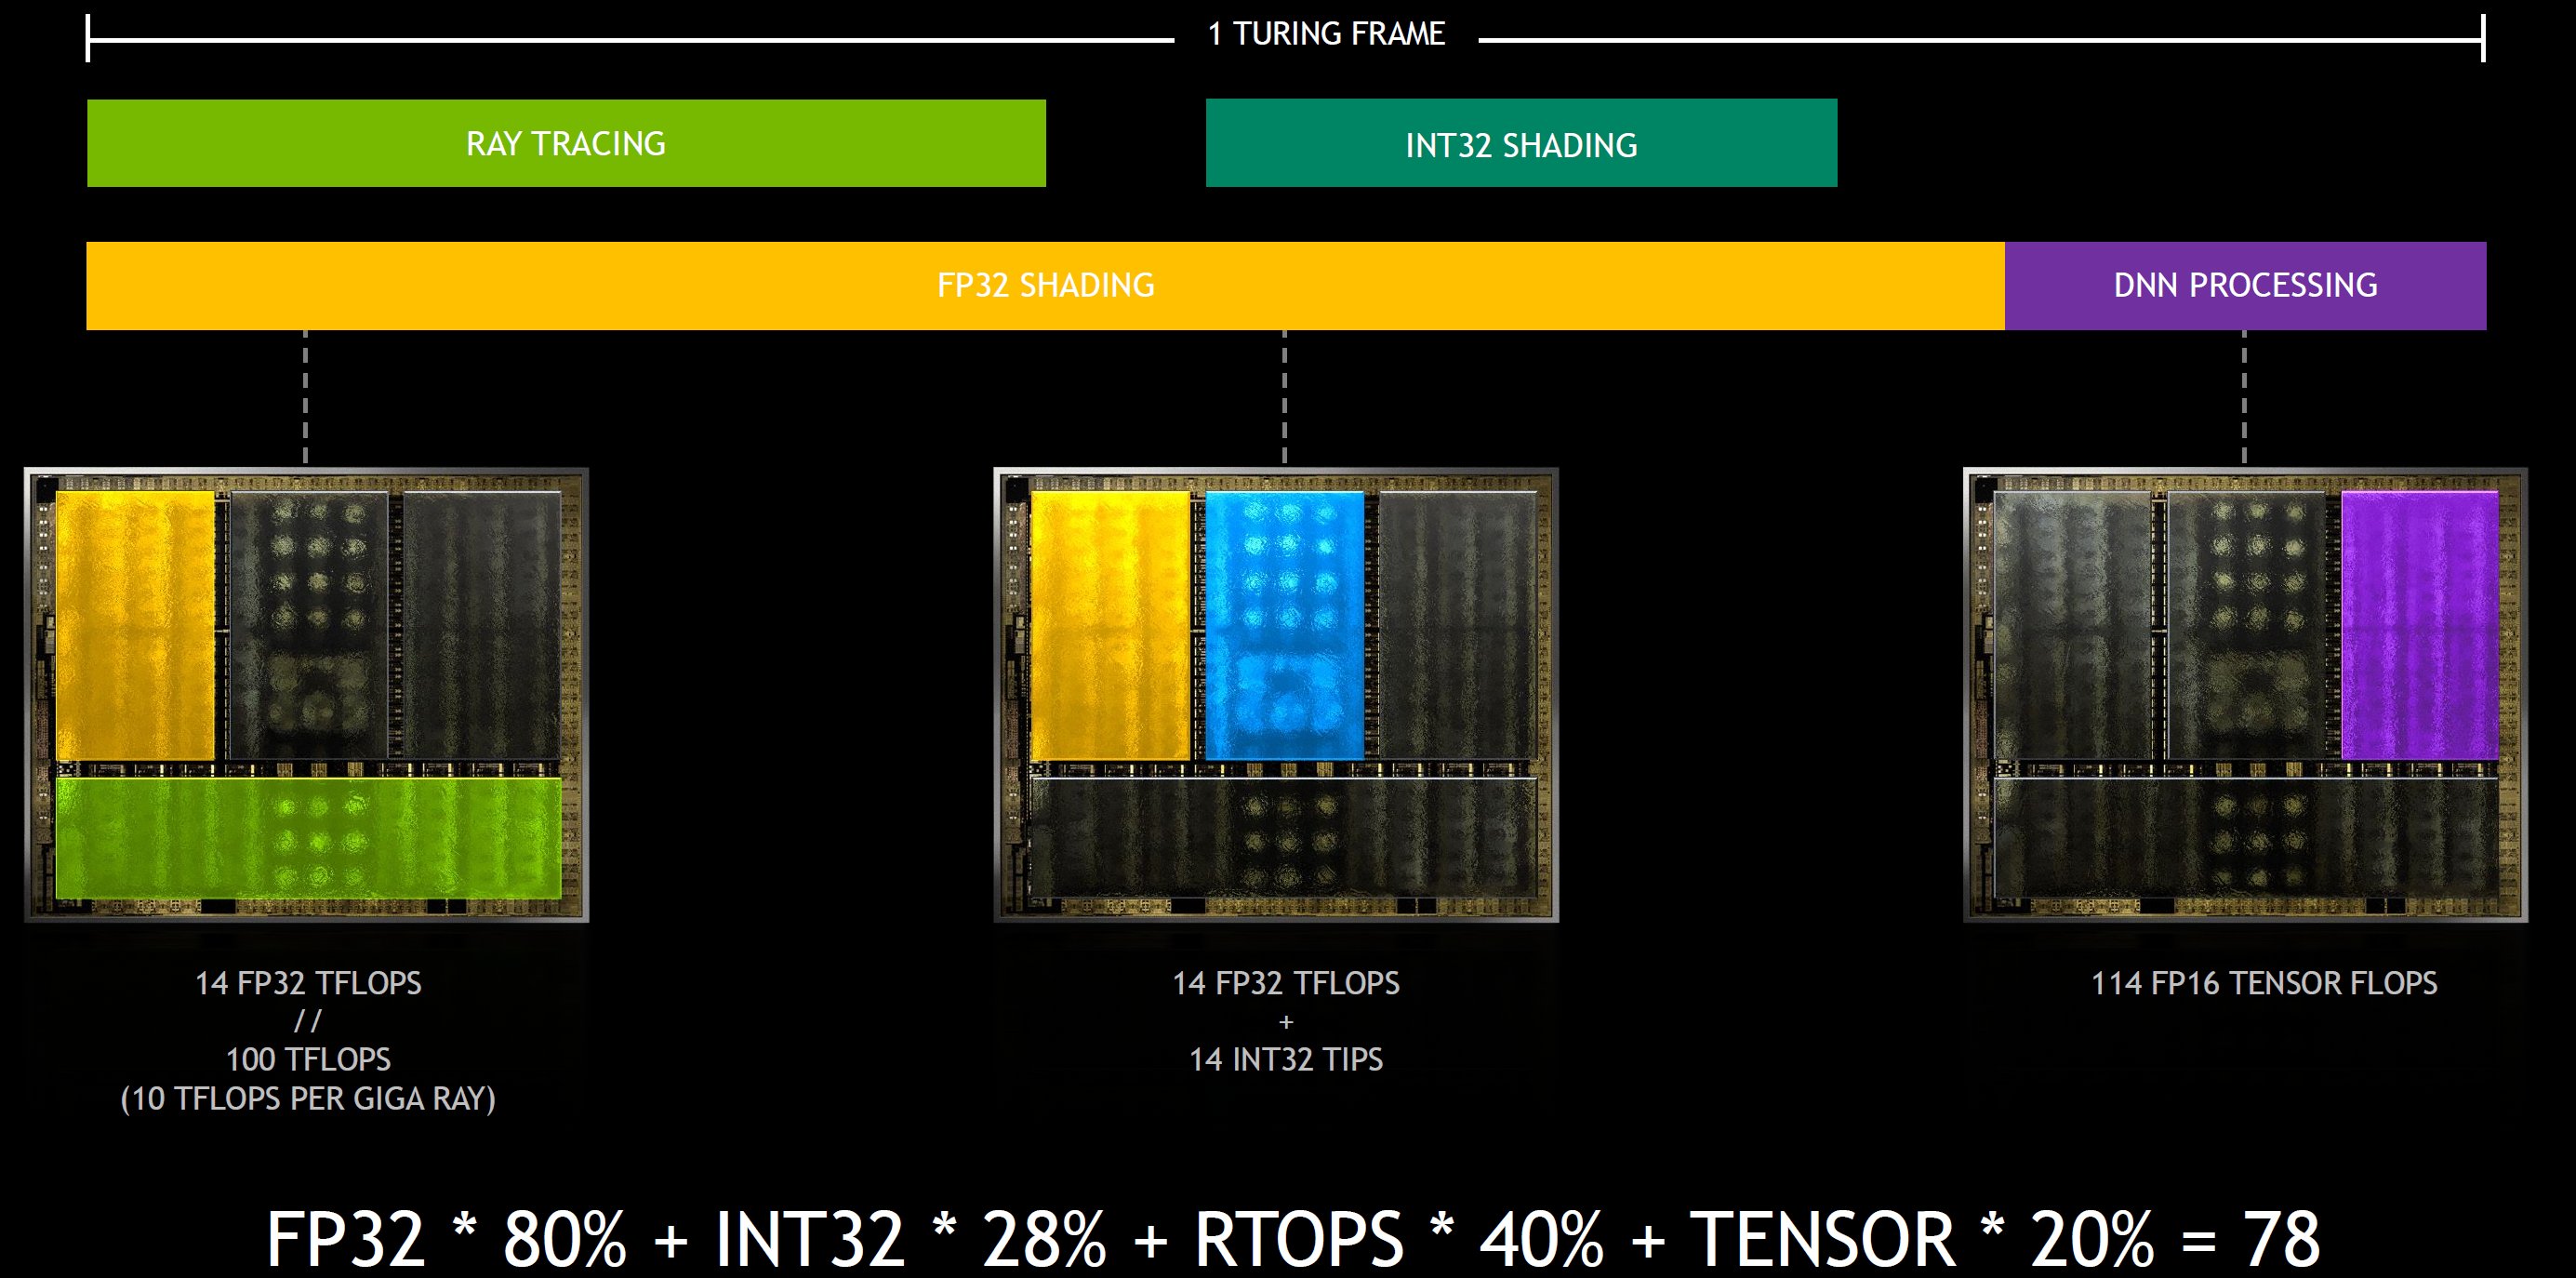
In the figure above, Nvidia shows that about 80% of the power is needed to render the frame, and the remaining 20% goes to AI. In the shading slice, there is about 50/50 split between ray tracing and FP32 tasks. If you look deeper into the CUDA cores, what Nvidia has observed with about 36 INT32 operations for 100 FP32 commands over a swarm of shader traces offers us a pretty reasonable idea of what happens in an "ideal" scene, that can take advantage of any functional unit.
The formula that has now been put in place is already somewhat tricky,…
- FP32 Calculation = 4352 FP32 cores * 1635 MHz clock speed (GPU Boost Rating) * 2 = 14.2 TFLOPS
- RT core calculation = 10 TFLOPS per gigaray
- INT32 Instructions per Second = 4352 INT32 Cores * 1635 MHz Clock Rate (GPU Boost Rating) * 2 = 14.2 TIPS
- Tensor core calculation = 544 tensor cores * 1635 MHz clock speed (GPU boost rating) * 64 floating-point FMA operations per clock * 2 = 113.8 FP16 tensor TFLOPS
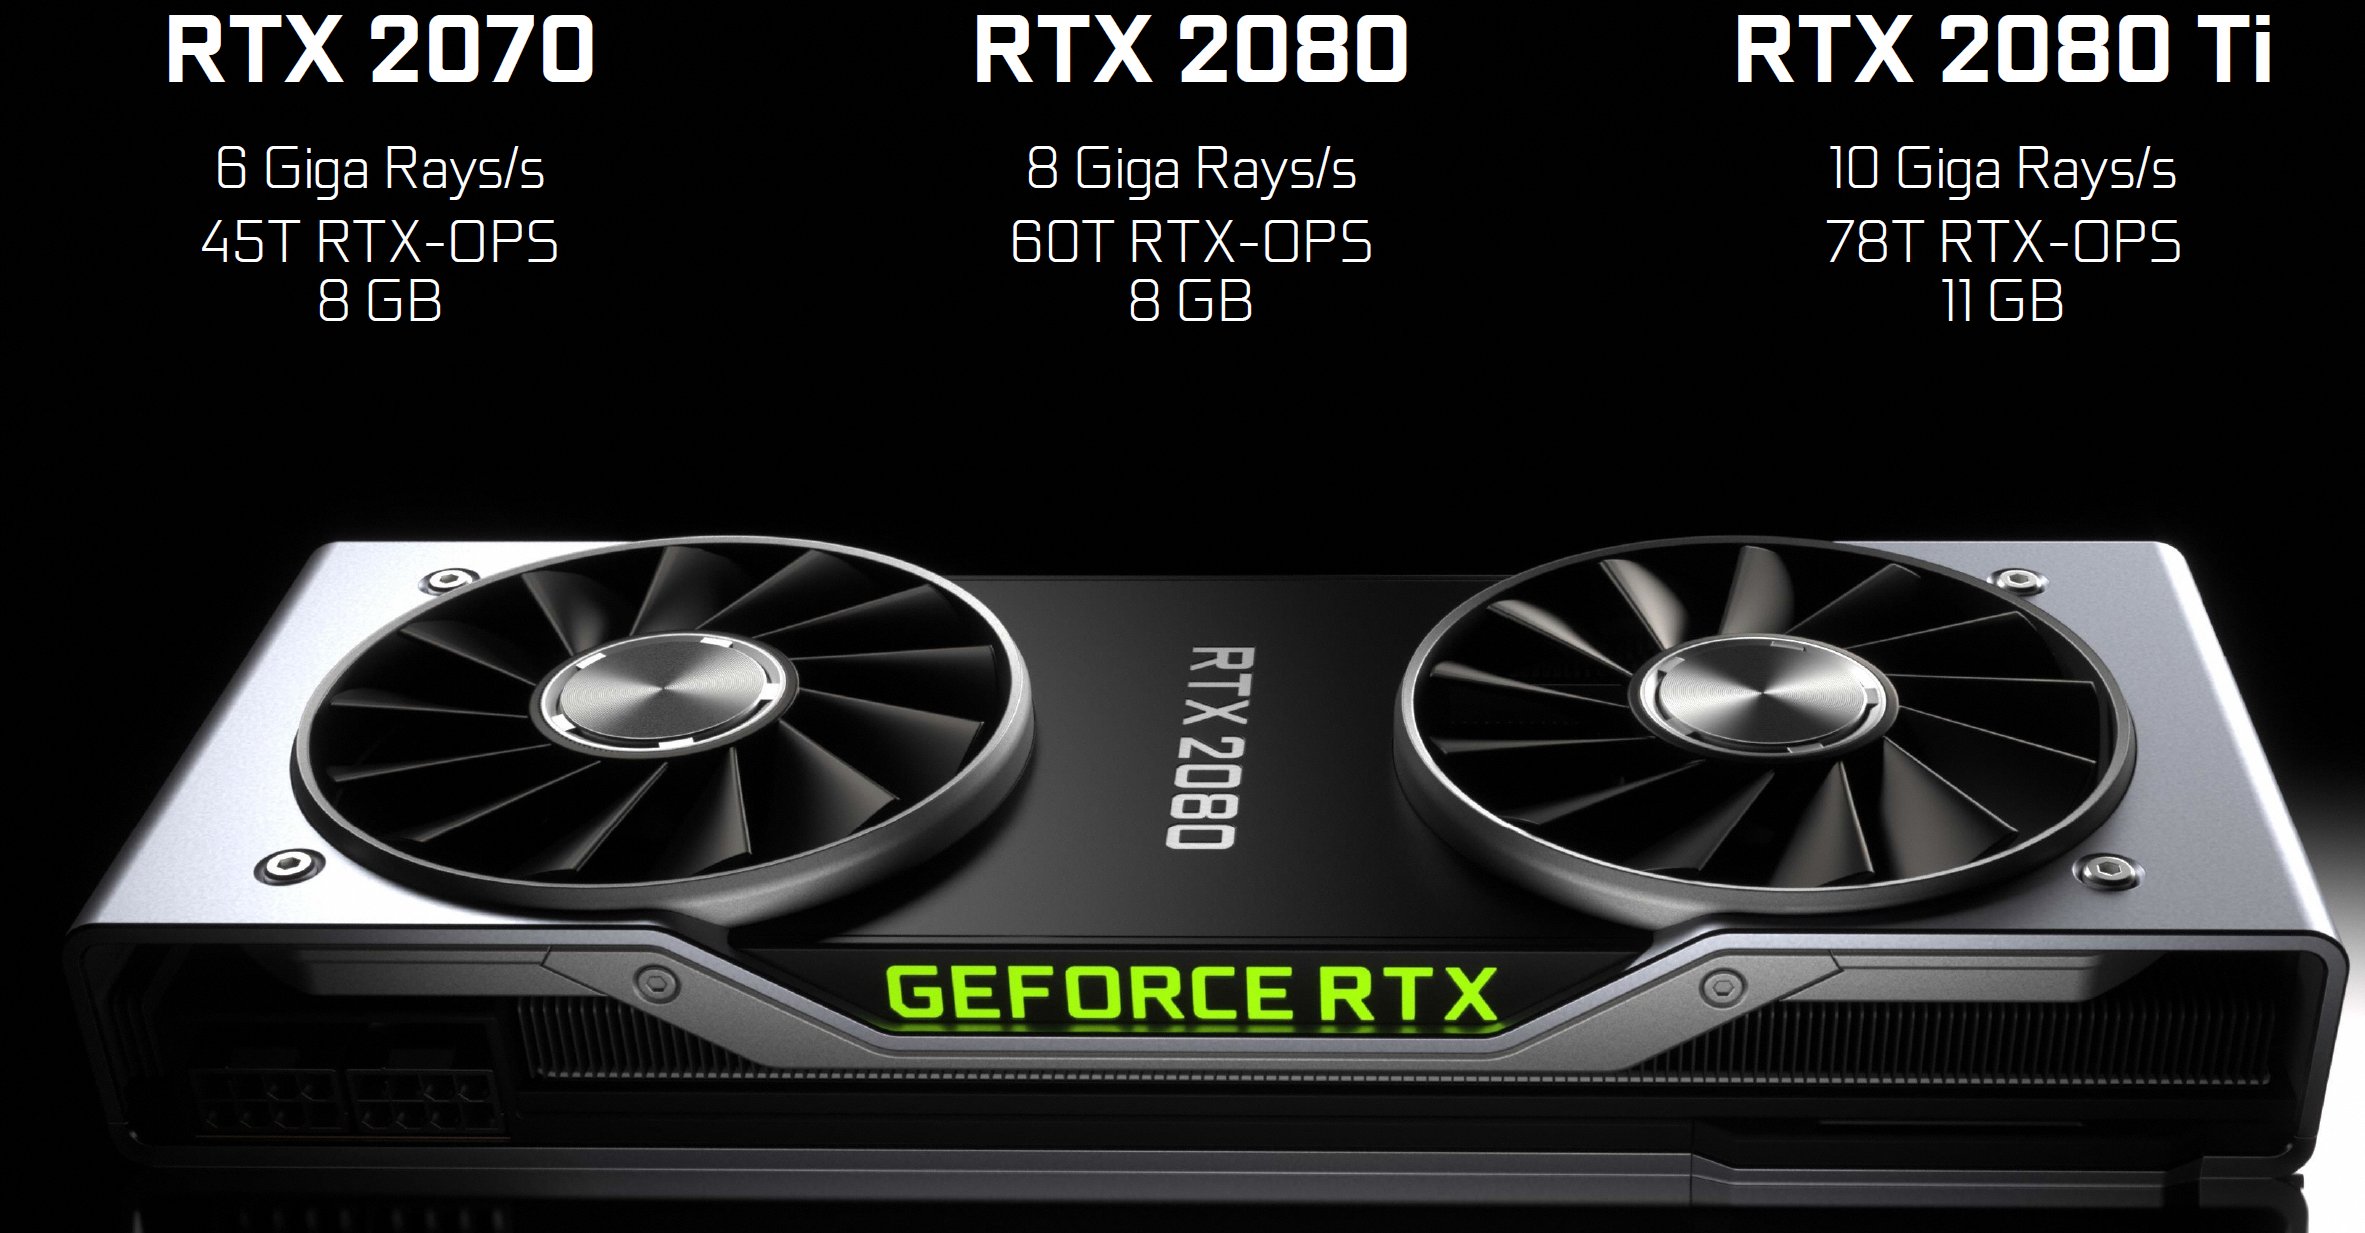
… so we should now look backwards at Nvidia's mathematics to see how Nvidia has even reached the "78 RTX-OPS" specification for their GeForce RTX 2080 Ti Founders Edition card:
(14 TFLOPS[FP32] * 80%) + (14 TIPS[INT32] * 28%[~35 INT32 Ops pro 100 FP32 Ops, die 80% der Arbeitsbelastung ausmachen])) (100 TFLOPS[Raytracing] * 40%[Hälfte von 80%]) + (114 TFLOPS[FP16 Tensor] * 20%) = 77.9
In this model, too, of course, there are many assumptions and conjunctives, so we see no way of using it fairly and objectively for all generational or competitive comparisons. Moreover, we deliberately do not want to fall into the habit of generalising ratings across many different sources.
At the same time, however, it is clear that Nvidia wanted to create a way to present performance holistically, and we really cannot blame the company for it, especially since it not only added the capabilities of each subsystem, but also its individual proportions in the calculation of a frame in isolation.
- 1 - Einführung und Vorstellung
- 2 - TU102 + GeForce RTX 2080 Ti
- 3 - TU104 + GeForce RTX 2080
- 4 - TU106 + GeForce RTX 2070
- 5 - Performance-Anstieg für bestehende Anwendungen
- 6 - Tensor-Kerne und DLSS
- 7 - Ray Tracing in Echtzeit
- 8 - NVLink: als Brücke wohin?
- 9 - RTX-OPs: wir rechnen nach
- 10 - Shading-Verbesserungen
- 11 - Anschlüsse und Video
- 12 - 1-Klick-Übertaktung
- 13 - Tschüss, Gebläselüfter!
- 14 - Zusammenfassung und Fazit


Kommentieren