


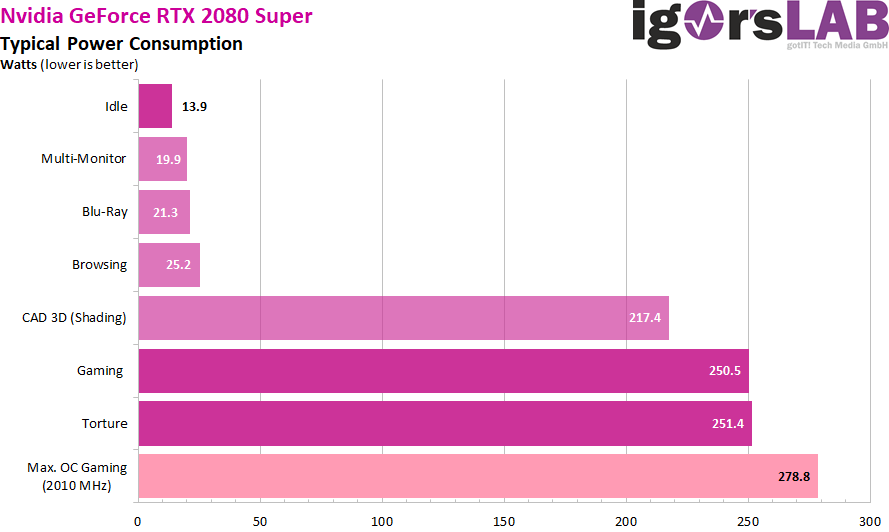
Power consumption and loads
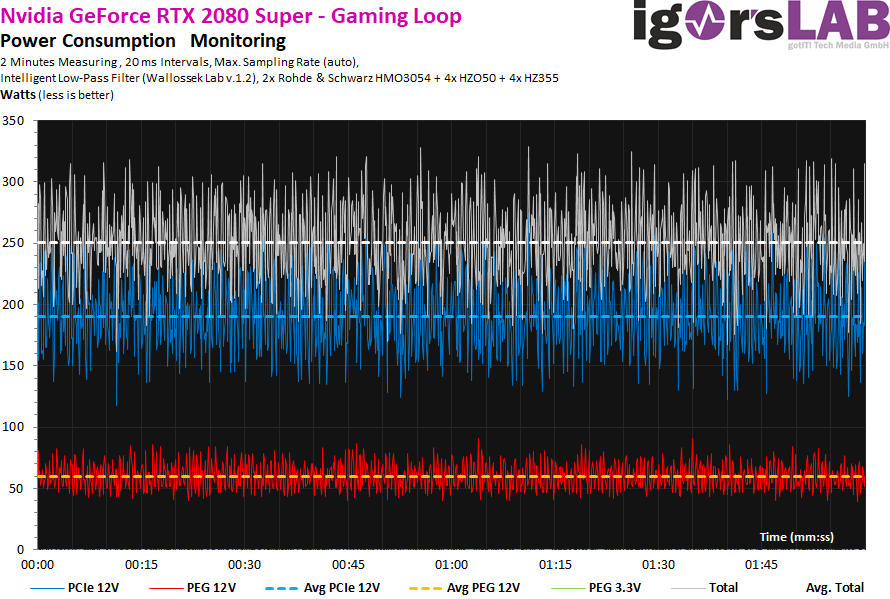
The 14 watts in the idle still acceptable. The plentiful 251 watts in the stress test and the plentiful 250 watts in the gaming loop are quite precisely in the power target of 250 watts set in the BIOS ex works, for whatever reason. With just under 279 watts of gaming, the maximum value for overclocking is again exactly what the BIOS specifies as the maximum power limit. All in all, this is still respectable, even if the fully developed chip has already reached its limit.
Here is a short excerpt from what Nvidia gave this card in the firmware of limits:

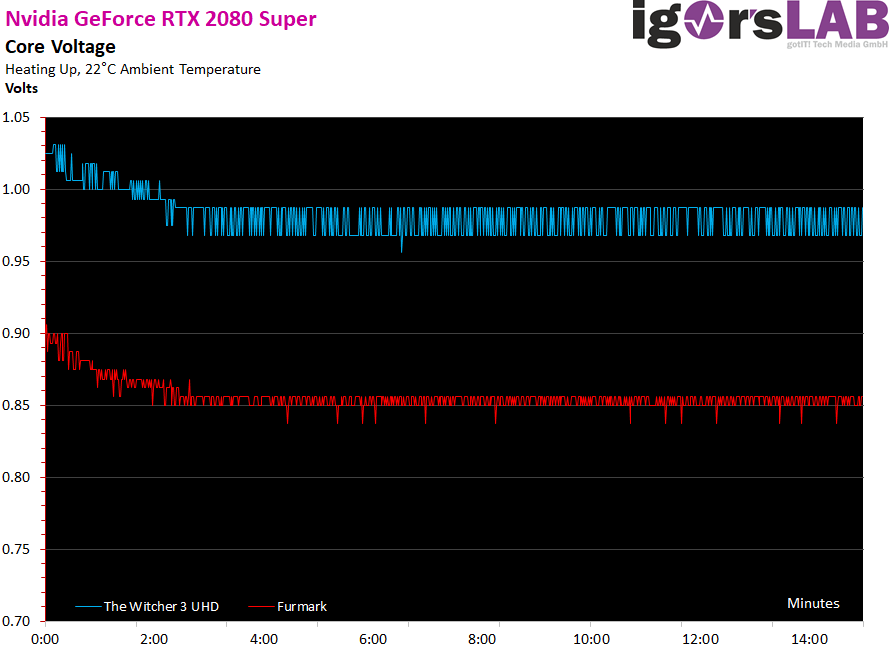
The voltages are in the expected range, with the oc's permissible board power being the limiting factor, not the voltage. One notices very clearly that Nvidia deliberately limits here and that the thermal influence of the cooling is also clearly visible.
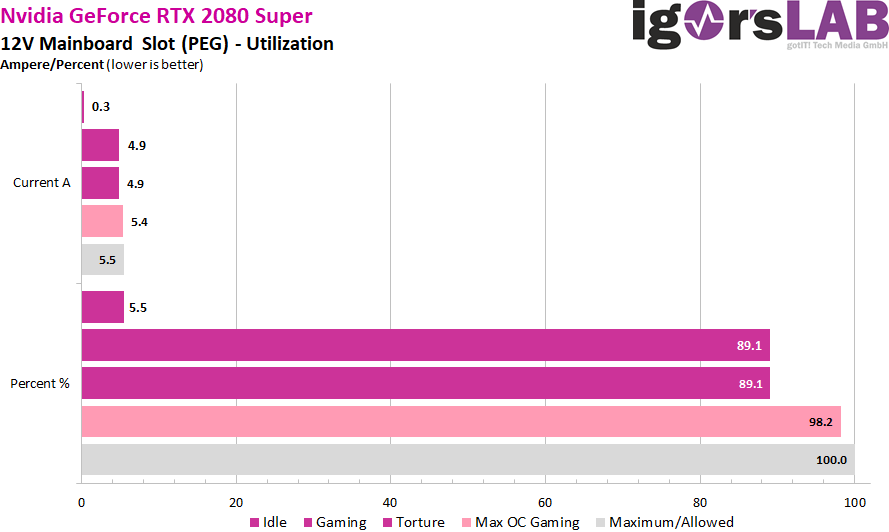
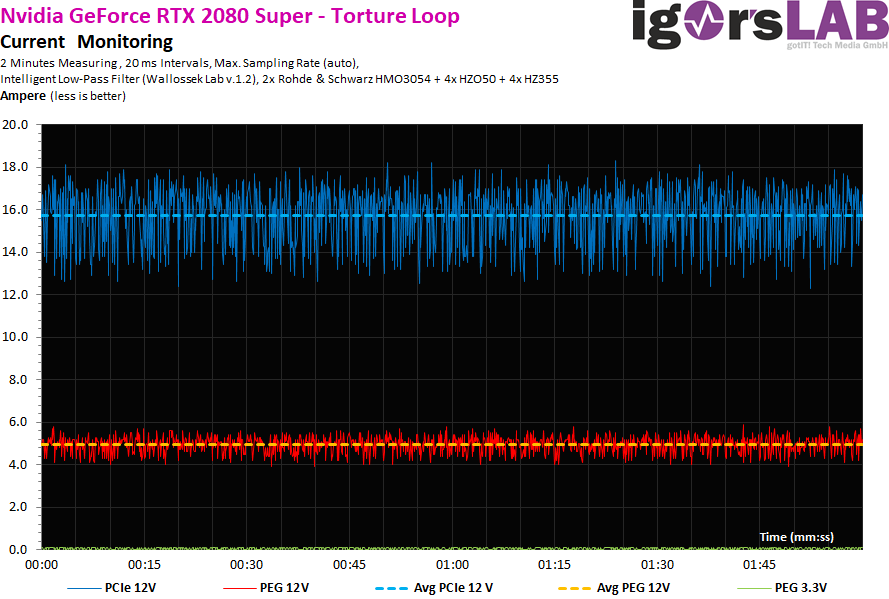
The load distribution on the rails is perfect, because in normal operation and in the CASE of the OC, the maximum permissible 5.5 amperes of the motherboard slot are never exceeded. The balancing has been really successful here, even if the 5.5 amperes are only marginally undercut in the maximum OC.
Power supply design and peak loads/currents
As I have already demonstrated in detail in my basic article "The fight of graphics card against power supply – power consumption and load peaks demystified", there are also temporarily higher loads in the millisecond range, which are unfavorable in case of unfavorable designed or improperly equipped power supplies can already lead to unexplained shutdowns. The TBP (Typical Board Power) measured by the graphics card manufacturer or the reviewers does not really help for a stable design of the system.
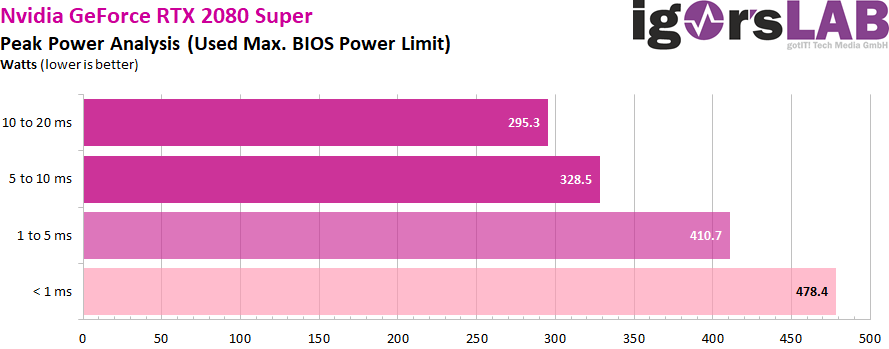
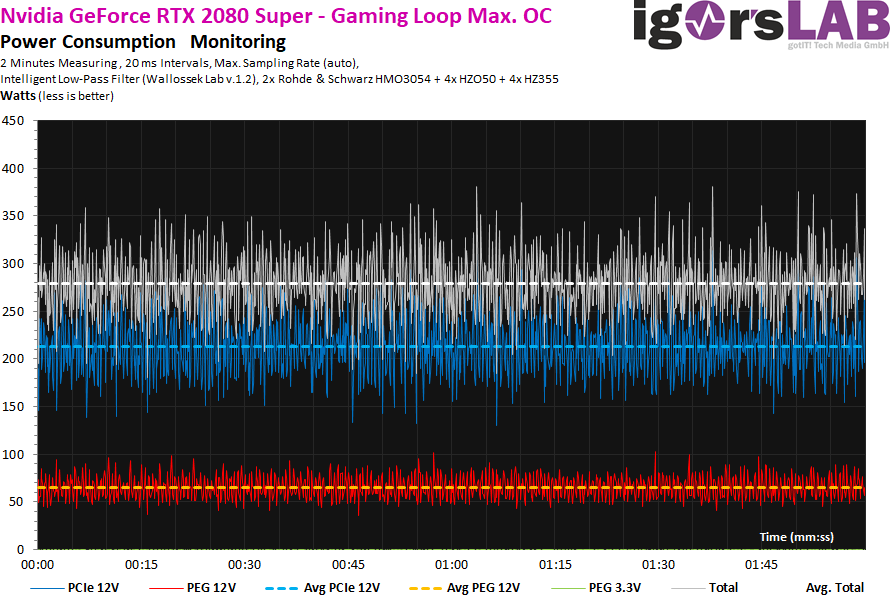
Peaks with intervals between 1 and 10 ms can lead to shutdowns with very fast-reacting protective circuits (OPP, OCP), especially for multi-rail power supplies, although the average power consumption is still in the norm. For the GeForce RTX 2080 Super I would therefore calculate with a good 330 to 350 watts to have enough reserves in case of a case. A short excerpt with high resolution now show us the 20 ms intervals, how I run them automatically for valuation:

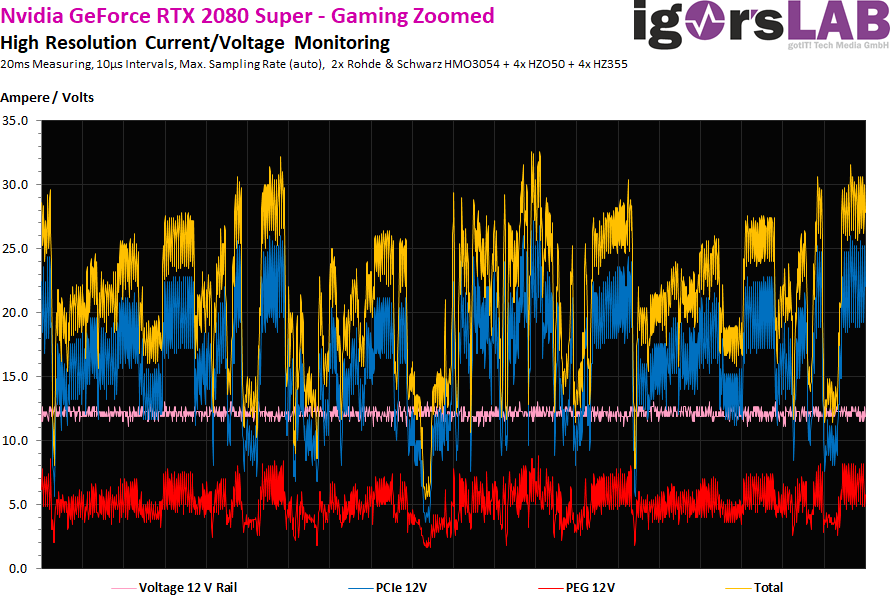
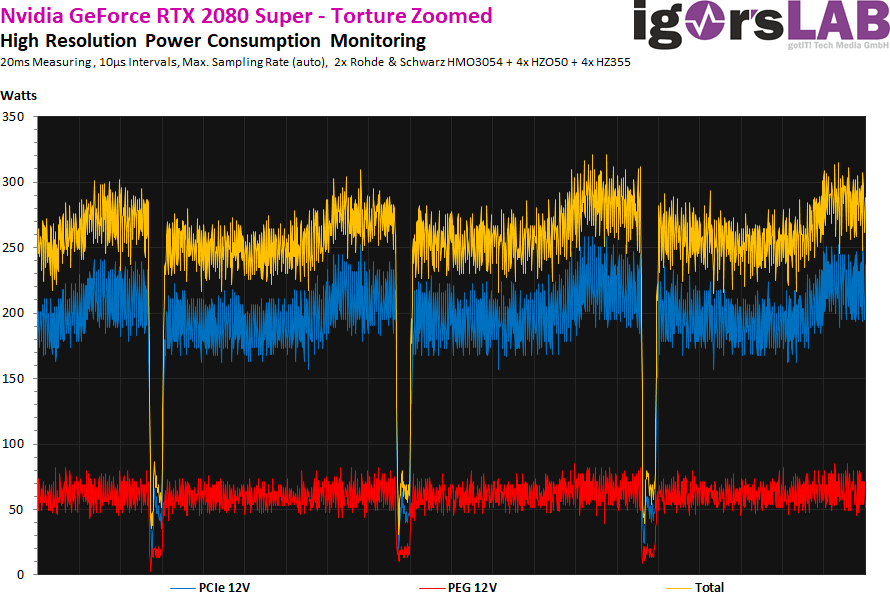
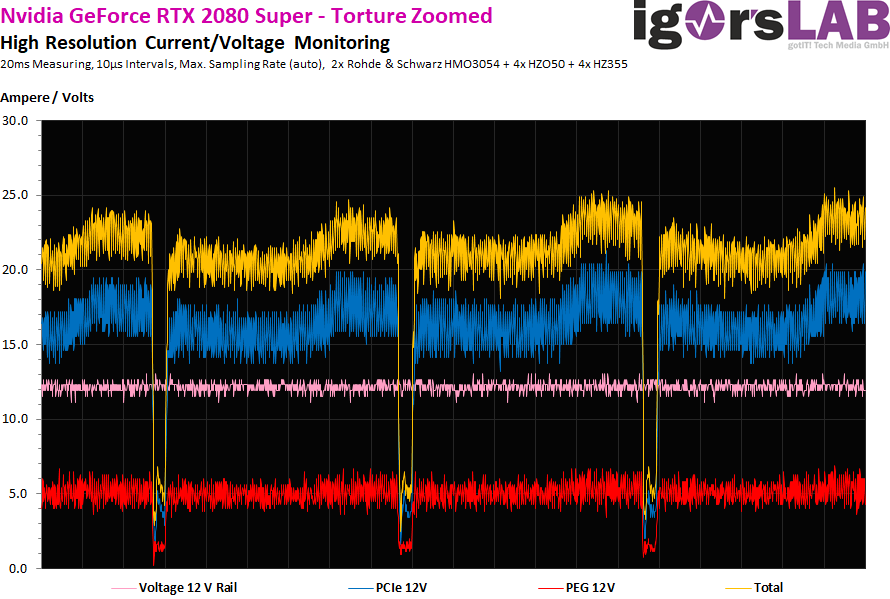


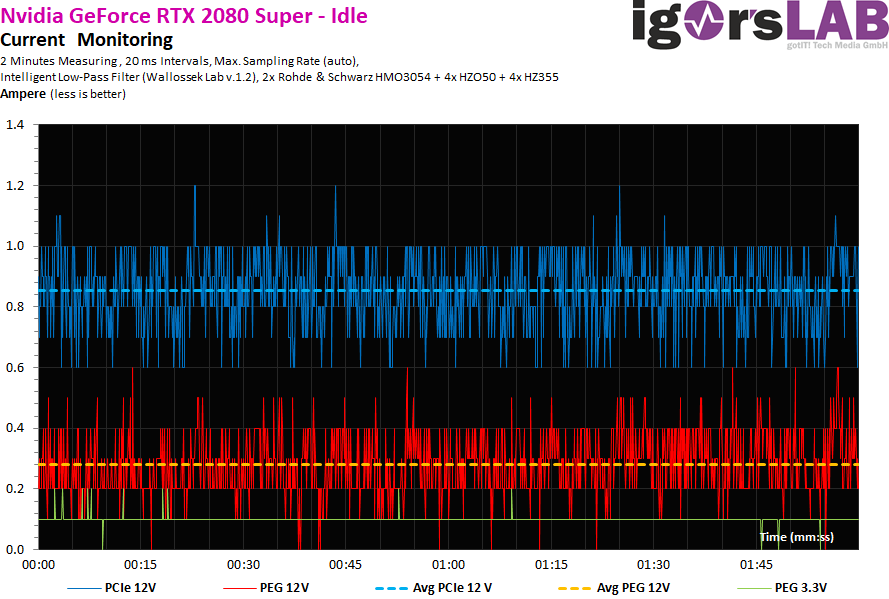
Detailed recording of average power consumption and flowing currents
As usual, I now also set aside the power consumption and the flowing currents as detailed graphics of my oscillograph measurements. A service that hardly anyone else offers and which shows how the maps "tick" in detail:


Kommentieren