


For the launch of the GeForce GTX 1080 FE, there were still approx. 180 watts, which we were able to measure under full load, the GeForce GTX 1080 Ti FE was already just under measured 250 watts. In a follow-up shortly, we will also question in more detail how the new PWM controllers and the Smart Power Stage work together and why the curves under load look so completely different this time. Because the result can really please both cards.
Power consumption of the GeForce RTX 2080
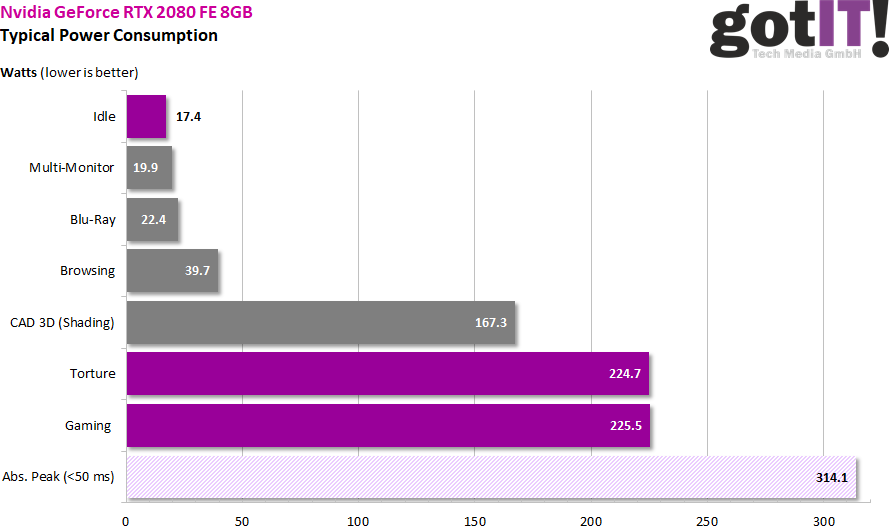
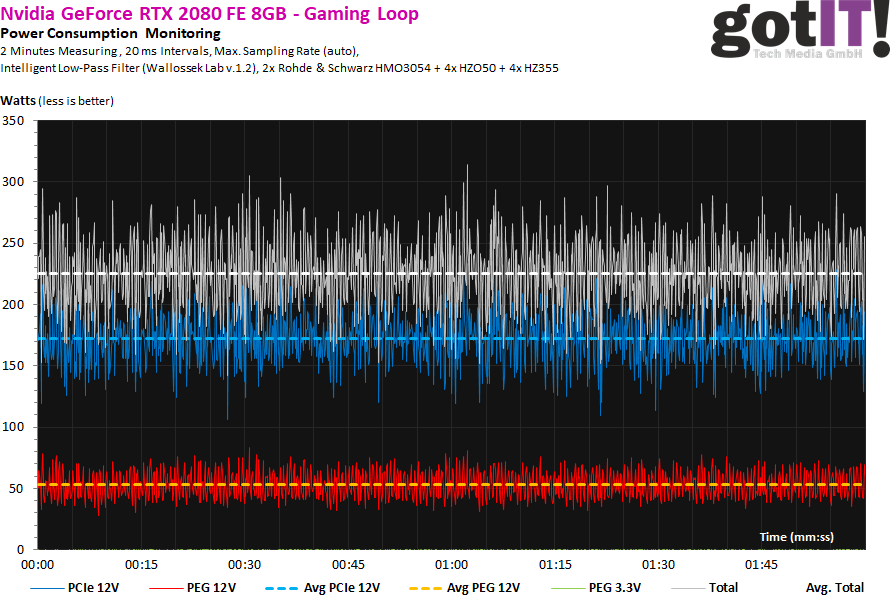
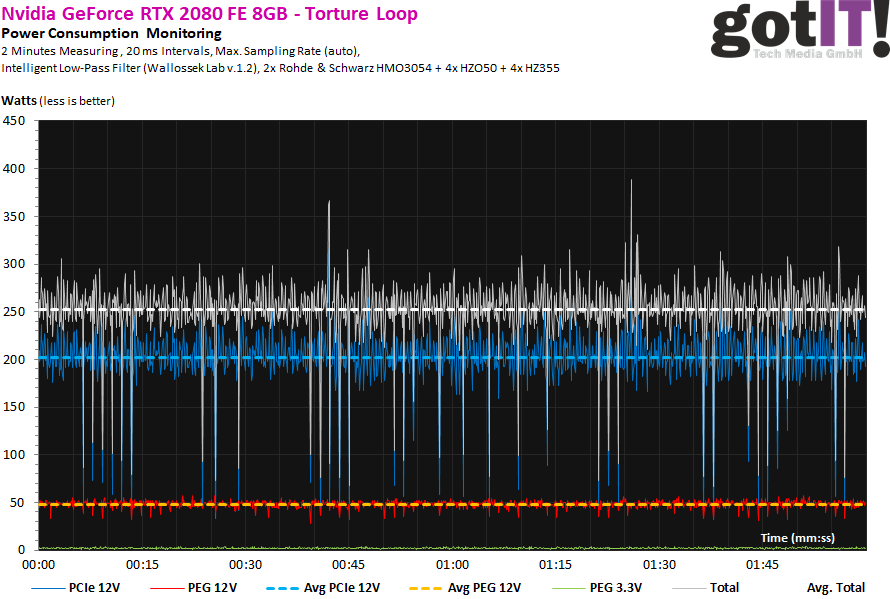
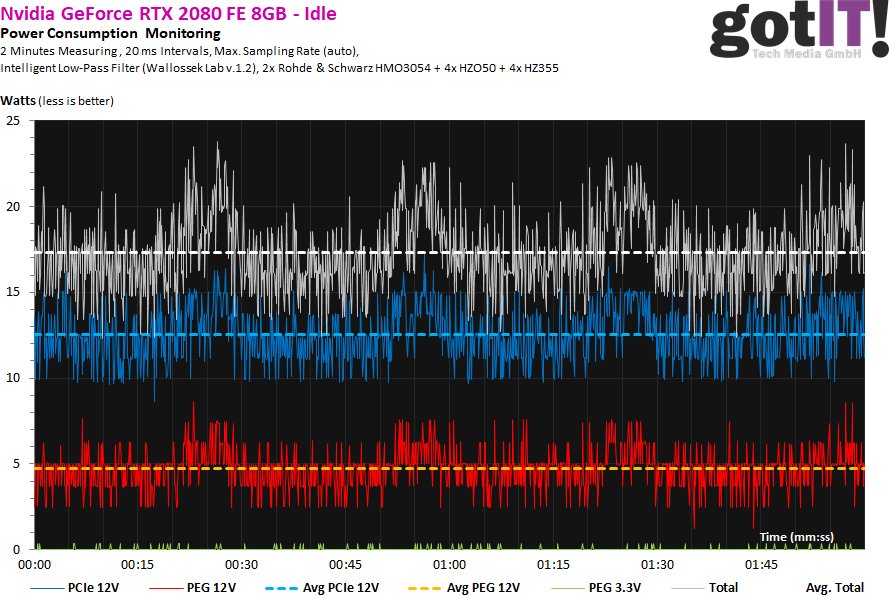
Let's start with the smaller of the two cards. The GeForce RTX 2080 makes quite a point landing during the measurement and is in the gaming loop with approx. 225 watts about as hungry as in the stress test. This is also due to exactly what Nvidia has written into the specs for this card. The 17 watts in the idle are a step backwards, but they are certainly due to the additional NVLink controller, which could probably charge 5 to 7 watts even when idle without active use.
In contrast to the older GeForce GTX 1080 FE, the voltages (VDCC) of the GeForce RTX 2080 are significantly lower. They also fall indirectly proportionally with the rise in temperature.

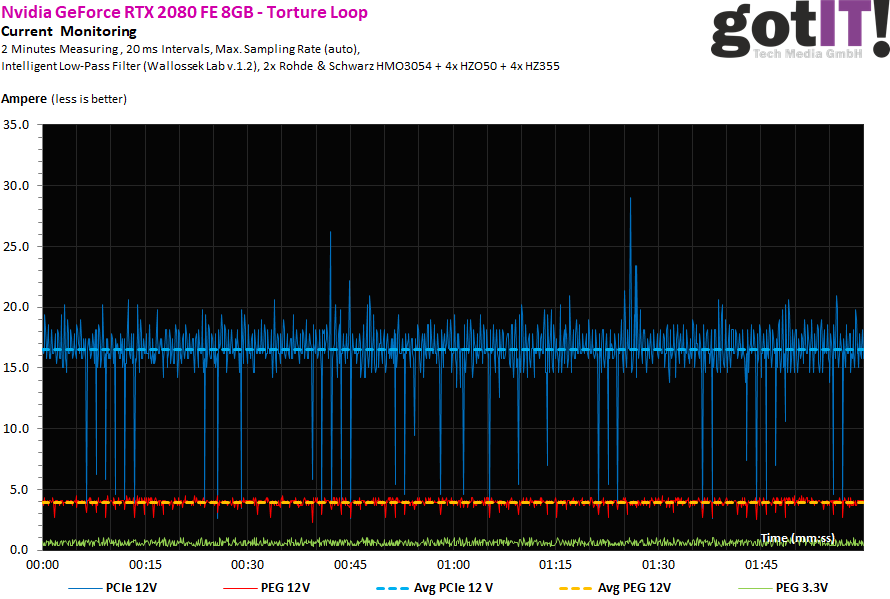
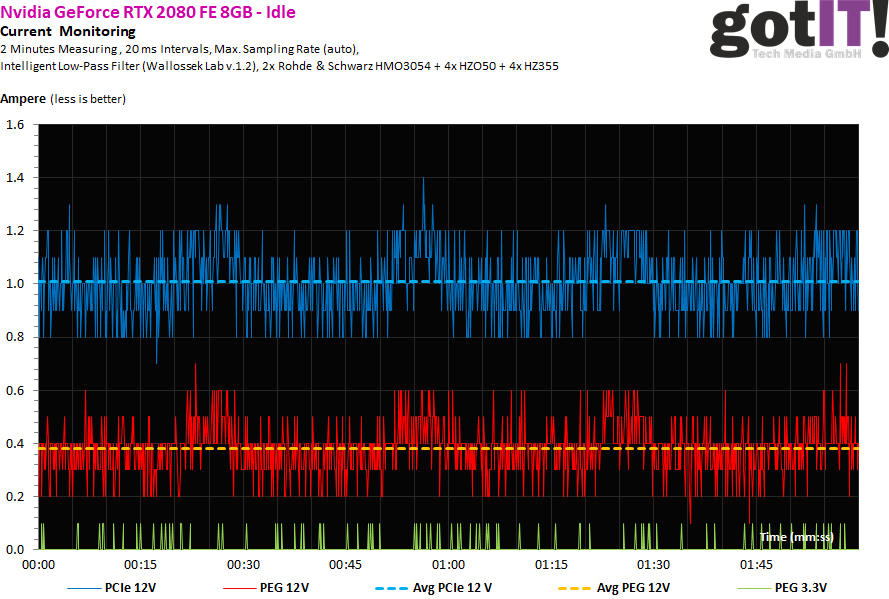
Let us now look at the load distribution on the rails. With a maximum of 4.3 amperes on the rail of the motherboard slot, you are fully within what the PCI SIG allows with a maximum of 5.5 amperes as the upper limit. The balancing works perfectly and also leaves enough room for a possible overclocking.
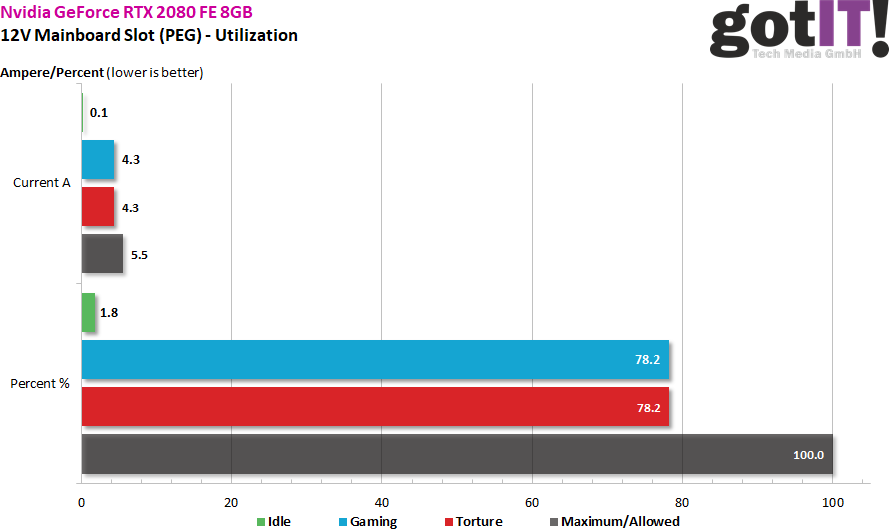
The two following image galleries show both the power consumption in the Idle, the Gaming and the Torture Loop, as well as the whole one once again separates for the measured currents.

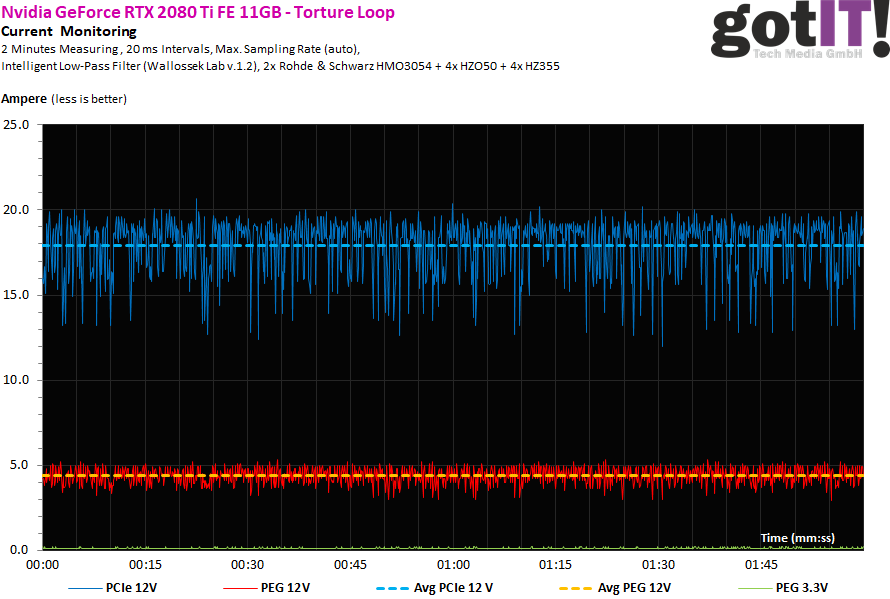
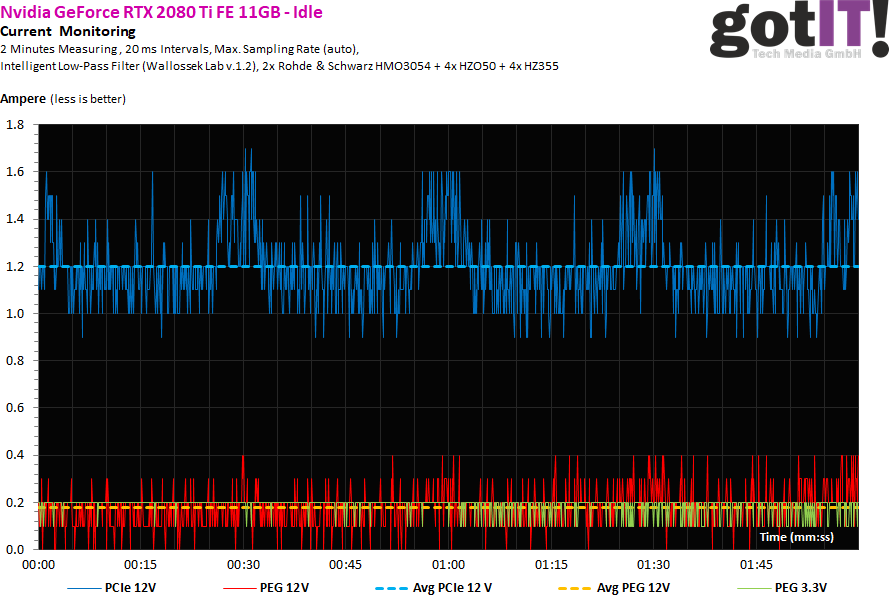
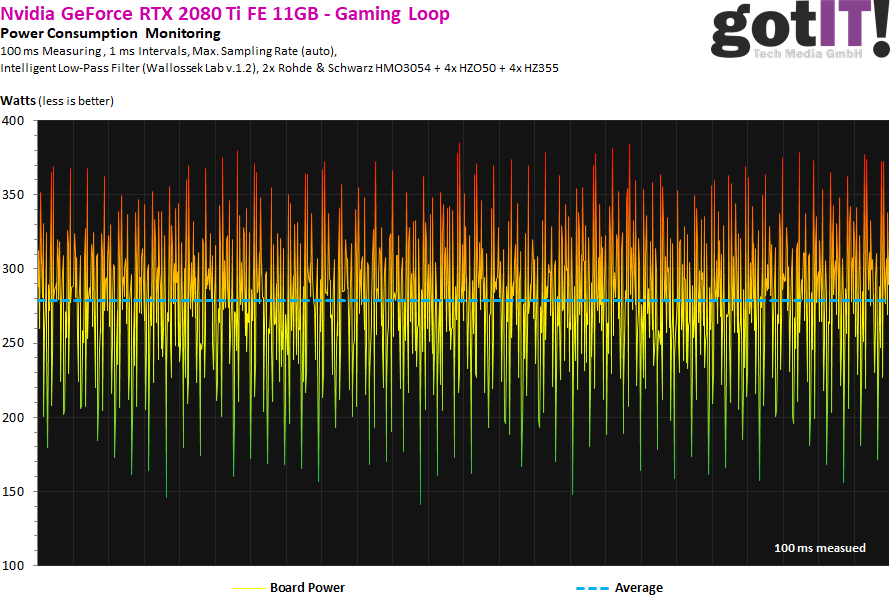
Power consumption of the GeForce RTX 2080 Ti FE
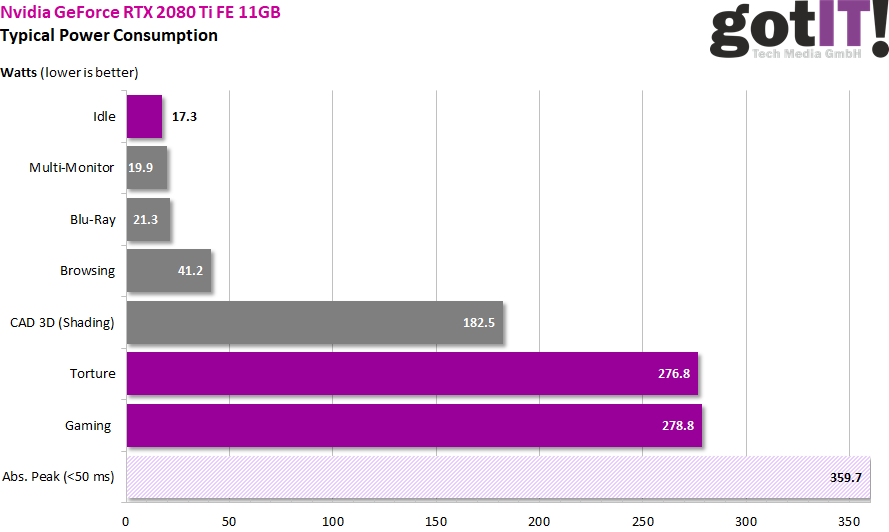
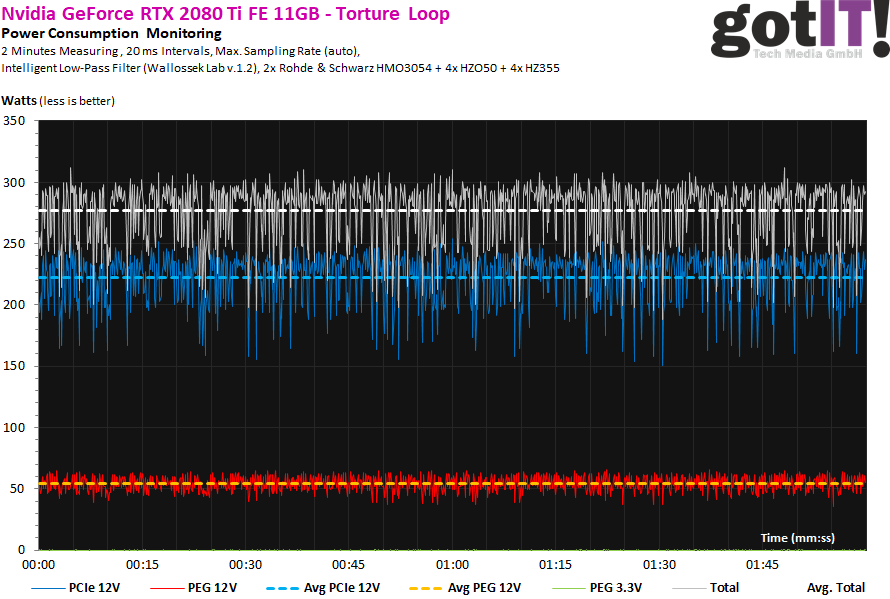
The GeForce RTX 2080 Ti is used for measurement with approx. 277 watts in the stress test and almost 279 watts in the gaming loop almost 20 watts above what Nvidia calls TBP. This is not dramatic at first, but not as exact as with the GeForce RTX 2080. The same 17 watts in the idle is a step backwards, but we just had that.
The voltage (VDDC) is well below the voltage of the GeForce RTX 2080 FE and decreases even further under load as the temperature of the card rises:
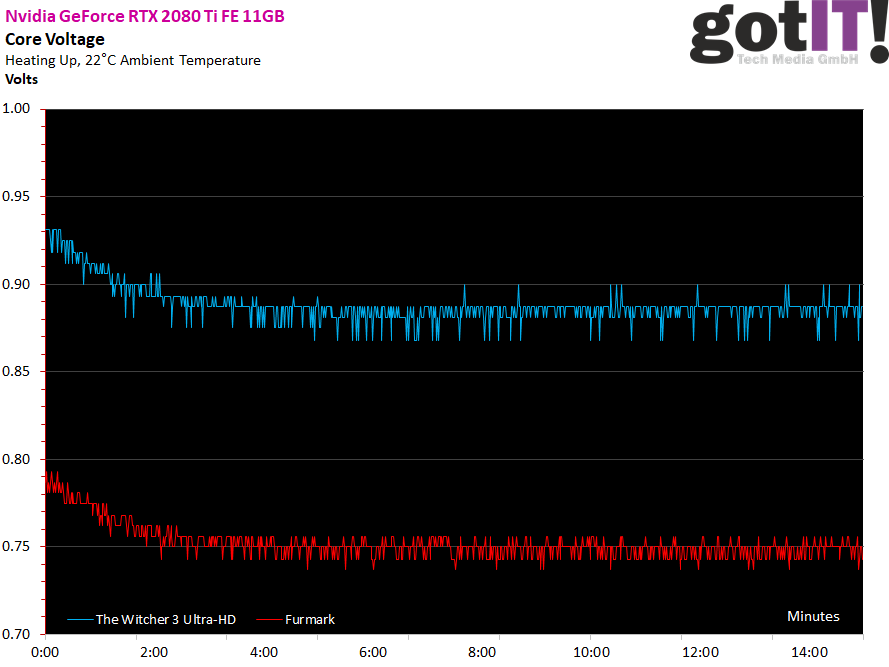
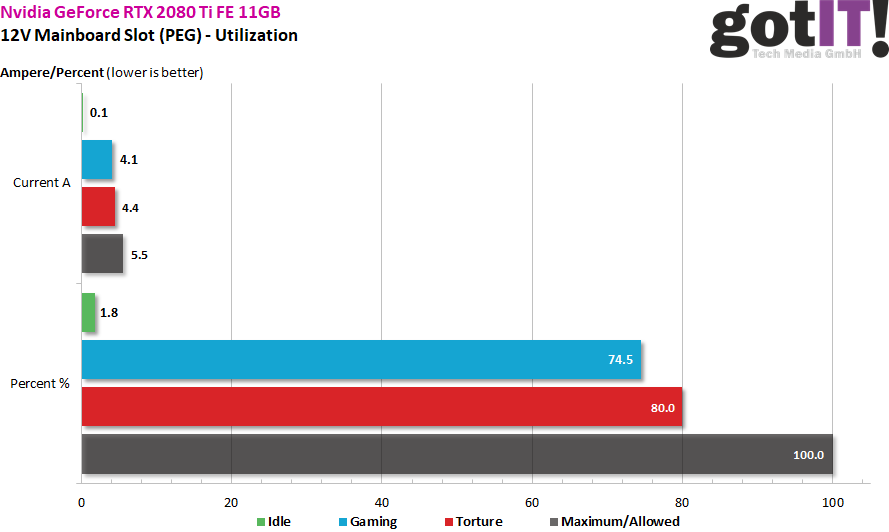
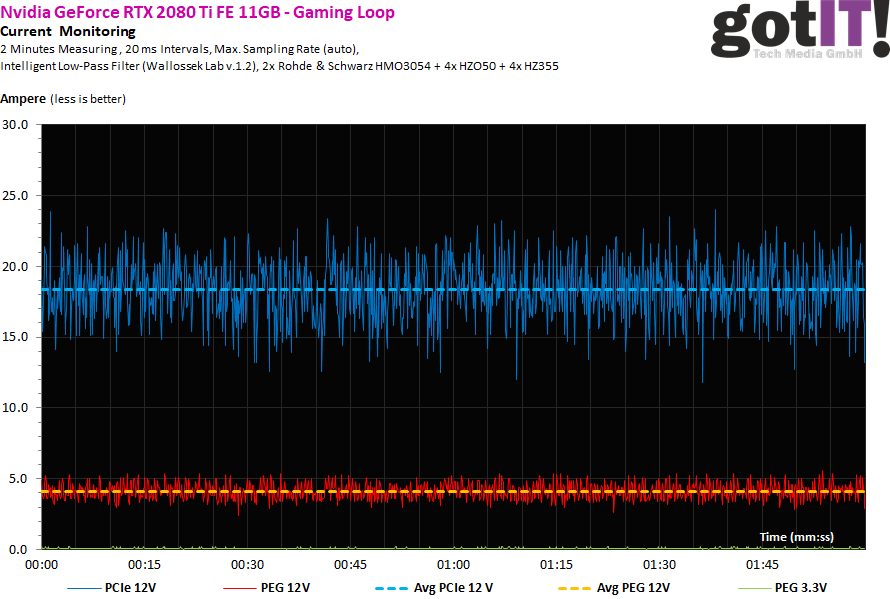
Let us now look again at the load distribution on the rails. With a maximum of 4.4 amperes on the rail of the motherboard slot, you are also fully within what the PCI SIG allows with a maximum of 5.5 amperes as the upper limit. Balancing works just as perfectly, leaving plenty of room for overclocking.
The two following image galleries show both the power consumption in the Idle, the Gaming and the Torture Loop, as well as the whole one once again separates for the measured currents.


Intermediate conclusion
Both cards are within what you might expect. Since the short test time did not leave enough resource for detailed measurements, which also require a longer preparation time due to the necessary precision for the low measurement intervals, we have to refer again to the follow-up. But I already have a little teaser, because I have never had such balanced curves. Anyone who remembers the theory launch and the section with the voltage converter sees this here for the first time in practice:
- 1 - Einführung, Unboxing, Daten
- 2 - RTX 2080 Ti - Platinenanalyse
- 3 - RTX 2080 - Platinenanalyse
- 4 - Raytracing in Echtzeit
- 5 - Deep Learning Super Sampling (DLSS)
- 6 - High Dynamic Range (HDR)
- 7 - Ashes of the Singularity: Escalation (DX12)
- 8 - Battlefield 1 (DX12)
- 9 - Destiny 2 (DX11)
- 10 - Doom (Vulkan)
- 11 - Tom Clancy’s The Division (DX12)
- 12 - Far Cry 5 (DX11)
- 13 - Forza Motorsport 7 (DX12)
- 14 - Tom Clancy’s Ghost Recon (DX11)
- 15 - Grand Theft Auto V (DX11)
- 16 - Metro: Last Light Redux (DX11)
- 17 - Rise of the Tomb Raider (DX12)
- 18 - The Witcher 3 (DX11)
- 19 - World of Warcraft: Battle for Azeroth (DX12)
- 20 - Leistungsaufnahme
- 21 - Takt, OC, Temperaturen, Infrarot
- 22 - Kühlerdetails und Lautstärke
- 23 - Zusammenfassung und Fazit


Kommentieren