


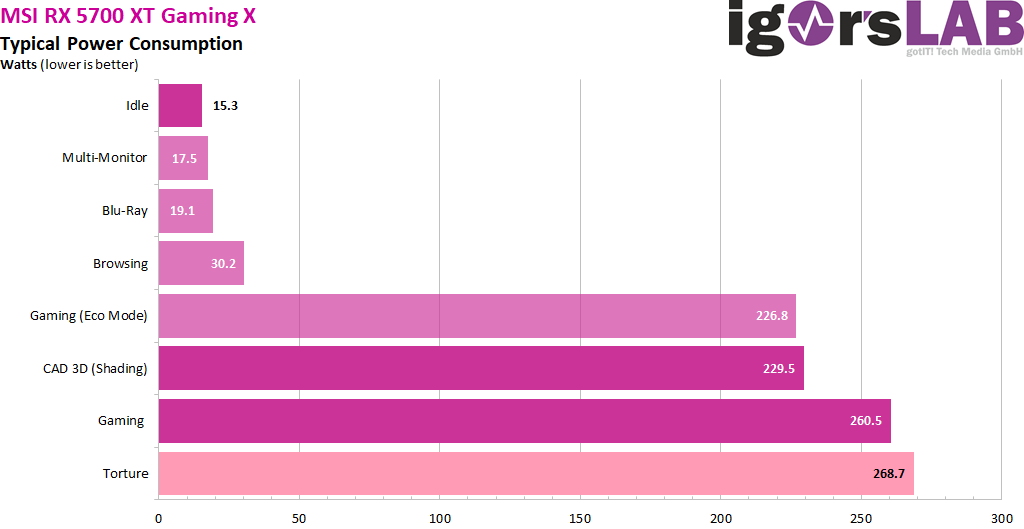
Power consumption and loads
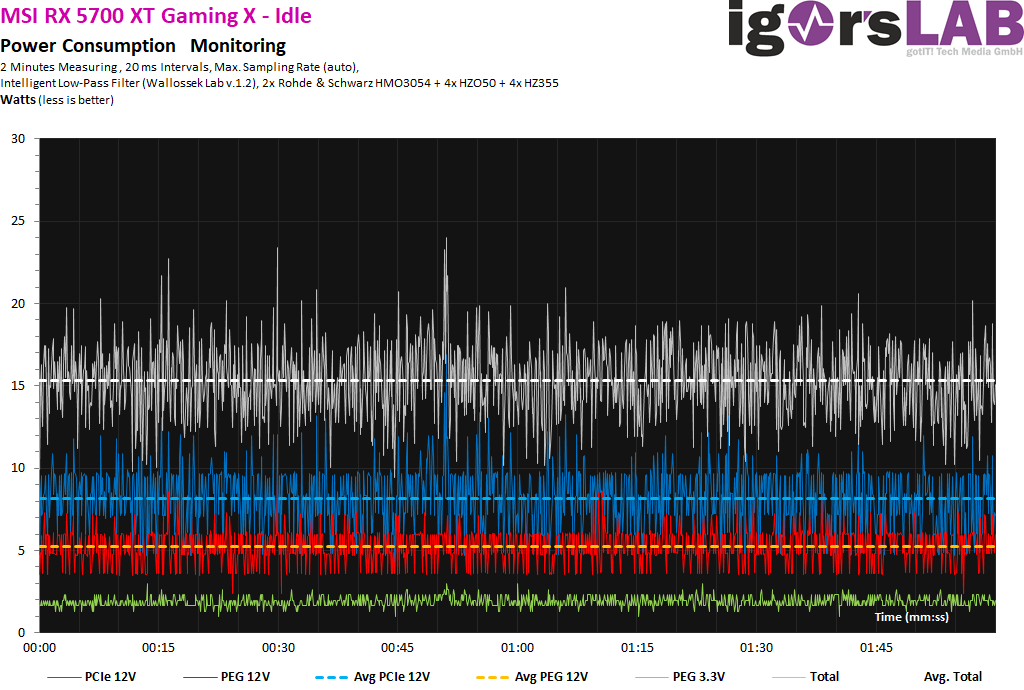
Let us first consider the power consumption in various load conditions from idle to absolute maximum as an average value over a longer measurement period. We measure our own Eco mode at just under 227 watts, which is pretty much what the reference card had consumed. At the factory it’s already over 260 watts, which means 35 watts more. Whether the surcharge on the wall-mounted dispenser is worth all that is up to everyone to decide for themselves.
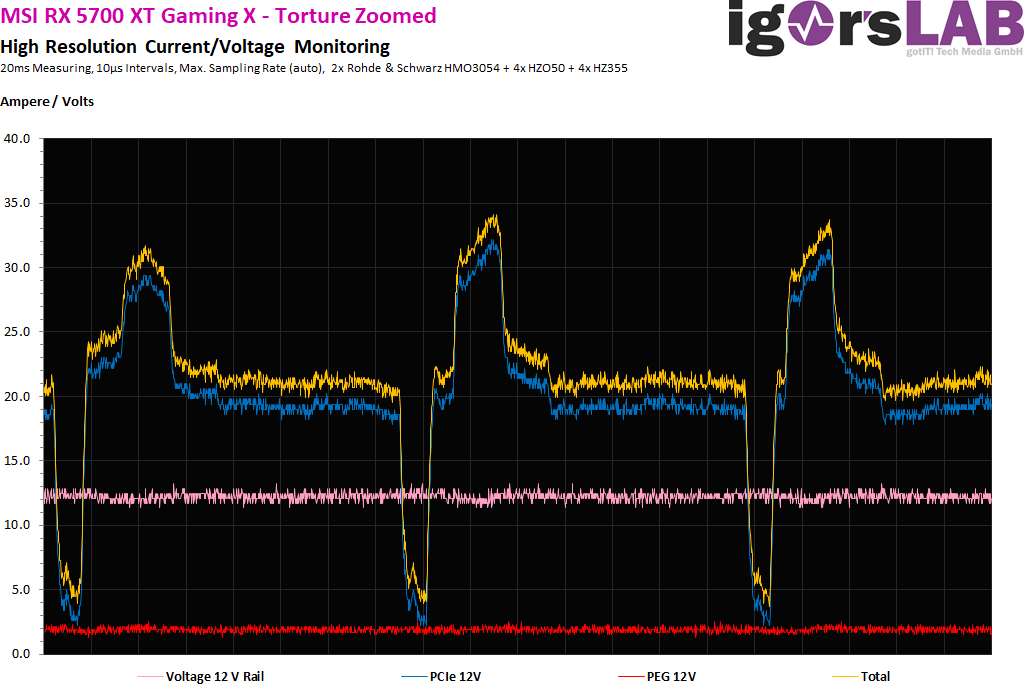
The temperature-dependent voltage curve is also interesting, because we see that the firmware activates the limiter at exactly 1.2 volts. Here you could of course release some more with the MorePowerTool. But do you really want that?

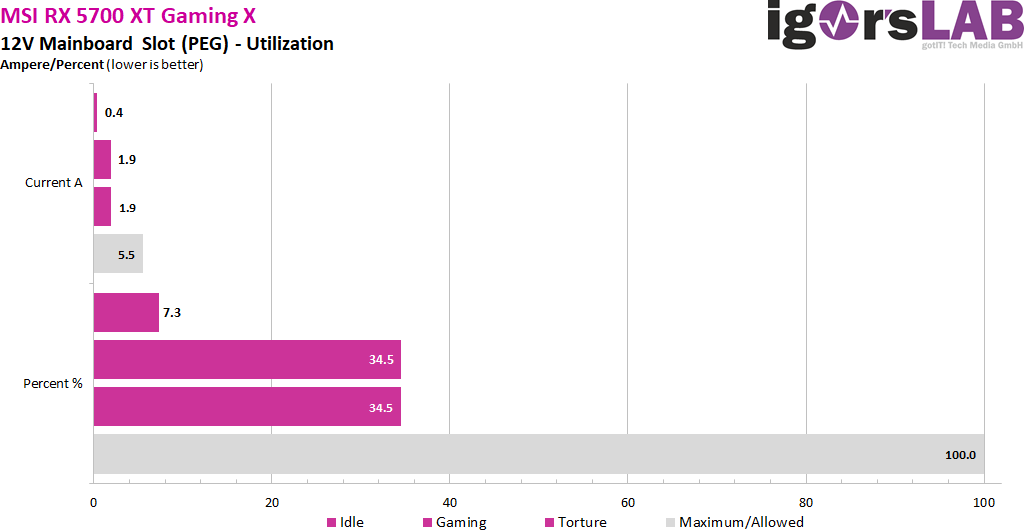
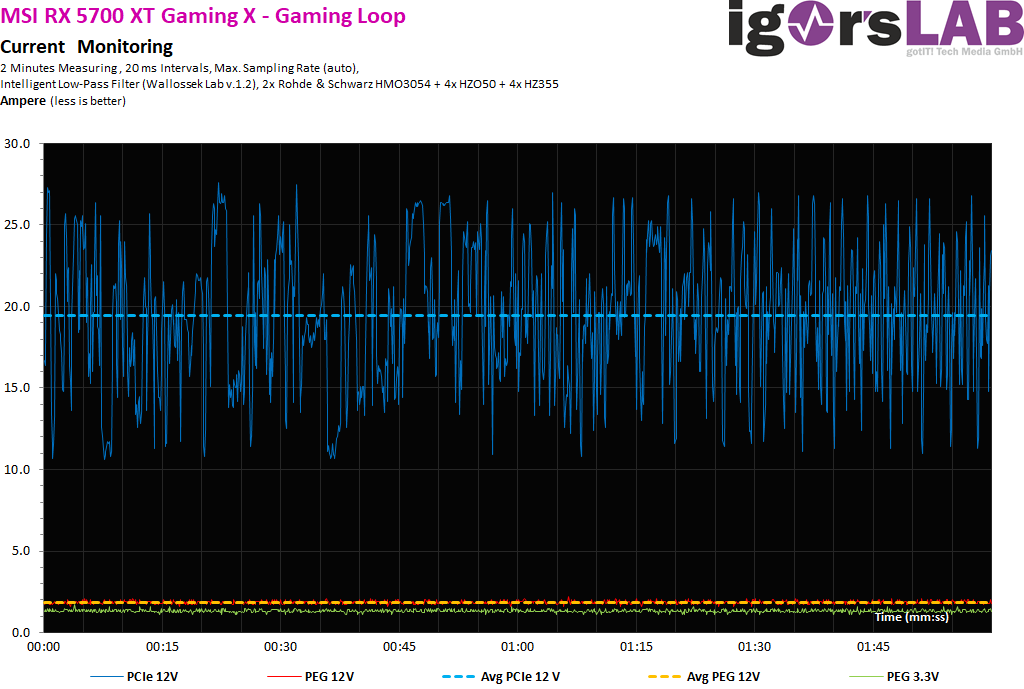
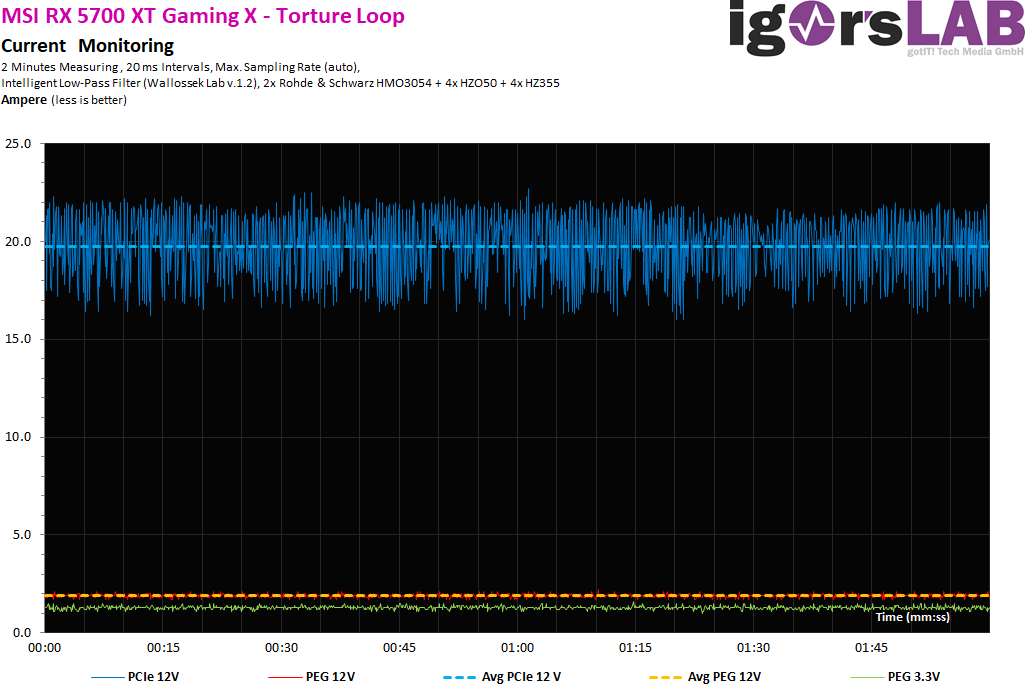
The load distribution on the rails is almost perfect, because the maximum permissible 5.5 amperes of the mainboard slot are never exceeded during normal operation and the stress test, on the contrary. The measured 1.9 amps are peanuts.
Power supply design and peak loads/currents
As I already proved in detail in my basic article “The fight of graphics card against power supply – power consumption and load peaks demystified”, there are also short-term higher loads in the millisecond range, which can already lead to inexplicable shutdowns in unfavorably designed or not appropriately equipped power supplies. The TBP (Typical Board Power) measured by the graphics card manufacturer or the reviewers alone does not really help here for a stable design of the system.
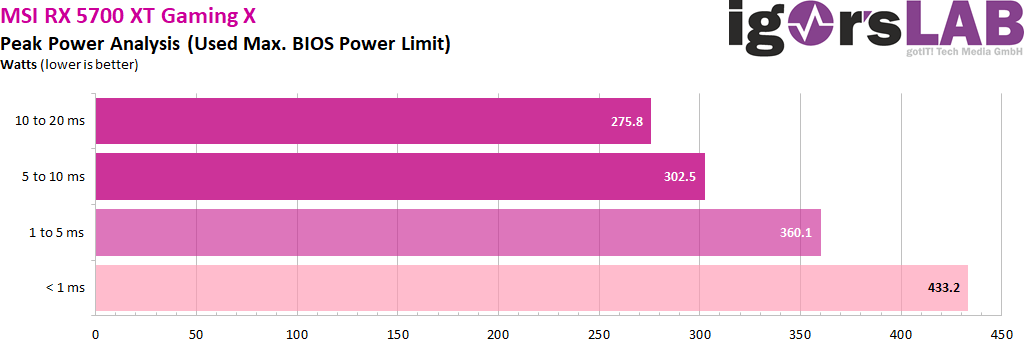
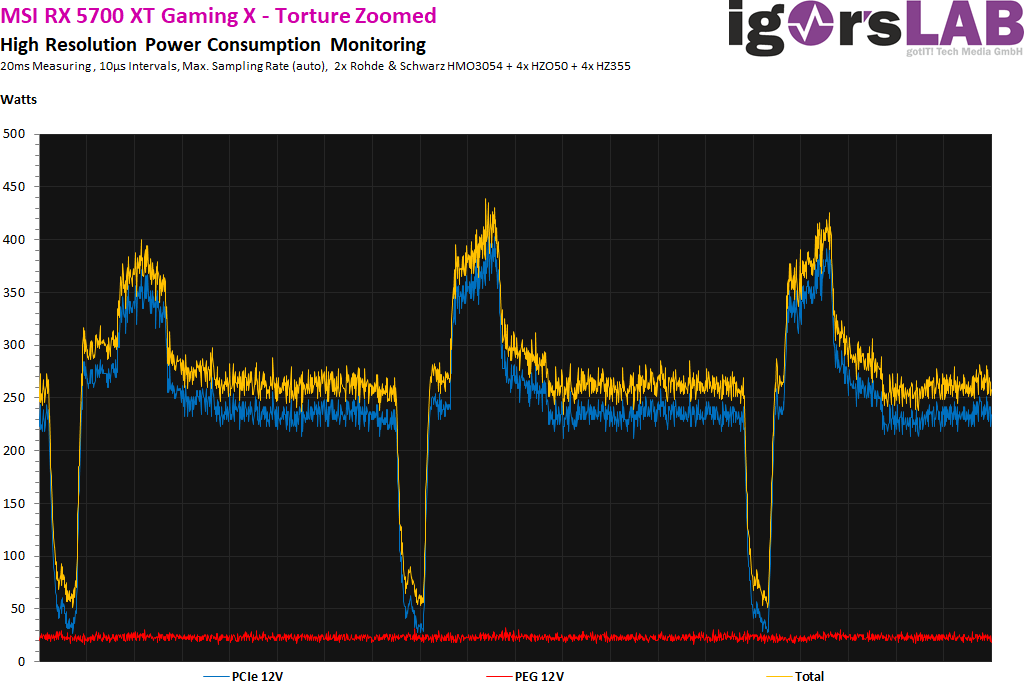
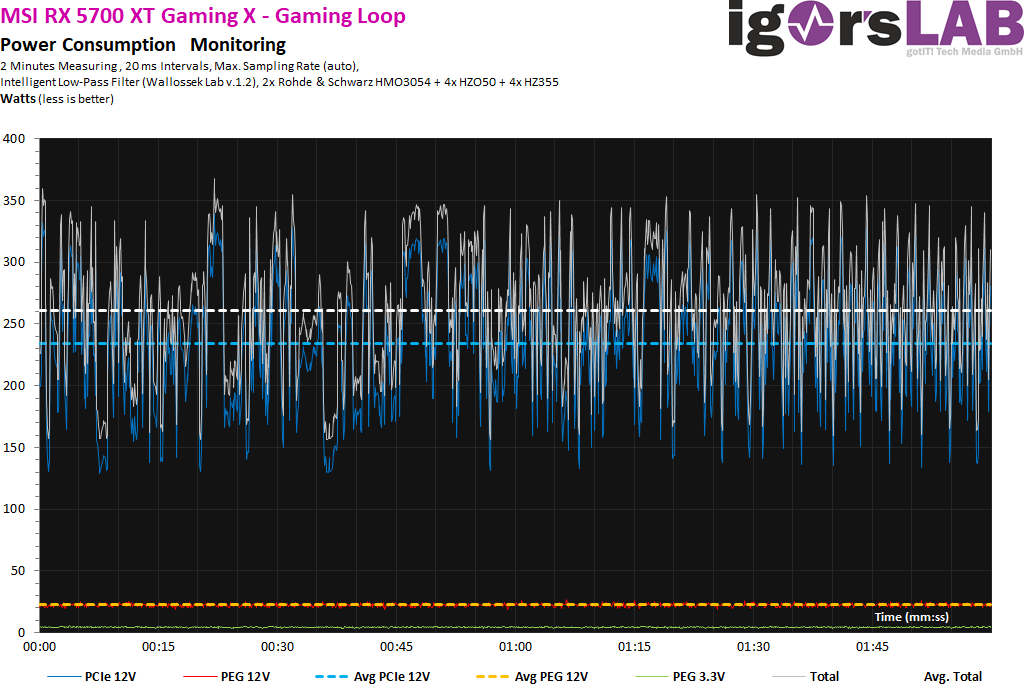
Peaks with intervals between 1 and 10 ms can lead to shutdowns with very fast reacting protective circuits (OPP, OCP), especially with multi-rail power supplies, even though the average power consumption is still within the standard. For this card, I would therefore calculate with a good 300 watts for the graphics card as such, in order to have sufficient reserves for the worst-case scenario. A short excerpt with higher resolution now shows us the 20 ms intervals, how I let them run automatically to determine the value:
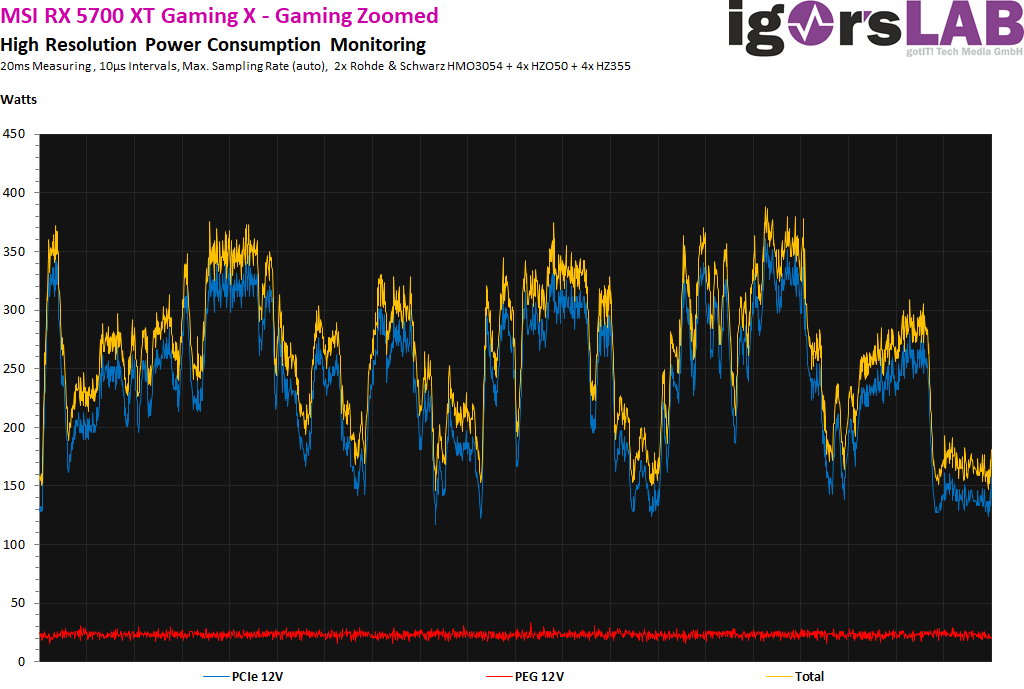
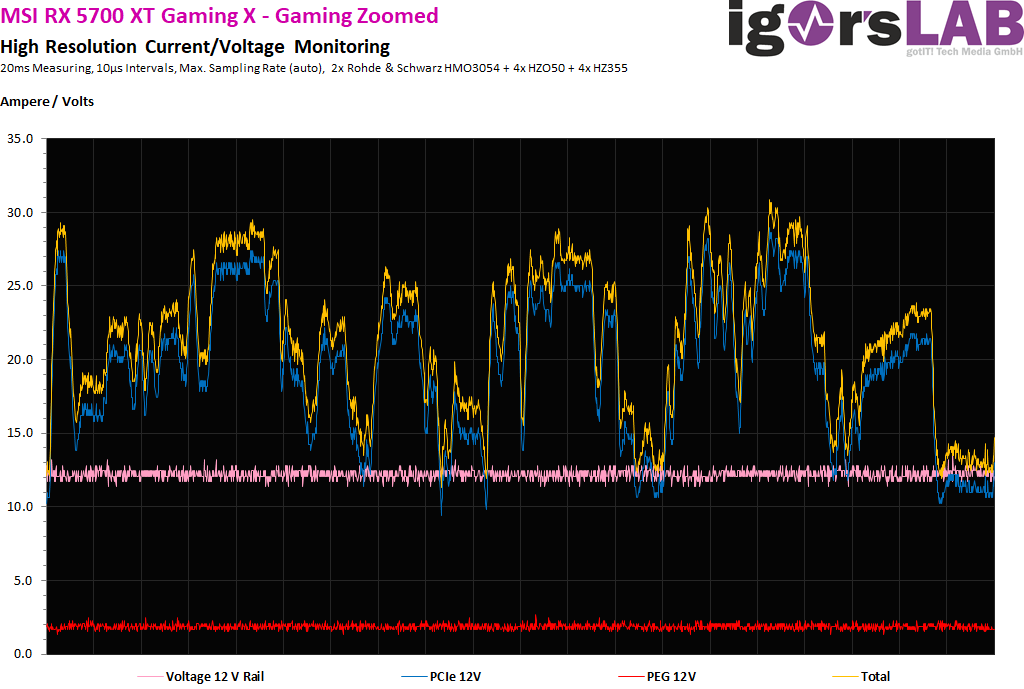
Detail view of average power consumption and flowing currents
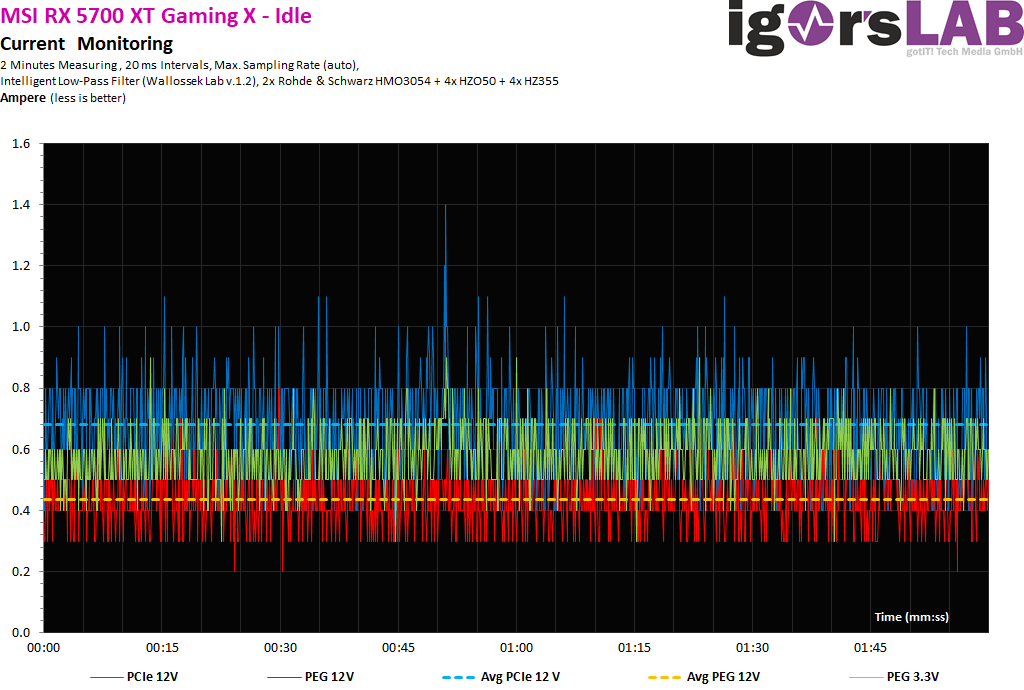
As usual, I now also put the power consumption and the flowing currents aside as detailed graphics of my oscillograph measurements. A service that hardly anyone else offers and that shows how the cards tick in detail:


Kommentieren