


Power consumption and compliance with standards
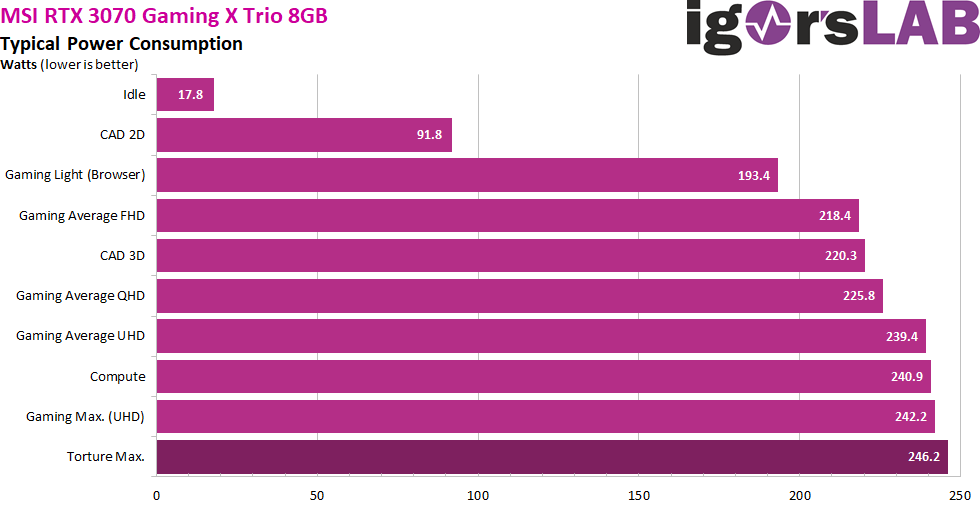
When it comes to power consumption, there are actually no big secrets, because what NVIDIA specifies as TGP is largely complied with. However, you’re relatively high with a good 18 watts in idle, thanks to the LED. The partial load ranges are realized relatively economically, which could also be due to the better controlled clock rate. However, the card achieves around 242 watts under real full load in the Witcher 3 with Ultra-HD and full warming, which is what the specs indicate. The following table now shows the maximum values of the respective load scenarios.
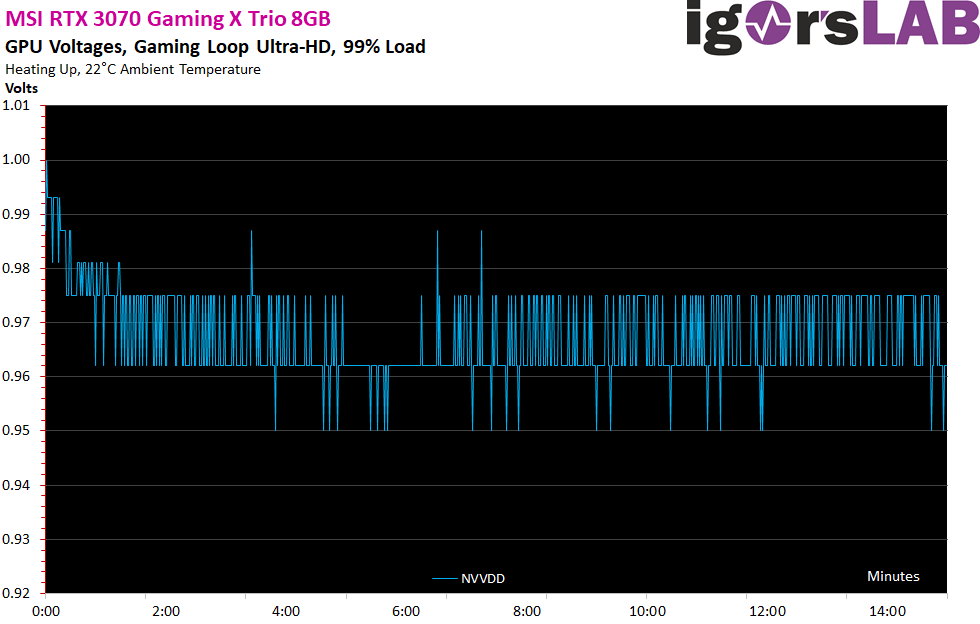
Now let’s have a look at the NVVDD, which is a little higher than the Founders edition.
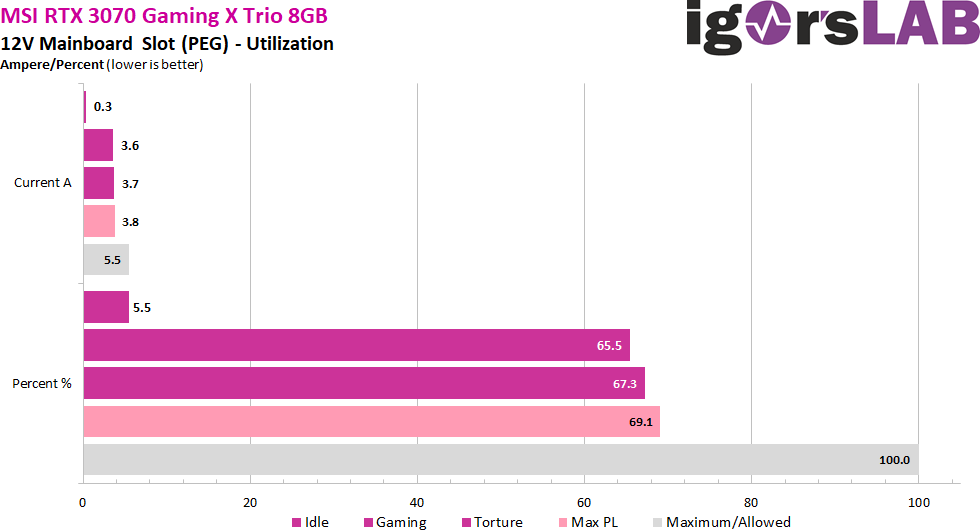
Let’s now move on to the load on the motherboard slot, whose load is specified by the PCI SIG as 5.5 amps. This results in a maximum power of 66 watts at 12 volts. You can see very clearly that under full load only between 3.6 and 3.8 amperes are reached, which is exemplary.
Transients and power supply recommendation
As I have already proved in detail in my basic article “The battle of graphics card against power supply – power consumption and load peaks demystified”, there are also higher loads in the millisecond range, which can lead to unexplainable shutdowns in the case of unfavorably designed or improperly equipped power supplies. The TBP (Typical Board Power) measured by the graphics card manufacturer or the reviewers alone does not really help in this case for a stable system design.
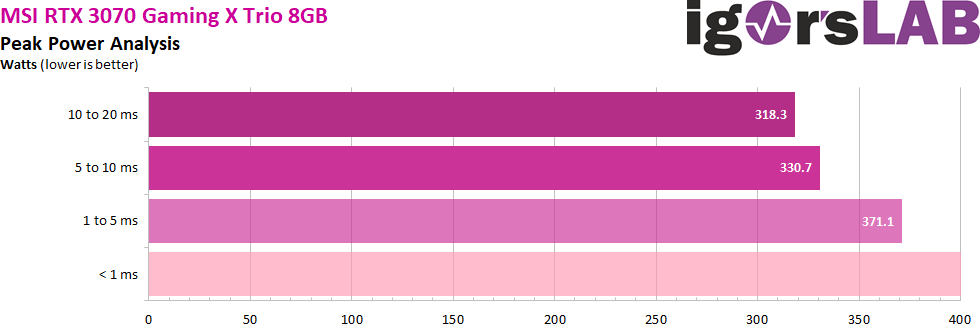
Peaks with intervals between 1 and 10 ms can lead to shutdowns in very fast reacting protective circuits (OPP, OCP), especially in multi-rail power supplies, although the average power consumption is still within the standard. For this card, I would therefore calculate at least 350 to 370 watts as graphics card load for the normal-OC, proportionally to the secondary side total power consumption of the system, in order to have enough reserves for the worst case scenario. A short excerpt with higher resolution shows us now the 20 ms measurements (10 μS intervals), as I let them run automatically for value determination:
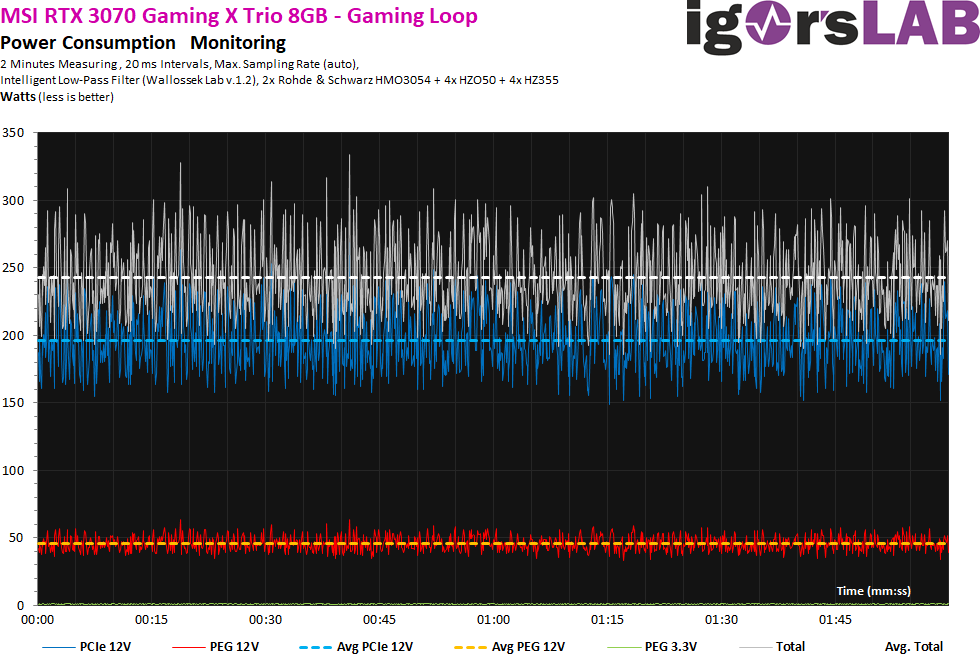
The power consumption in gaming and torture test in detail
First I compared the power consumption during the Gaming Loop. The power limit of the graphics card is 240 watts
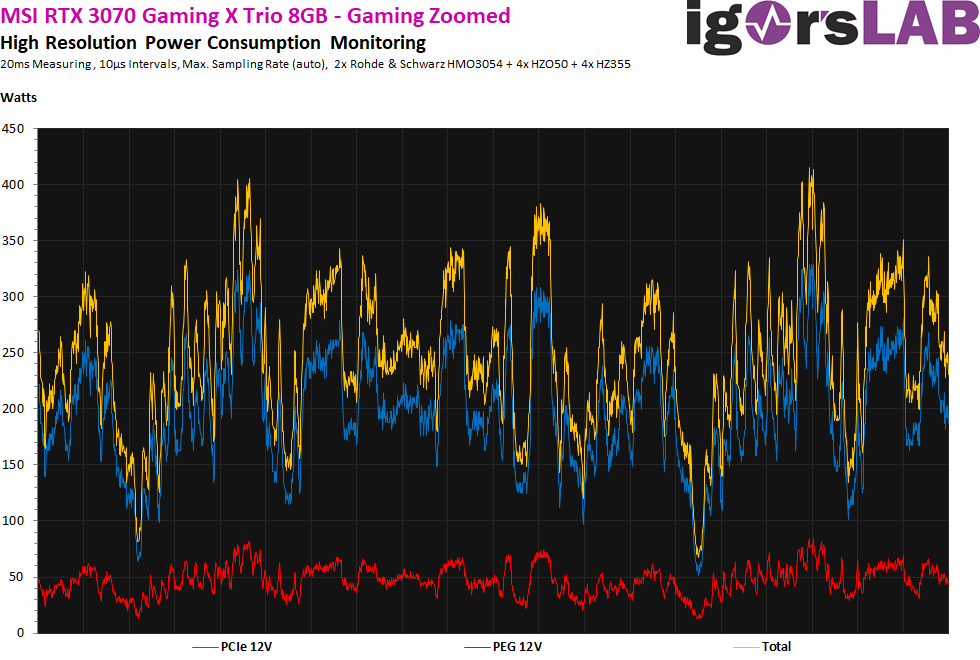
The problem with this resolution of 20 ms is that you can’t see the right spikes either, because they get lost in the averaged acquisition and are simply accumulated broken. Let’s therefore switch to the microsecond range, where NVIDIAS Boost also operates. And lo and behold, the spikes are now also clearly visible.
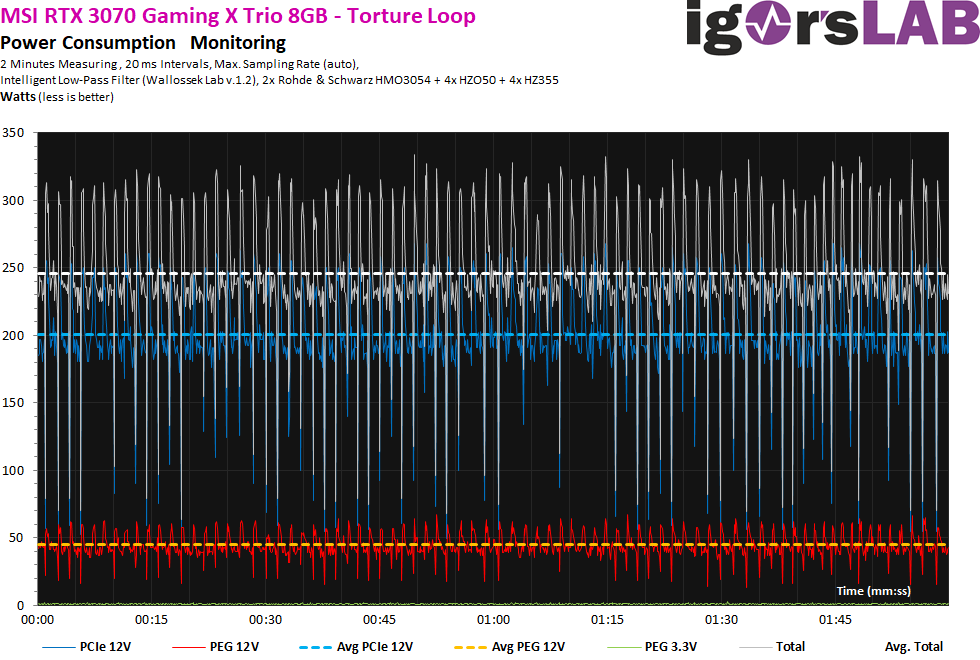
In the stress test, one sees a significantly more relaxed control curve, albeit with various slumps:
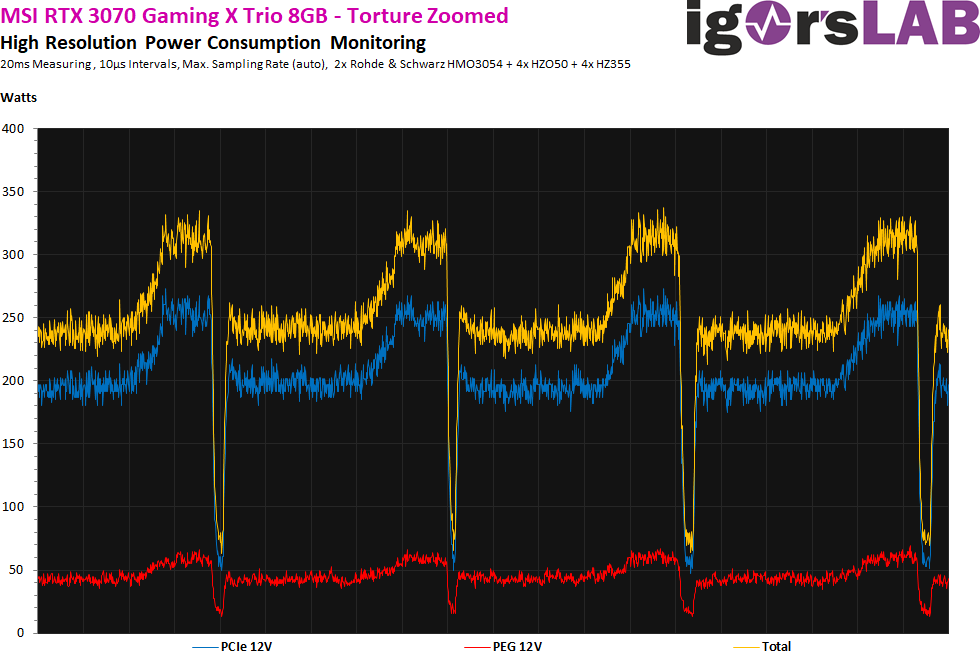
Where these dips come from, shows and the analogous to the boost running measurement in the microsecond range, where you can also see the self-protection very nice:


Kommentieren