


Power consumption and compliance with standards
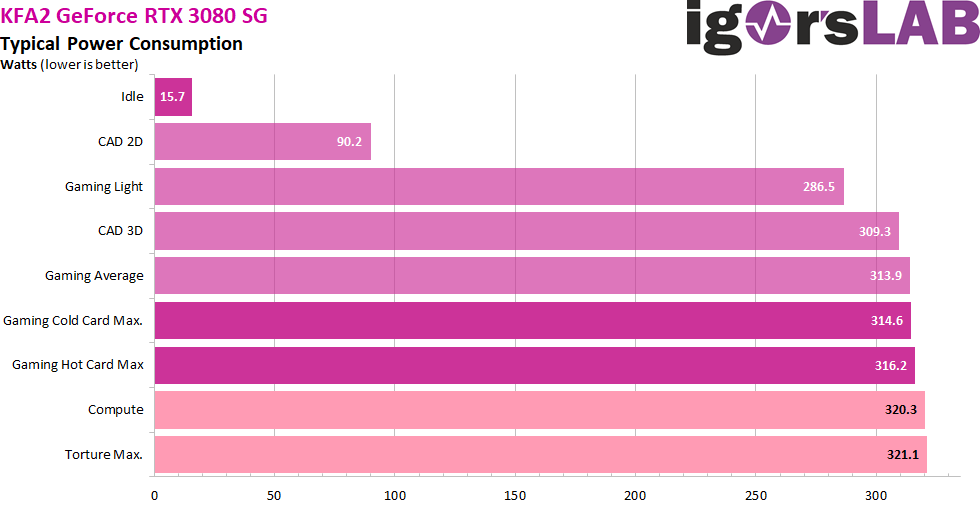
When it comes to power consumption, there are actually no big secrets, because what NVIDIA specifies as TGP is largely complied with. With just under 16 watts in idle, one is in the range of many board partner cards of the GeForce RTX 2070 Super to RTX 2080 Ti, even if relatively high. The partial load ranges are realized relatively economically, which could also be due to the better controlled clock rate. However, the card reaches 314 watts under real full load in the Witcher 3 with Ultra-HD and full warming, which is 6 watts less than stated in the specs. This, however, is the result of the slightly modified drivers with lower load peaks. The following table now shows the maximum values of the respective load scenarios.
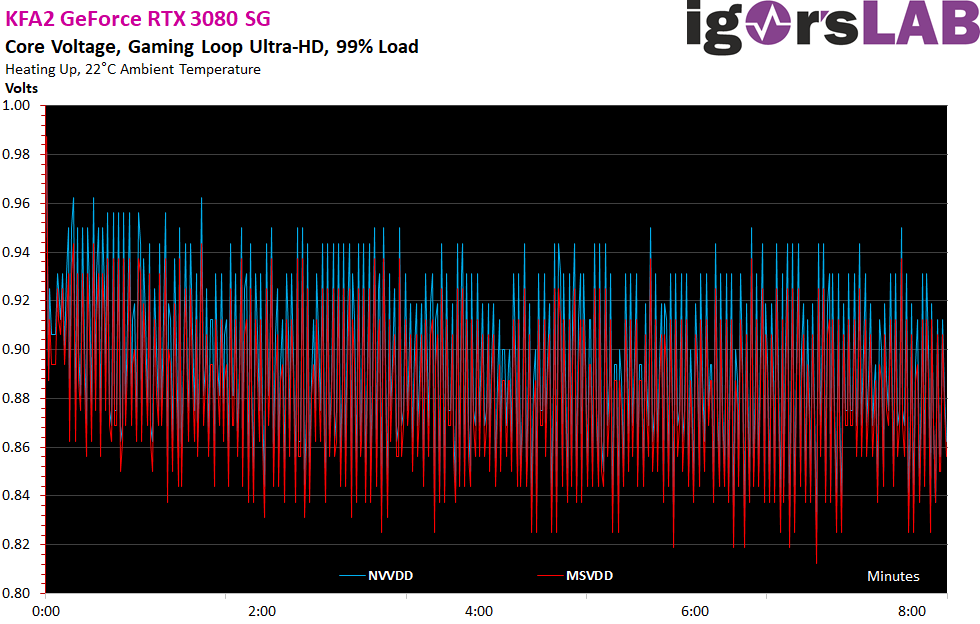
Now let’s compare the voltage (NVDD vs. MSVDD). which can (technically speaking) be between 0.7 and 1.2 volts at Ampere and which for safety reasons rarely breaks the 1-volt limit on normal consumer cards. You can see very clearly from the curve that the slightly warmer card operates with less voltage changes.
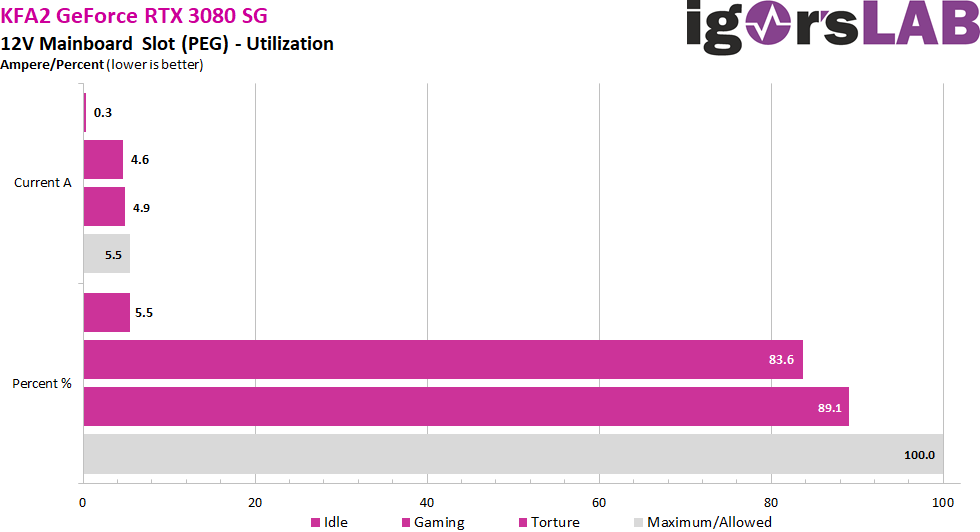
Let’s now move on to the load on the motherboard slot, whose load is specified by the PCI SIG as 5.5 amps. This results in a maximum power of 66 watts at 12 volts. You can see very clearly that under full load almost 5 amperes are reached again, which is of course permissible. But it is still much more than most Turing cards, probably also to relieve the 12-pin connector of the 12-volt rail.
Transients and power supply recommendation
As I have already proved in detail in my basic article “The battle of graphics card against power supply – power consumption and load peaks demystified”, there are also higher loads in the millisecond range, which can lead to unexplainable shutdowns in the case of unfavorably designed or improperly equipped power supplies. The TBP (Typical Board Power) measured by the graphics card manufacturer or the reviewers alone does not really help in this case for a stable system design.
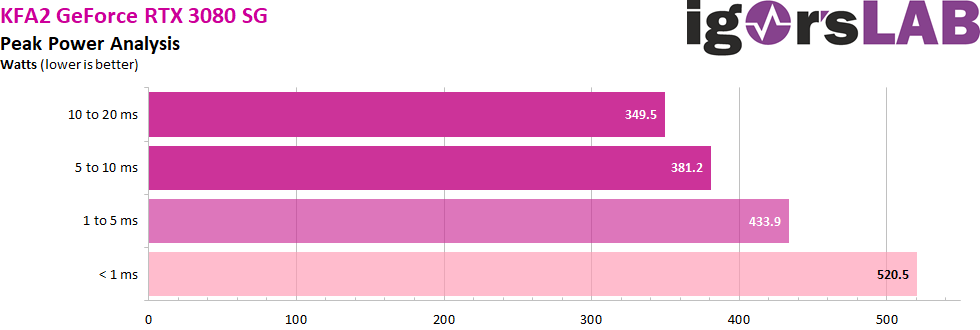
Peaks with intervals between 1 and 10 ms can lead to shutdowns in very fast reacting protective circuits (OPP, OCP), especially in multi-rail power supplies, although the average power consumption is still within the standard. For this card, I would therefore calculate at least 430 to 450 watts as graphics card load for the normal OC, proportionally to the total secondary power consumption of the system, in order to have enough reserves for the worst case scenario. A short excerpt with higher resolution shows us now the 20 ms measurements (10 μS intervals), as I let them run automatically for value determination:
The load change behaviour with old and new driver
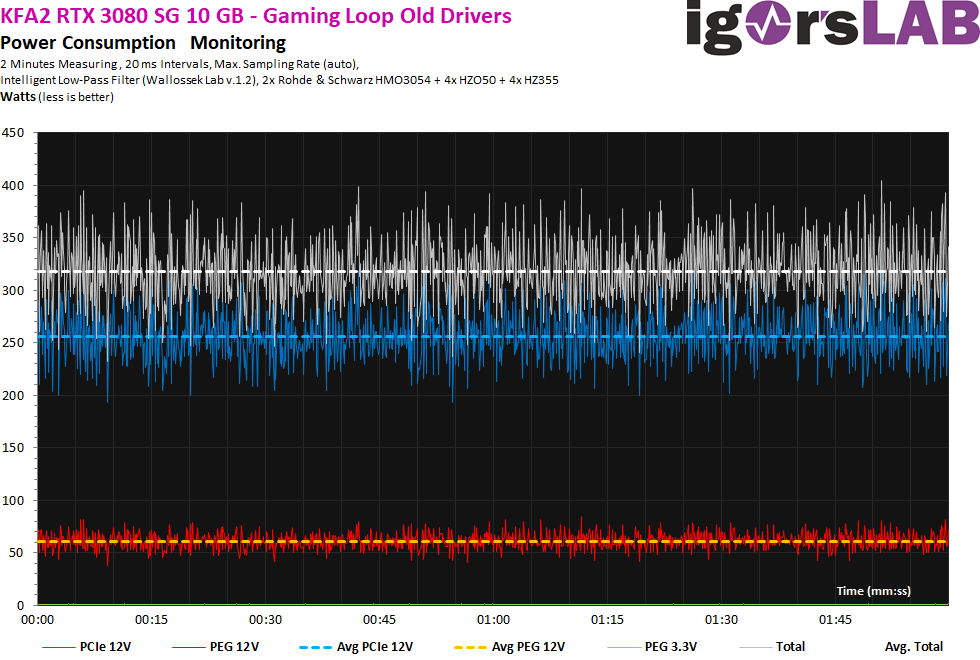
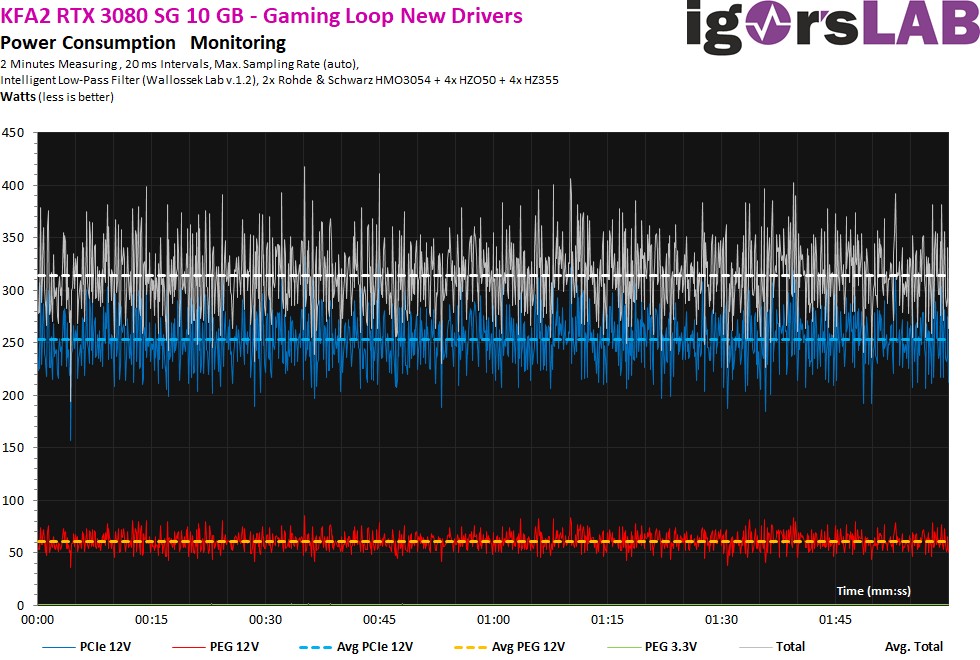
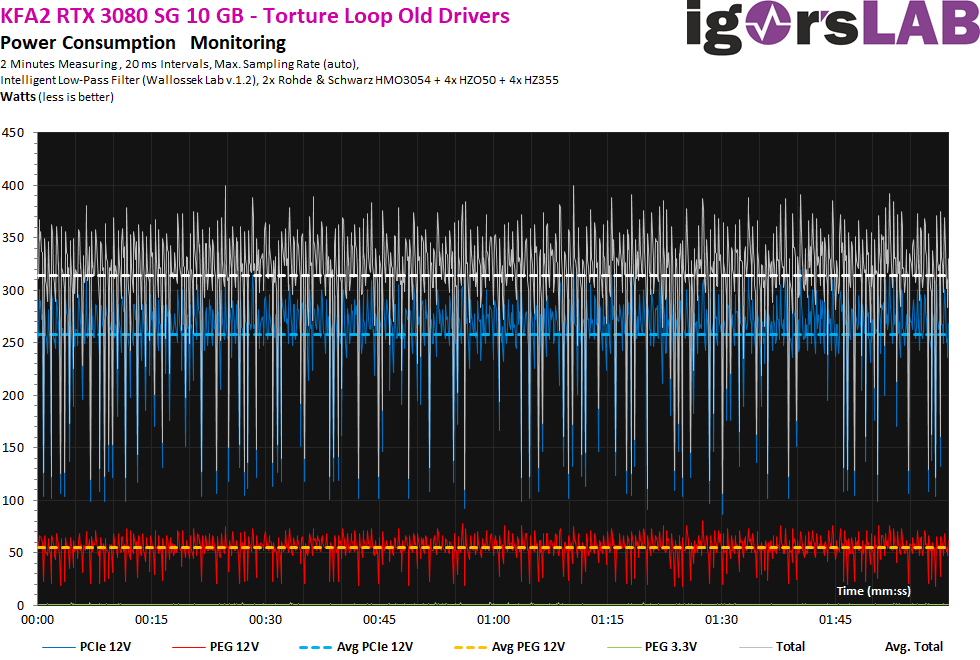
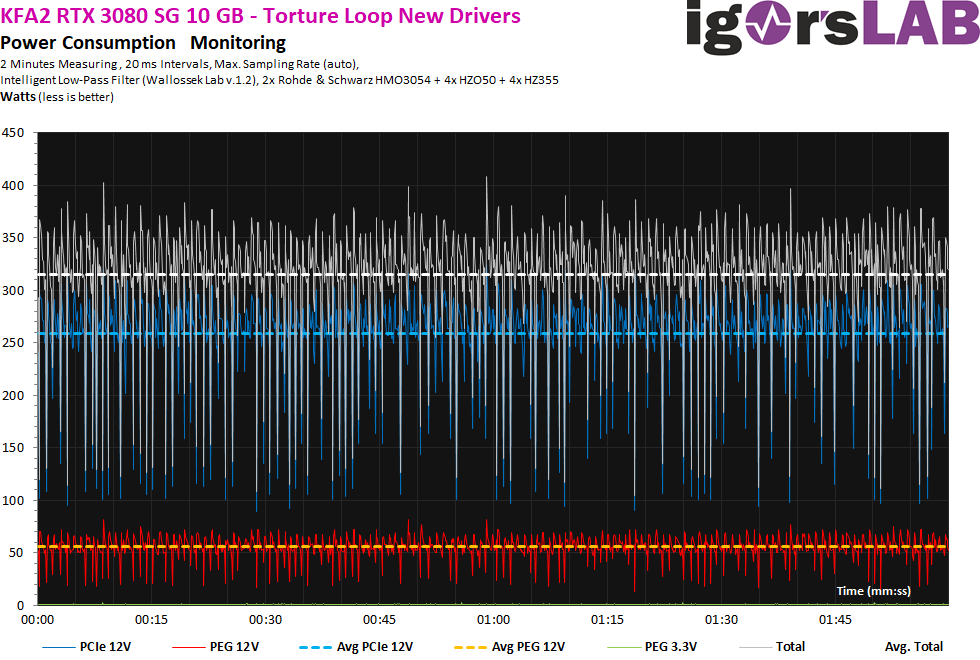
First I compared the power consumption during the Gaming Loop. The power limit of the graphics card is 320 watts, I reached 318 watts with the old driver. With the new driver it was then 4 watts less with 314 watts. This is less than expected as a difference, but really requires proper equipment that really records almost all load values. The higher the resolution, the more fluctuating were the measurements with the same card in the same savegame. Everything from approx. 10 ms as interval limit was simply no longer clean to be able to speak of proper tolerance ranges.
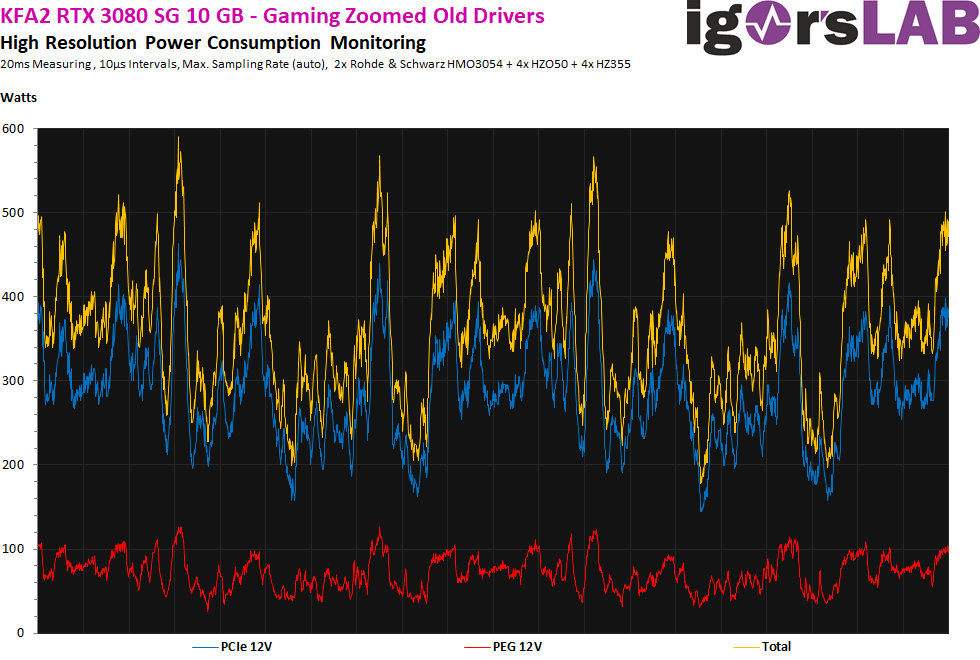
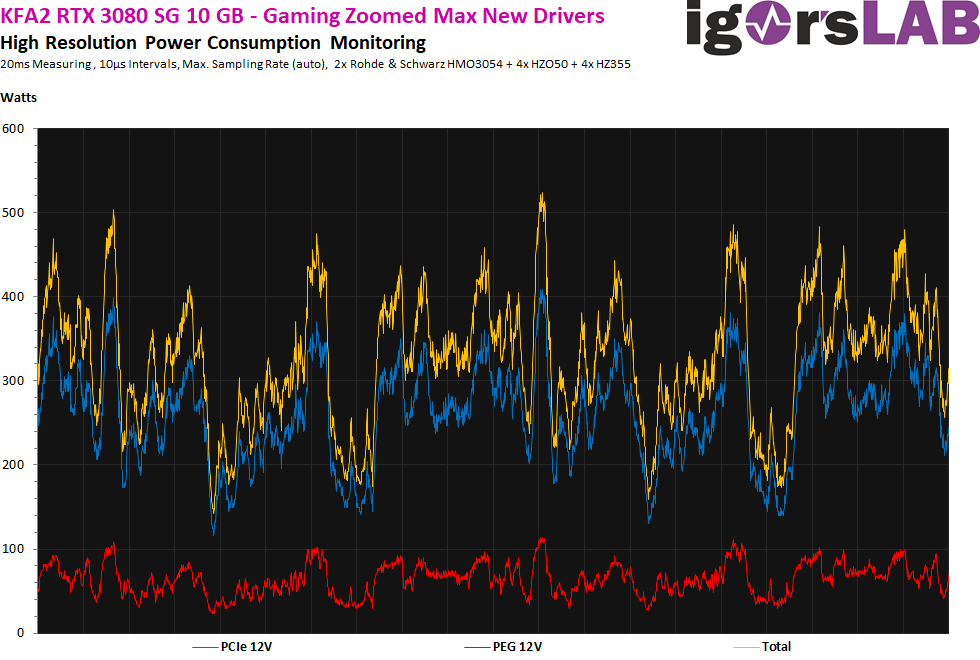
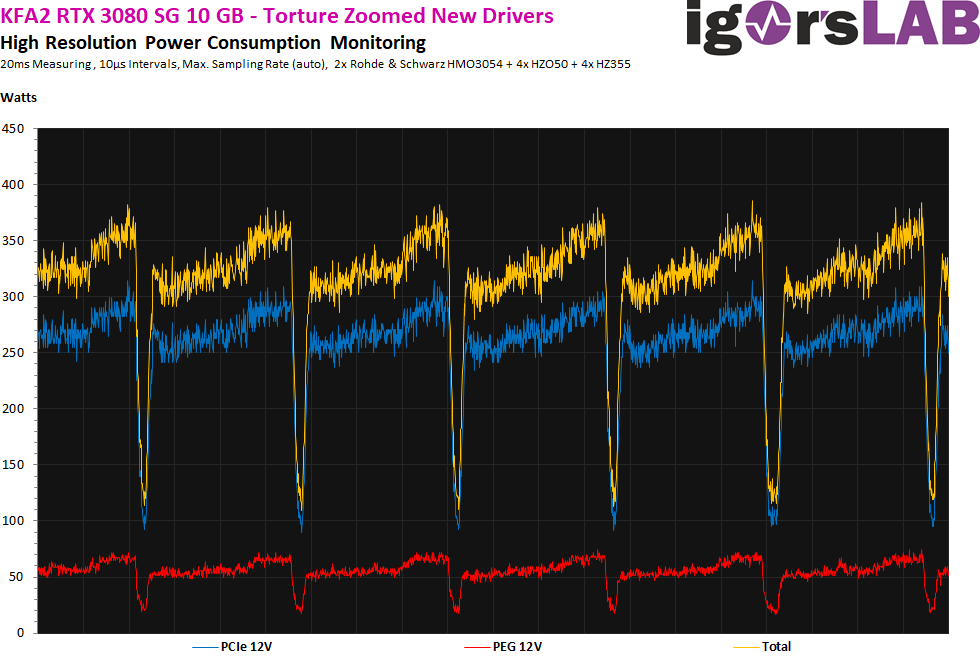
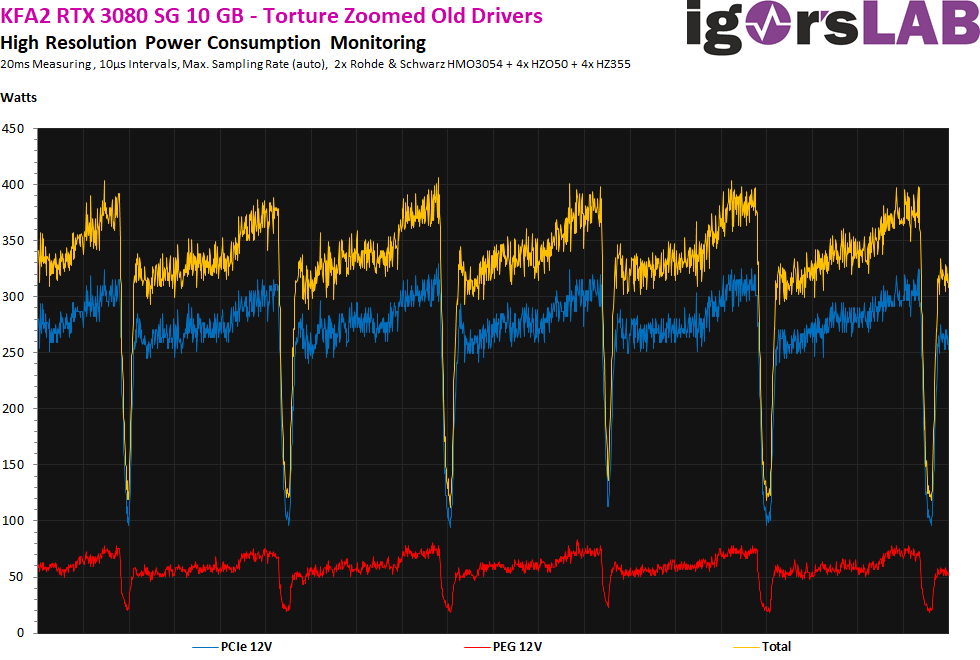
The problem with this resolution of 20 ms is that you can’t see the right spikes either, because they get lost in the averaged acquisition and are simply accumulated broken. Let’s therefore switch to the microsecond range, where NVIDIAS Boost also operates. And lo and behold, the spikes are now also clearly visible. Exactly here we see the real difference with the spikes! While with the old driver it was often between 580 and 600 watts, it is now suddenly at least 70 watts less and also the characteristic and frequency decreases strongly! So we can see very well where the missing 4 watts have gone. Not on average, no, but predominantly in the maximum peaks! This is also one of the reasons why the loss of performance should turn out to be manageably small in the end. Control rage slowed down, visible.
You can see the differences in a different way in the stress test, because the 20 ms intervals help us even better optically, interestingly enough. In direct comparison, we see that the intervals of power limitation have become significantly smaller, so the card reacts much faster to supposed or real overloads. Let us first compare the large intervals and pay attention to the distances and shape of the dips:
Where these dips come from, shows and the analogous to the boost running measurement in the microsecond range, where you can also see the self-protection very nice:


Kommentieren