


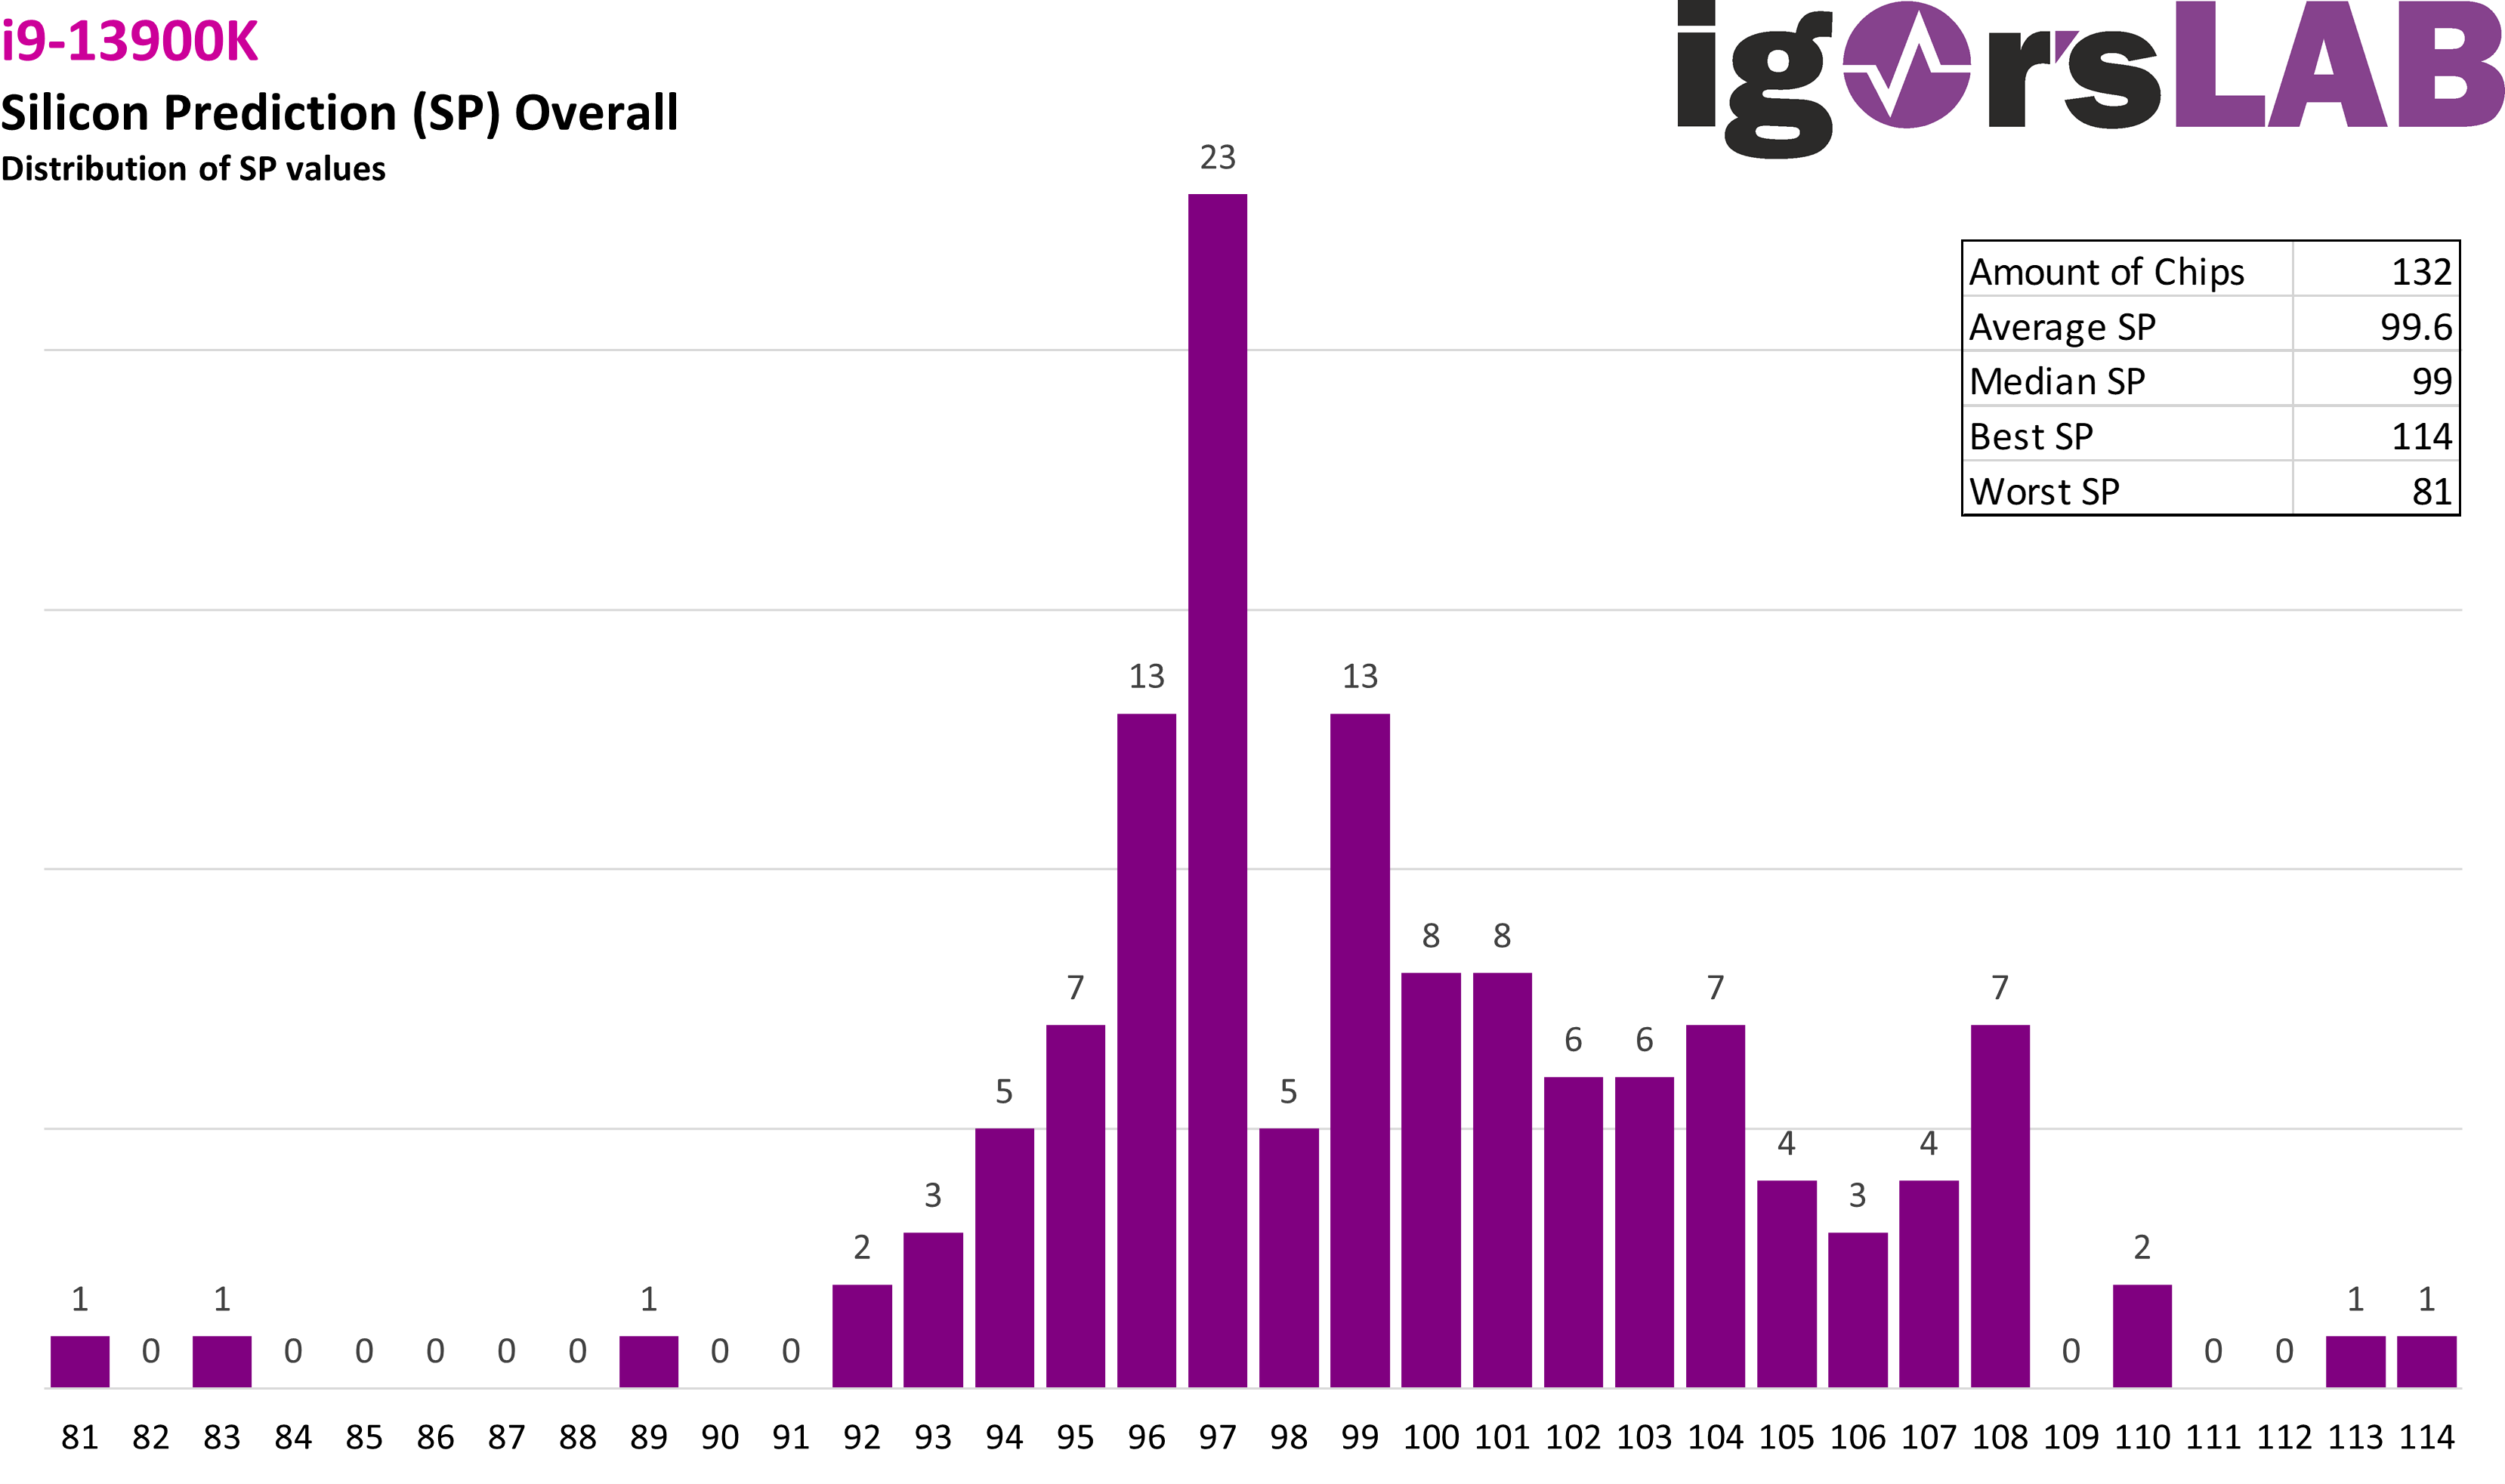
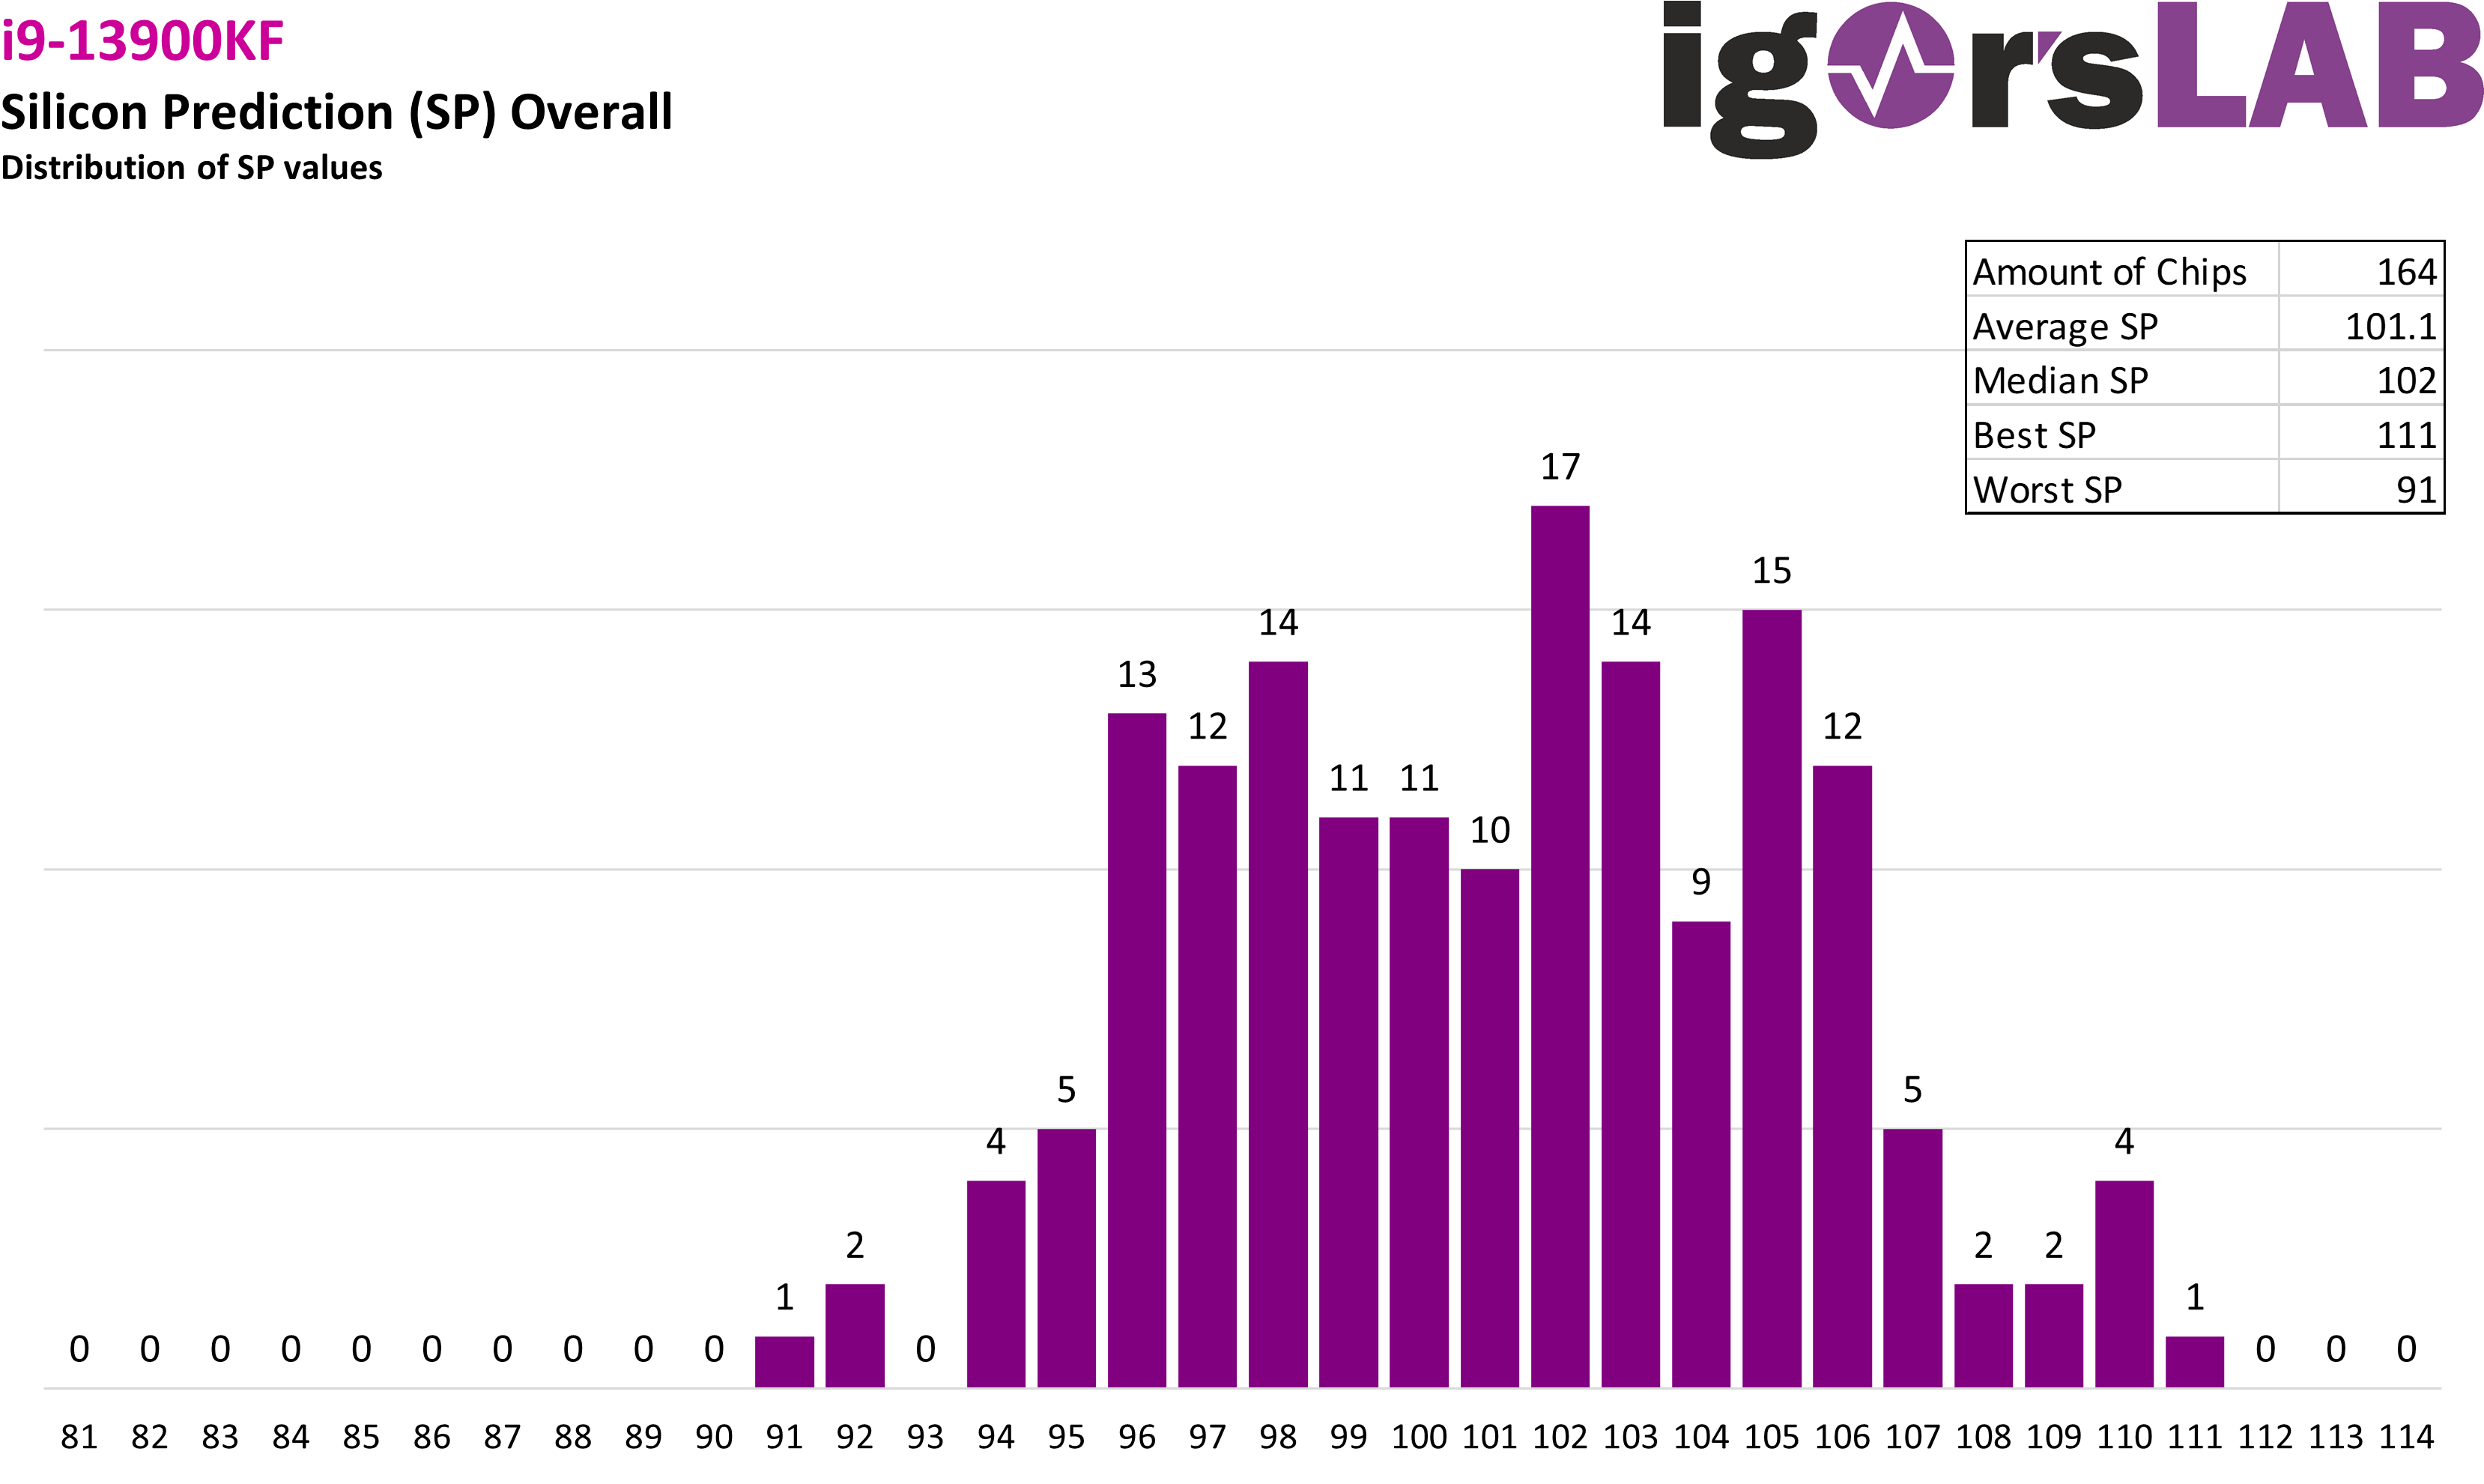
But let’s finally start with a look at the binning data. Here I have now once grouped the total/overall SP value by frequency and deliberately chosen the same scale on the X-axis for both i9 CPU SKUs. We were able to test a total of almost 300 of the top-end Raptor Lake chips, with and without iGPU. It is noticeable that the SP values are more scattered in the 132 13900K chips and there are more outliers towards the left, but also towards the right. On the other hand, all SP values recorded for the 164 13900KF chips cluster around the center of the diagram. However, the average SP is almost the same for both chip types with 99.6 and 101.1, respectively.


31 Antworten
Kommentar
Lade neue Kommentare
Urgestein
Veteran
Mitglied
Veteran
Mitglied
Veteran
1
Urgestein
Moderator
Mitglied
Urgestein
Urgestein
Veteran
Mitglied
Urgestein
Urgestein
Mitglied
Urgestein
Urgestein
Alle Kommentare lesen unter igor´sLAB Community →