


In keeping with today’s date, we continue with our Intel Raptor Lake silicon lottery data today, namely with the overclockable i7 and i5 SKUs. So whether your 13th Gen chip is a winner or a loser, you can find out today, among other things. At this point, I would like to refer to the previous article on the i9 chips, since the procedure for data collection is identical and some basics are repeated.
Intel 13th Gen Raptor Lake Binning – über 500 CPUs angetestet! | Teil 1: i9-13900K und 13900KF
At the outset, I would like to emphasize once again that the absolute SP values alone between i9, i7 and i5 SKUs are not comparable. The reason for this is the different V/F curves and stored value constants that Asus uses to calculate the SP on their motherboards, per CPU type. An i5-13600K with SP 100 does not have the same clock potential as an i7-13700KF with SP 100 or an i9-13900K with SP 100. But enough of the preface and here we go with the data about the i7 chips.
13700K vs. 13700KF – SP Total
Since the number of tested chips per i7 or i5 SKU is about the same, I deliberately left the X and Y axes of the diagrams the same between K and KF this time to make it easier to see differences in the distribution.
As with the i9 chips, a trend can be seen that the SP of the respective KF variant – i.e. the one without iGPU – is slightly higher than that of the K variant – with iGPU. That KF is the better choice for those who want to improve their chances in the silicon lottery has long been a rumor in the enthusiast community, but here with the i7 chips, the gap has already shrunk to 0.6 points on average, while it was still 1.5 with the i9. But more about that later.
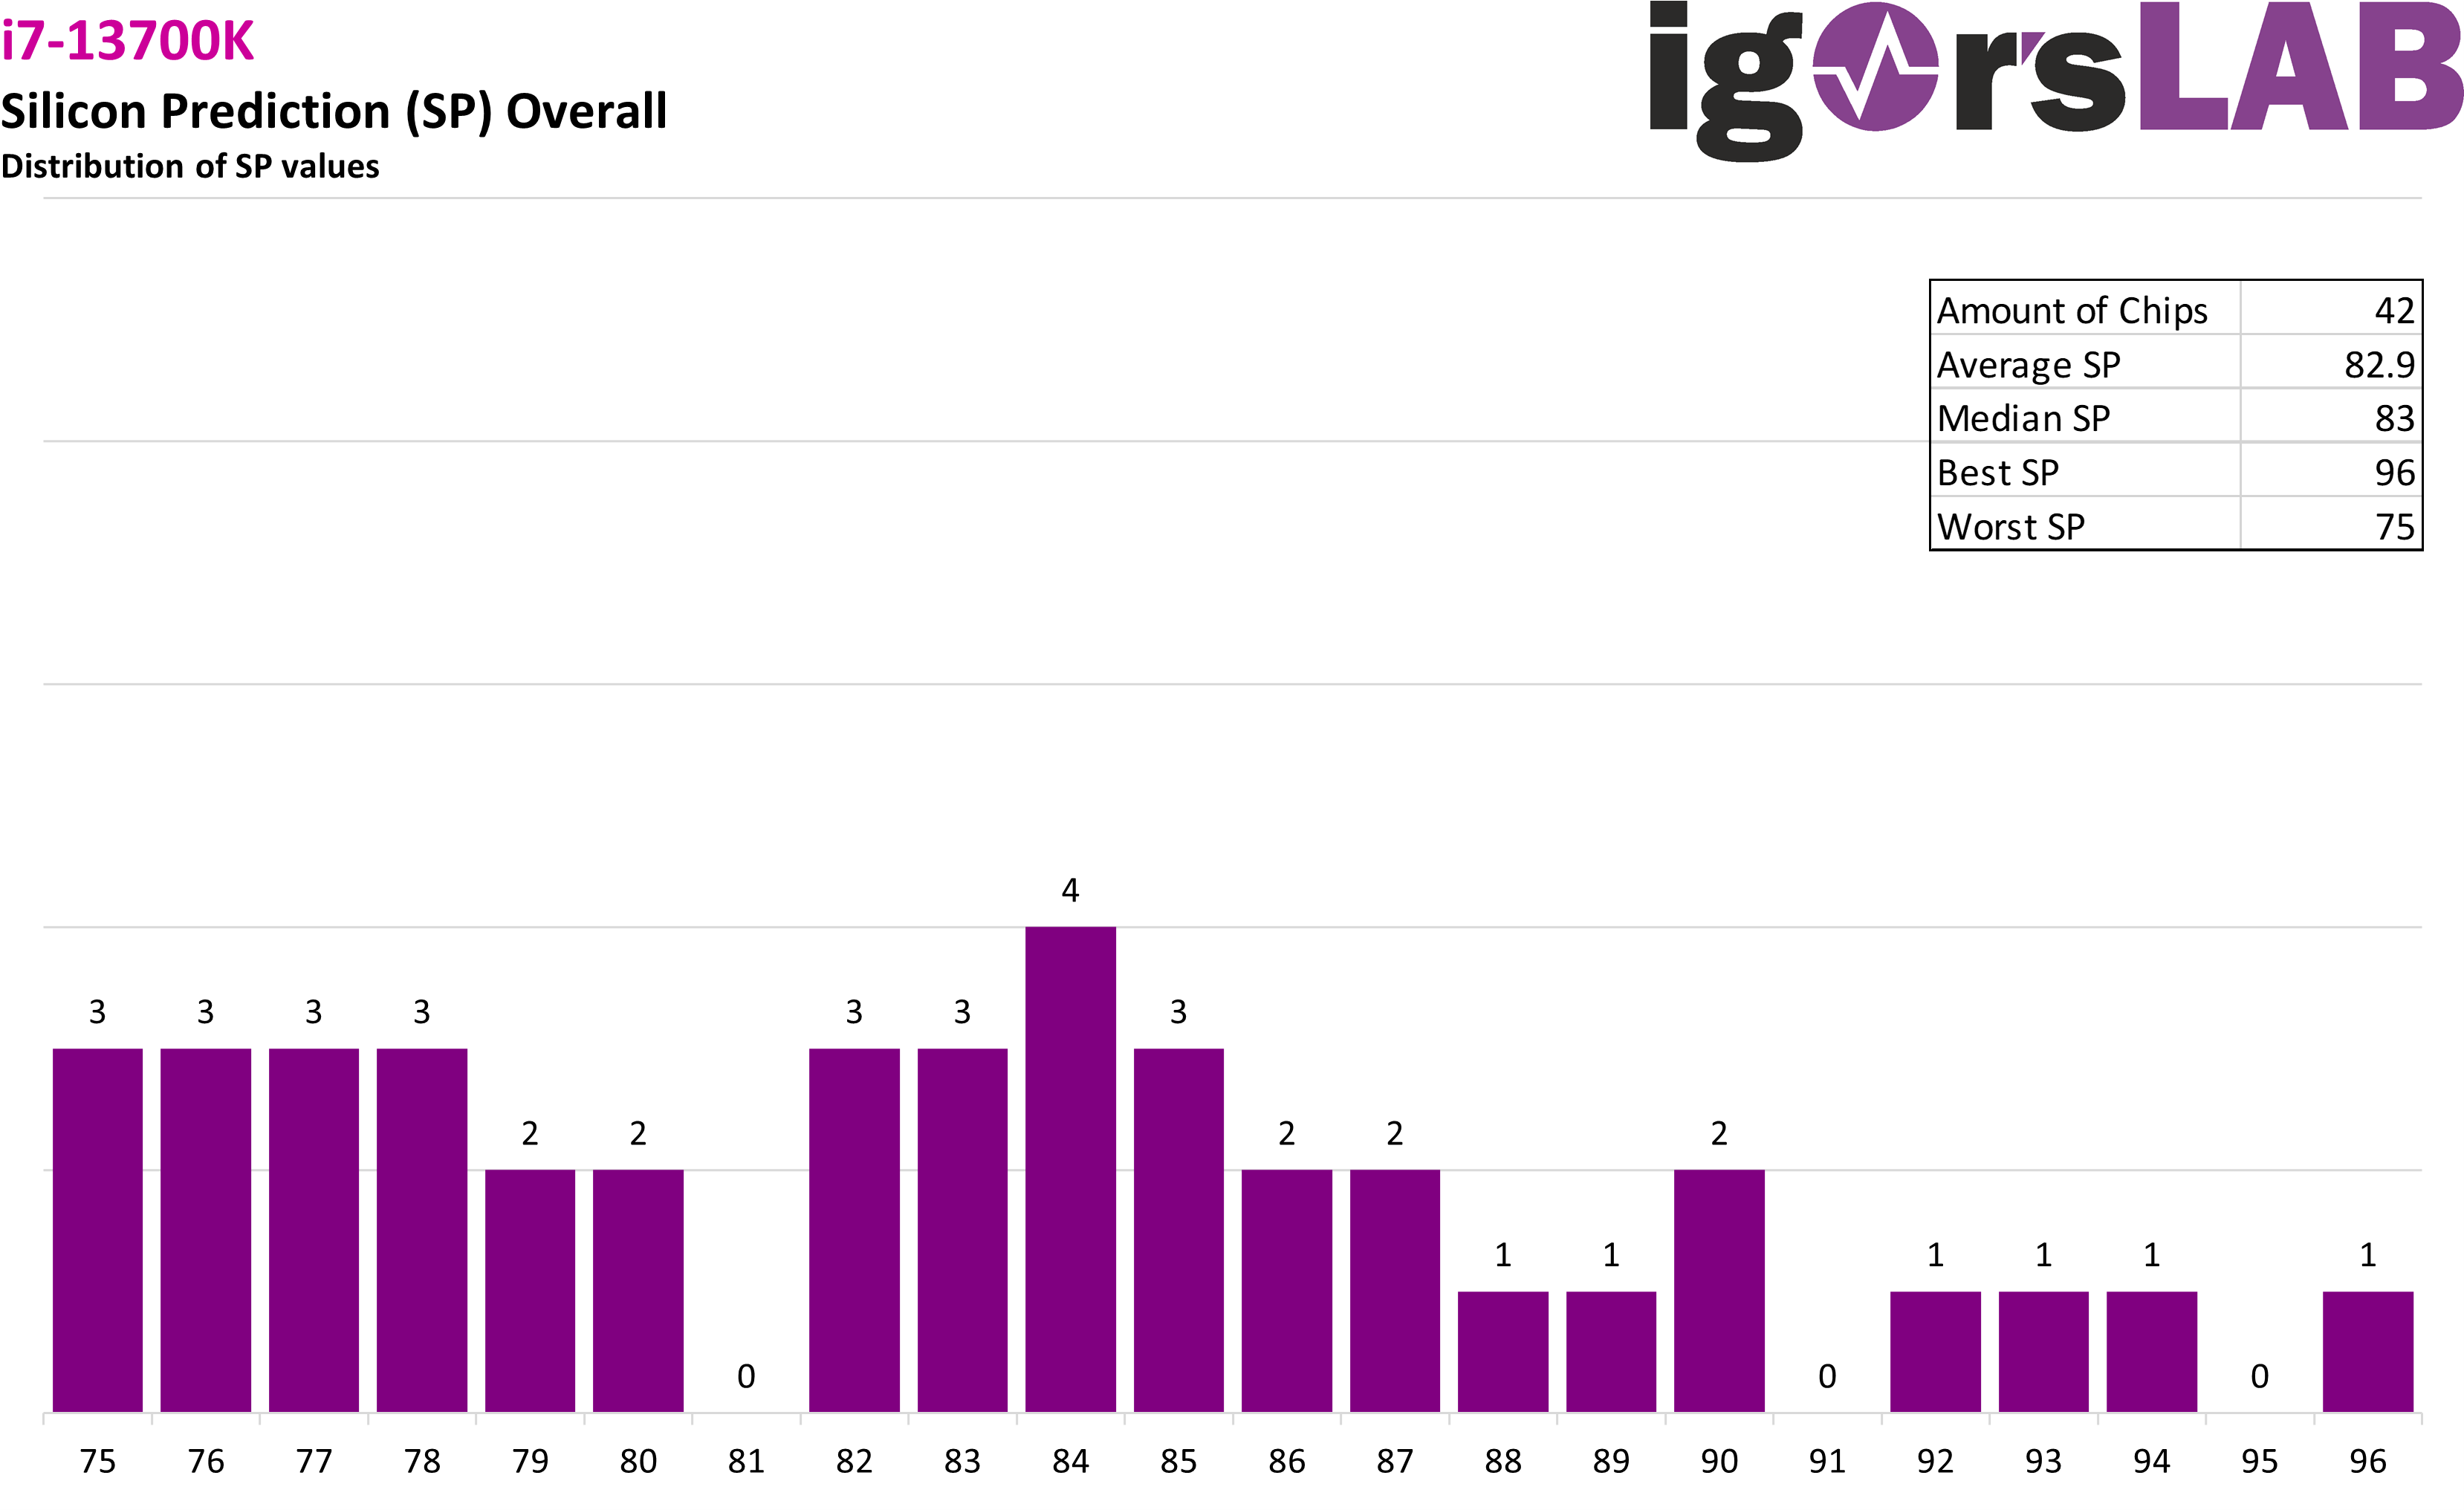
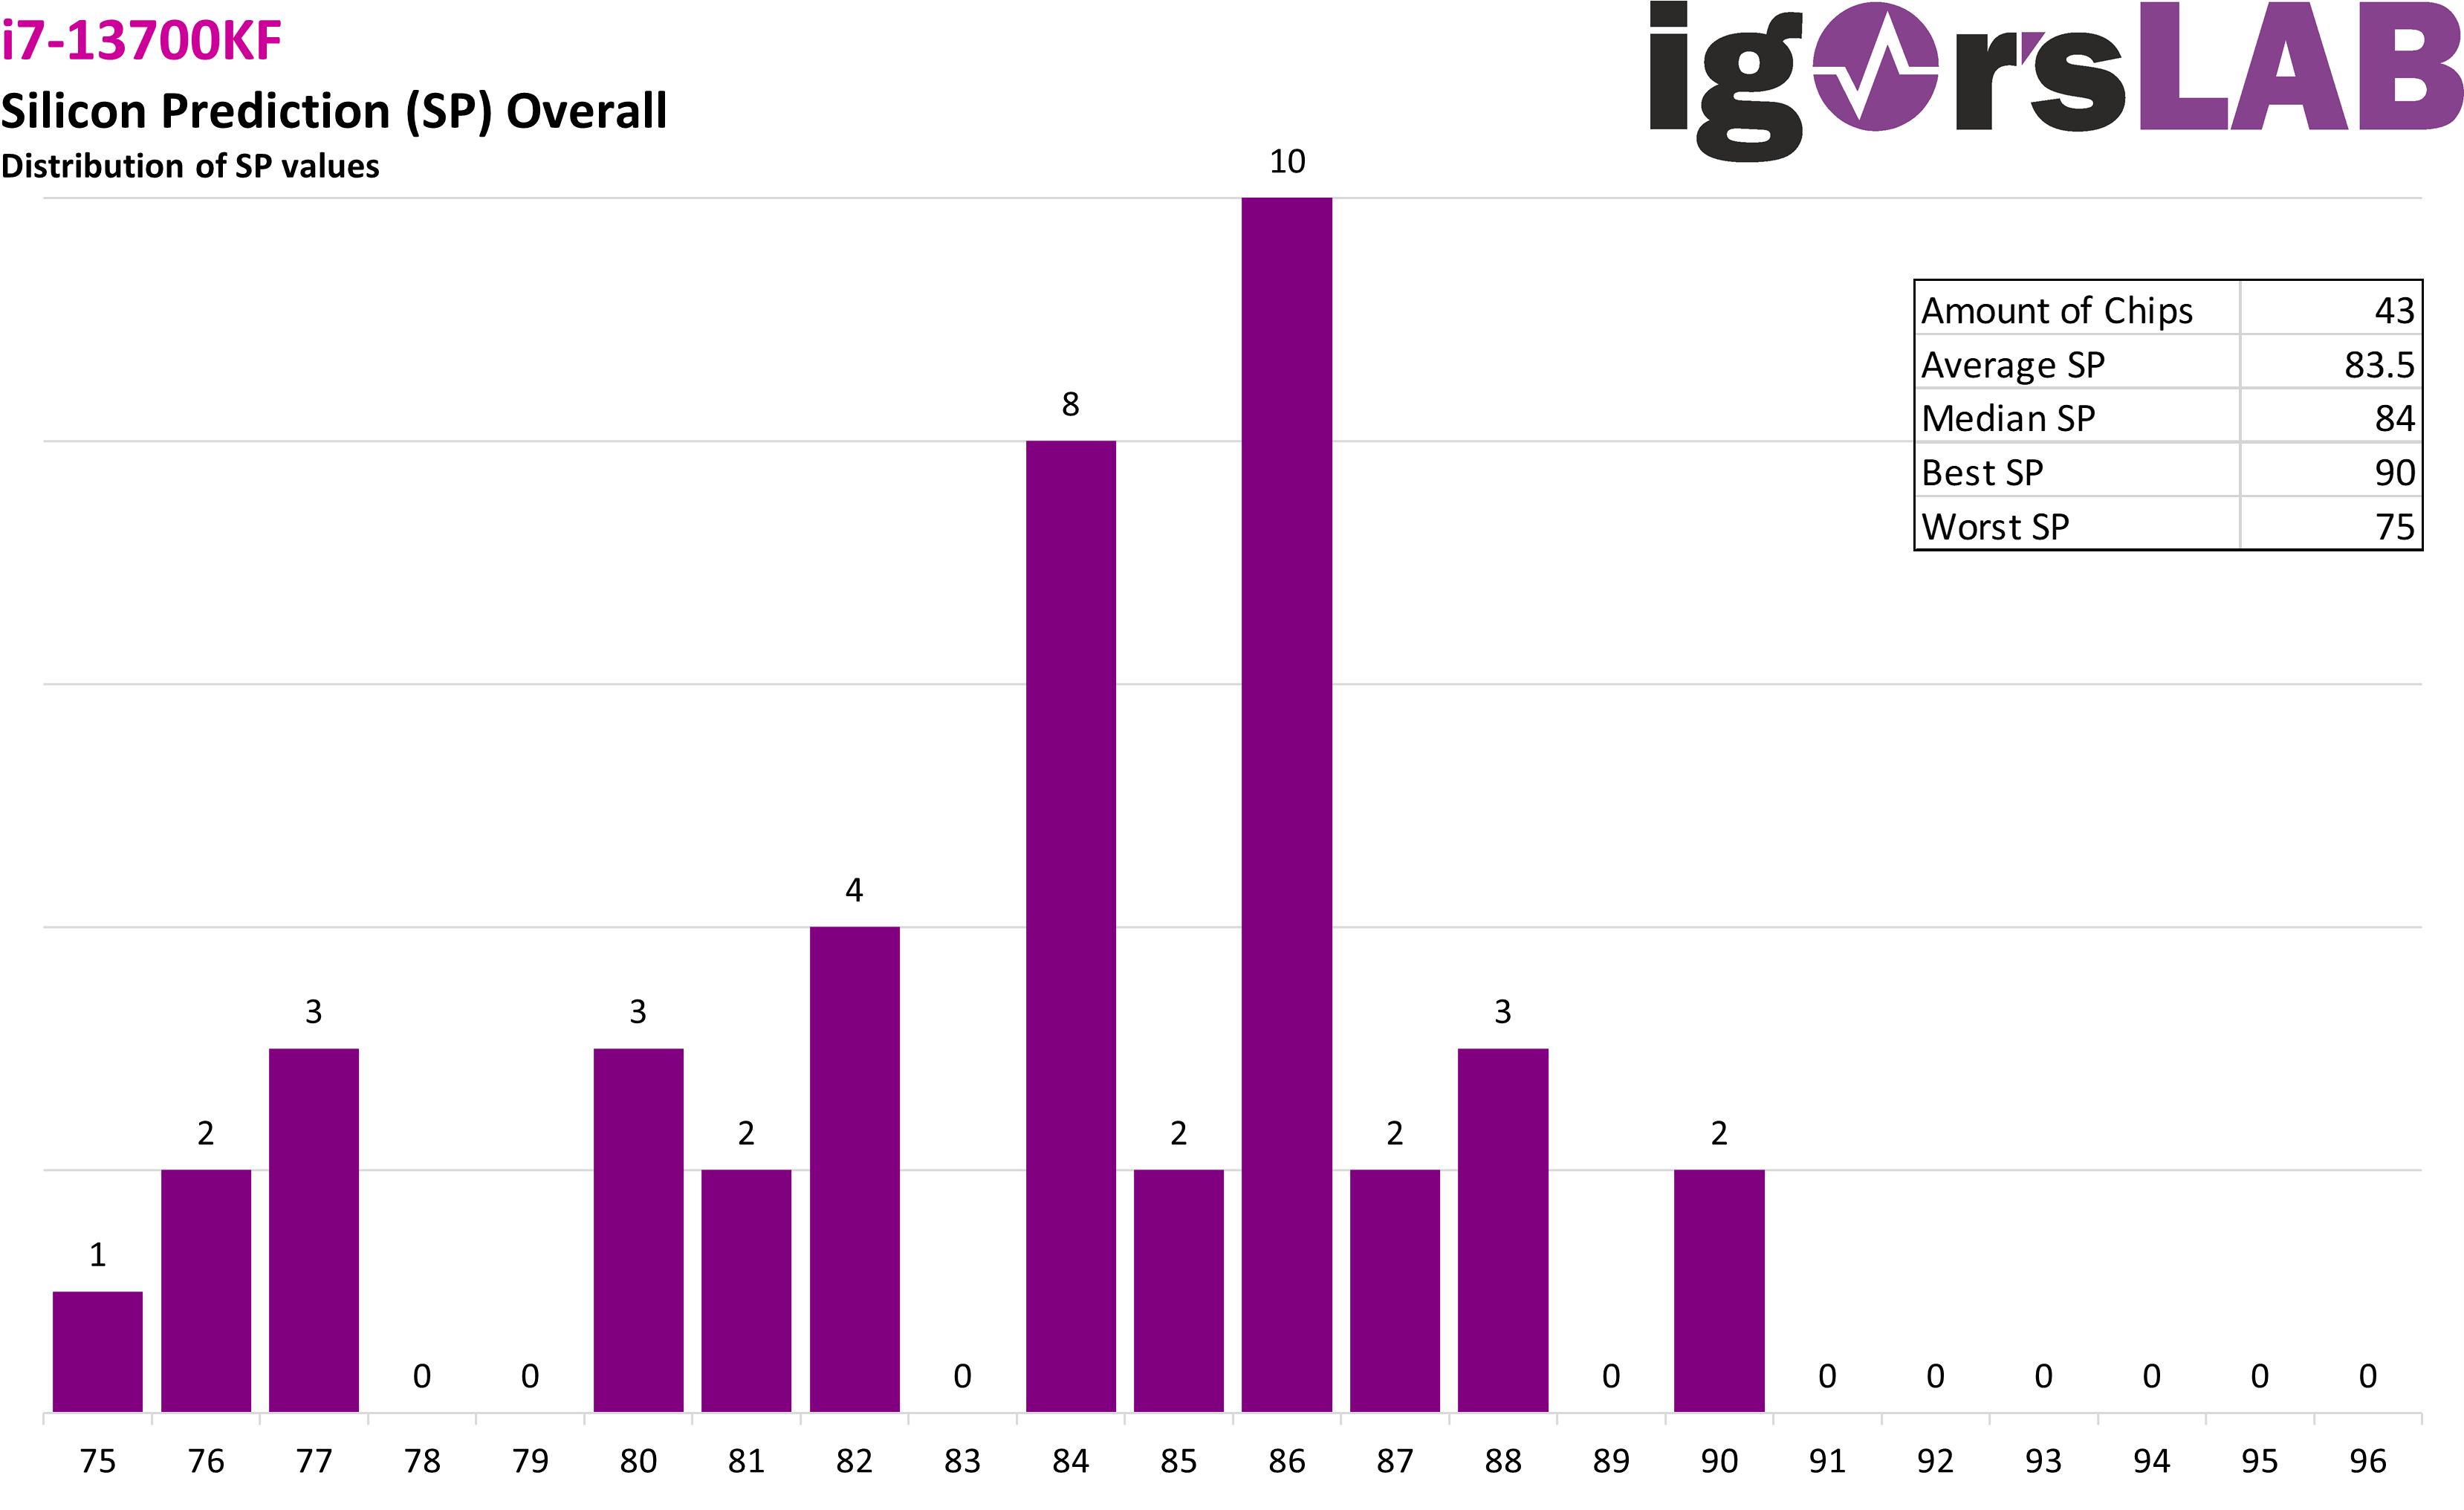 Furthermore, it is striking how much more widely distributed the SP values are for the 13700K, while the diagram for the 13700KF almost resembles a Gaussian curve with accumulation around the average. With a unit number of 42 and 43 CPUs, it is of course still not possible to draw a truly representative conclusion about a general distribution. So this could simply be an artifact in our data.


6 Antworten
Kommentar
Lade neue Kommentare
Urgestein
Veteran
Mitglied
Mitglied
Mitglied
Mitglied
Alle Kommentare lesen unter igor´sLAB Community →