The better is the enemy of the good, and that is exactly why we have taken stock after almost 40 tested fans, evaluated the feedback from readers and added more details. Although the effort involved increases somewhat, many processes can be automated. The question of which units to base the whole thing on has kept us busy for some time. Since the lesser have repeatedly requested an alignment to RPM instead of CFM, this was the reason to completely revise the metrics and thus also the measurement series once again.
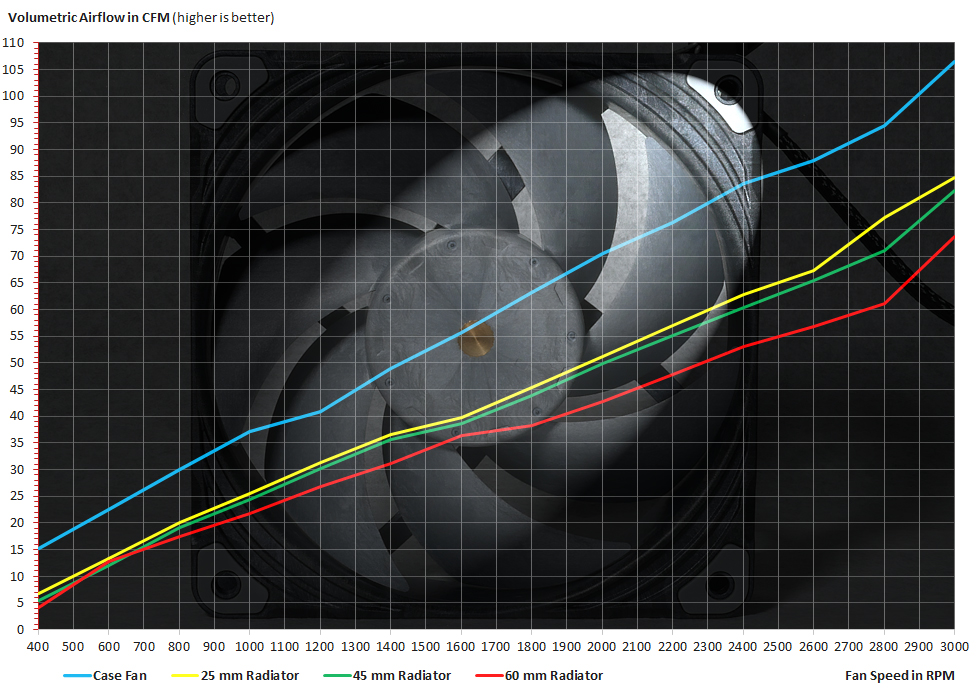
You can already see from the teaser image that we are now aligning the X-axis to the speeds, which range from the minimum to the maximum value. As usual, the Y-axis displays the relevant measurement results for each speed range, whether it is flow rate, static pressure, sound pressure level, power consumption and one more surprise implemented later. I can also reveal that our online database is already in alpha phase and we have therefore abandoned the focus of a comparison with a suitable “reference” fan in each case. There is always someone who is even better and the development does not stop. Therefore, comparisons via the new online database will be more flexible and also clearer, so I will remove them from the actual individual test from now on.
This is for clarity and also leaves more room in the charts for comparisons within the application scenarios of the respective tested fan. I will therefore also, as far as possible, dispense with the bar graphs with the three fixed speeds (500, 1000 and Max. rpm) and display everything as a curve over the entire speed band. Although this increases the measurement effort immensely, it brings significantly more added value for the reader. So today I will show you how we measure what and how the new edition will now look like. Fewer individual charts, but everything in a few curve charts.
Volumetric Airflow
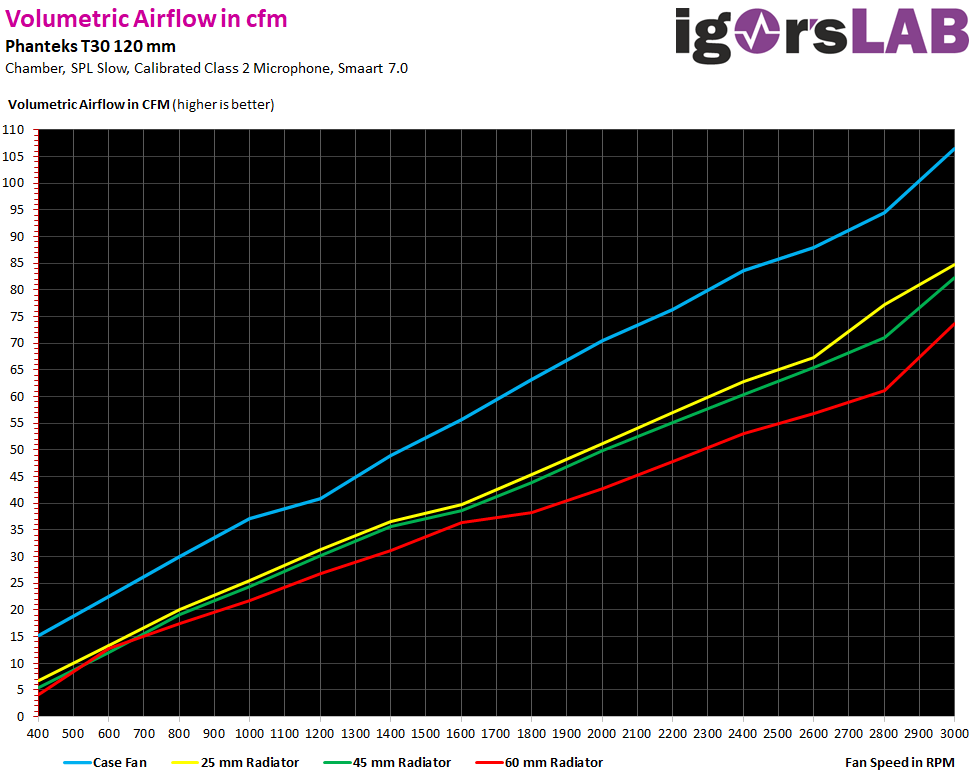
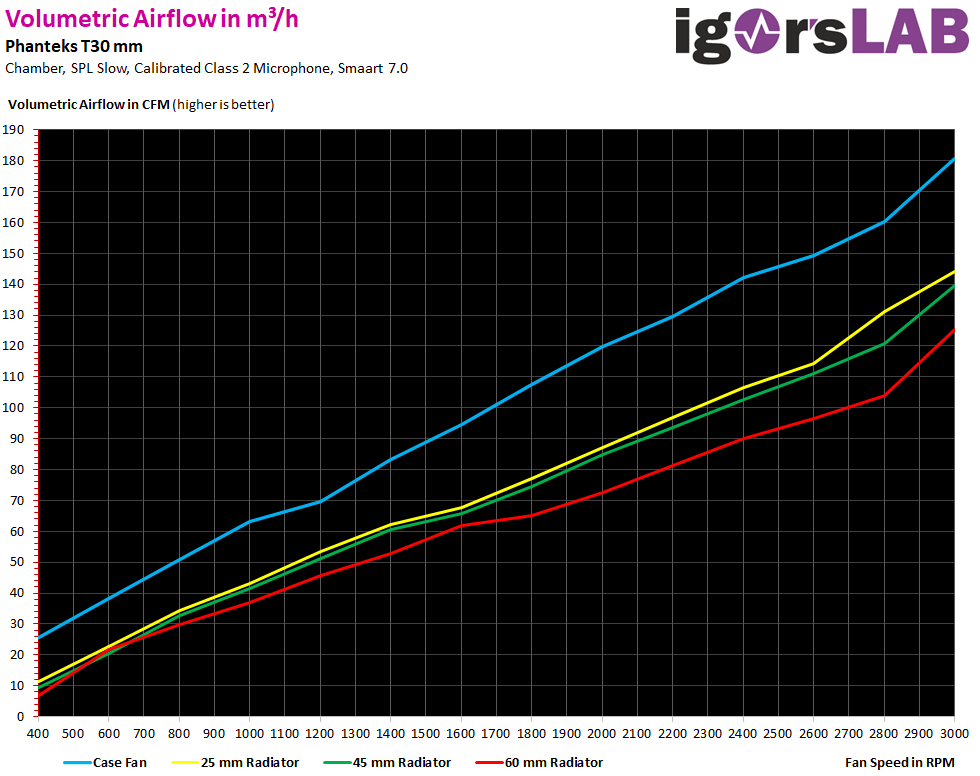
Let’s start chronologically with the so-called “throughput”. In future, we will primarily use cfm (cubic feet per minute) instead of m³/h as the unit of measurement, because this is the international standard and is also used in almost all data sheets. The diagram for m³/h will continue to exist for the time being, but in the end it does not say anything else. It would be nice if you could express your opinion in a small poll, because the effort would be halved at least for the graphics.
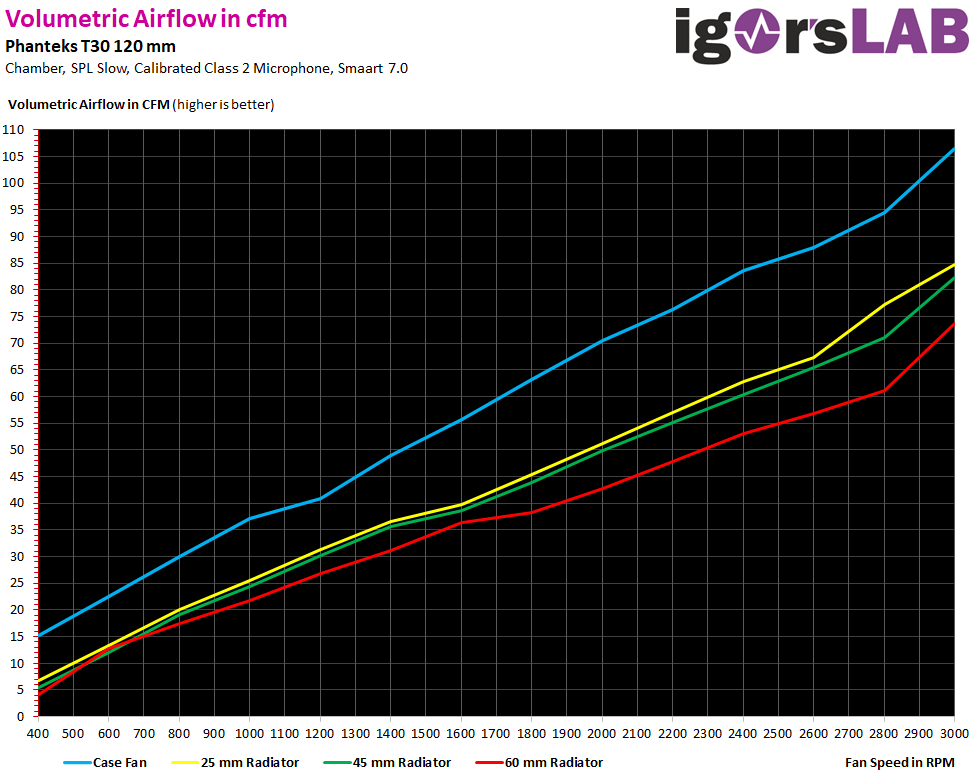
Now we come to the new graphic, which you already know in a similar way. You will see a horizontal slider that can be moved with the mouse. This way you could read the respective value more precisely on the left side of the Y-axis. The rpm already have 100 rpm steps stored as a grid, so we don’t need the crosshairs. The chart contains all measured installation variants from the case fan (blue), to the thin 25 mm radiator (yellow), the 45 mm radiator (green) and the thick 60 mm radiator (red). You are welcome to play with the first two graphics:
The whole thing again in m³/h. I don’t see the sense of the redundant curves anymore. But that’s why we have the poll above.
Since there is currently no source that offers realistic and usable data even in a differentiated comparison, we invested a lot of time (and unfortunately also money) and simply developed our own fan measuring station with the advice of a large German cooling unit manufacturer and then calibrated it in their laboratory. Our colleague Pascal Mouchel has done a great job here and the result, the “Sarcophagus I” model, is now quite respectable. The heavy and solid body made of thick MDF boards is screwed, glued and soundproofed. How this all works and what we can ultimately measure and what not, you will learn today.
A much simplified version with a long tube instead of the chamber, such as Corsair offered the testers, would have been much cheaper and also easier to use, but it is so inaccurate due to the design that the values can only be considered a rough estimate with many errors. The pressure drop is immense and a serious sound level measurement is simply impossible due to the resonant body thus created. Values below approx. 30 cfm can hardly be evaluated meaningfully and are no longer particularly close to reality. That is why we quickly abandoned this form of construction.
Currently, there is always the question of what characteristics such a 120 or 140 mm fan really has. Not every model is suitable for all radiator thicknesses, and some supposed powerhouses lose so much pressure on radiators that they can hardly be called suitable. The information on volume flow (“throughput”) and static pressure in the data sheets does not help if something works well on a slim radiator and fails completely on a 45 mm radiator.
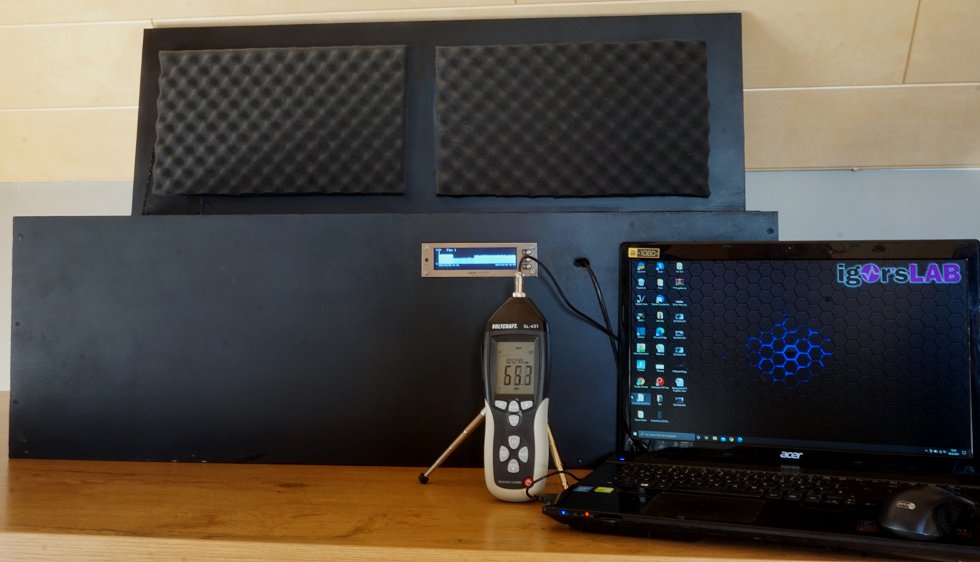
In the picture we can see the middle partition between the two chambers, which supports the fan and also the radiator. Decoupling is, of course, a top priority, and we thankfully had expert help in calculating the volume for the chambers. Each of the chambers is also expediently lined with nubby foam and designed in terms of material technology so that there are hardly any disturbing influences. The “honeycomb” behind the fan was recommended to us by Black Noise and the cooling manufacturer alike. This means that all coolers are equally well integrated, because each has a different exit angle and this is exactly what can be compensated for. However, due to the honeycomb, there is no tear-off edge and the airflow is directed directly to the outlet.
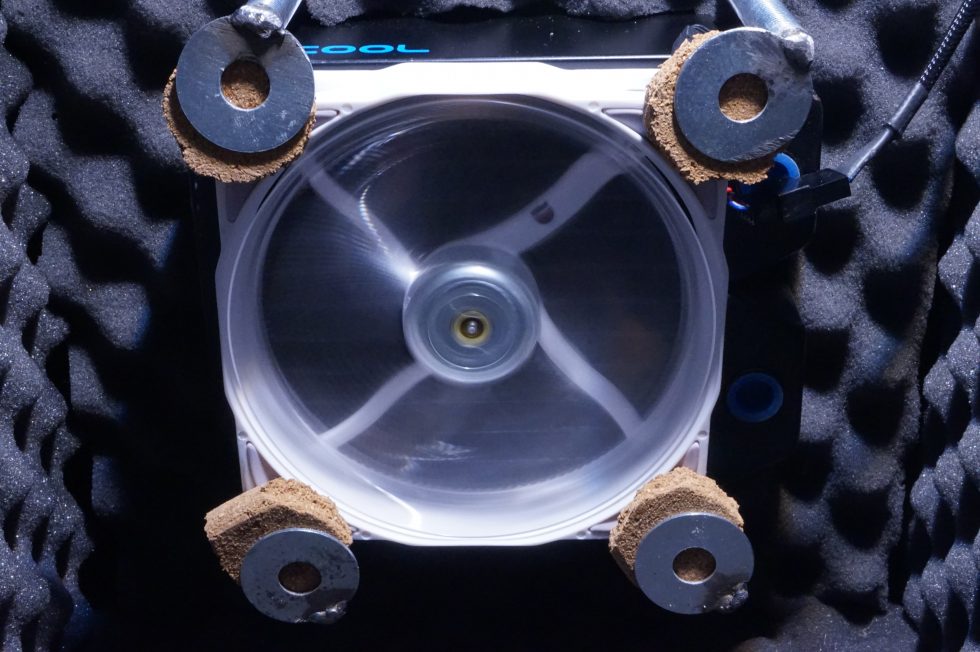
Radiators and fans are decoupled and screwed tight with their own clamping device. In the picture you can see very nicely the improvised clamp with thick washers and insulation material as a base. The control is done by an Aquaero purchased by us from Aqua Computer, so we can control and test the fans both by voltage (DC) or by PWM. Both are needed, because many fans, as some people don’t know, can’t be brought to the lower and upper limits of the speed range with pure voltage regulation and also show other anomalies, about which we will write something at the appropriate place.
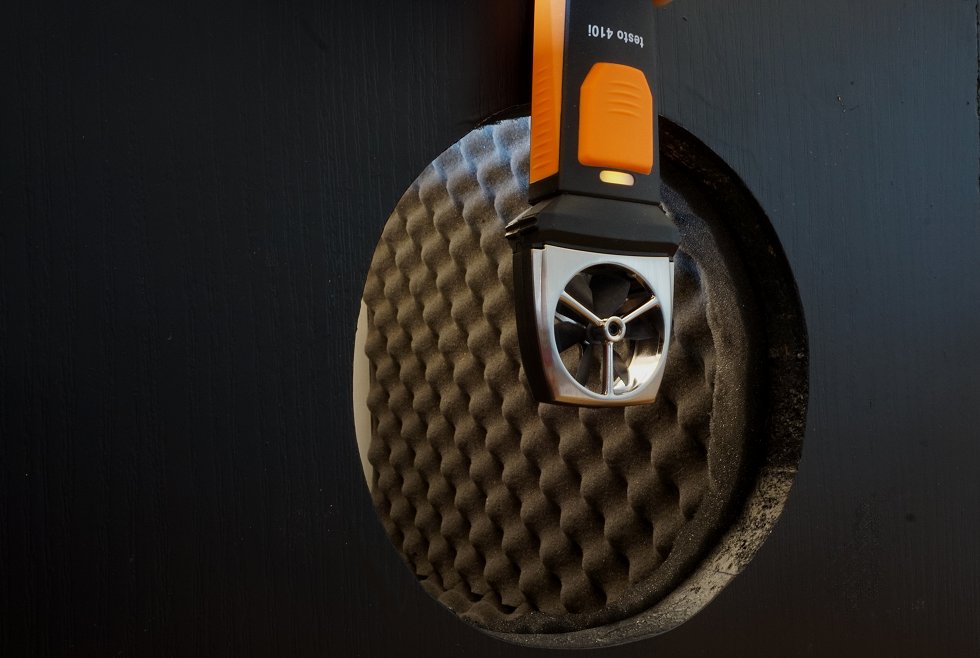
The volume flow, to return to the current topic, we measure at the exit of the second chamber, where the air is blown out. This range is covered relatively accurately by comparative measurement in the measurement setup of the refrigeration partner, so that our calibrated testo 410i now delivers quite reliable results to the electronic measurement data acquisition, which match the reference data of the professional measurement quite well. The price of the equipment is not important here, but rather the appropriate positioning and also the exact calibration with series of comparative measurements. Without that, it’s just guesswork in the dark forest.
The next page will show you how static pressure works. However, the structure of the chamber remains the same. Only the measurement changes.








72 Antworten
Kommentar
Lade neue Kommentare
Urgestein
Urgestein
1
Urgestein
Urgestein
Urgestein
Veteran
Urgestein
Mitglied
Urgestein
Mitglied
Urgestein
Veteran
Urgestein
Mitglied
1
Mitglied
Urgestein
Urgestein
Alle Kommentare lesen unter igor´sLAB Community →