


What actually happens when you forcefully and cunningly slow down a GeForce RTX 3090 Ti, which swallows up to 500 watts in ultra HD, to 300 watts? With only 60% of the consumed power, the question arises how many percentage points of performance are lost when 40 percentage points less energy is needed. Where does it place its self in the end as the most frugal card in the test field, from AMD’s Radeon RX 6800XT up to the unrestrained GeForce RTX 3090 Ti? Sure, you could also run all the other cards more economically, but I simply set myself the goal for today to stay just below the RX 6800XT at the power outlet and see what really happens. That alone is exciting enough.
Of course, I have all the metrics for you again, and this time they are quite something. Besides the FPS, percentiles, frame times and variances per game, there is also the power consumption of the GPU and CPU as well as the respective efficiency consideration. This is quite interesting because you can see that not all GeForce cards act the same in the P1 (min FPS), in the frame times as well as their variances (reproducible). But more about that later. Of course, at the end I also have the summary of all games and a conclusion for you. The whole thing is limited to Ultra HD to largely exclude the CPU’s influences, which are already noticeable from WQHD on the strongest cards. Furthermore, the power consumption is also highest here at almost 100% GPU load.
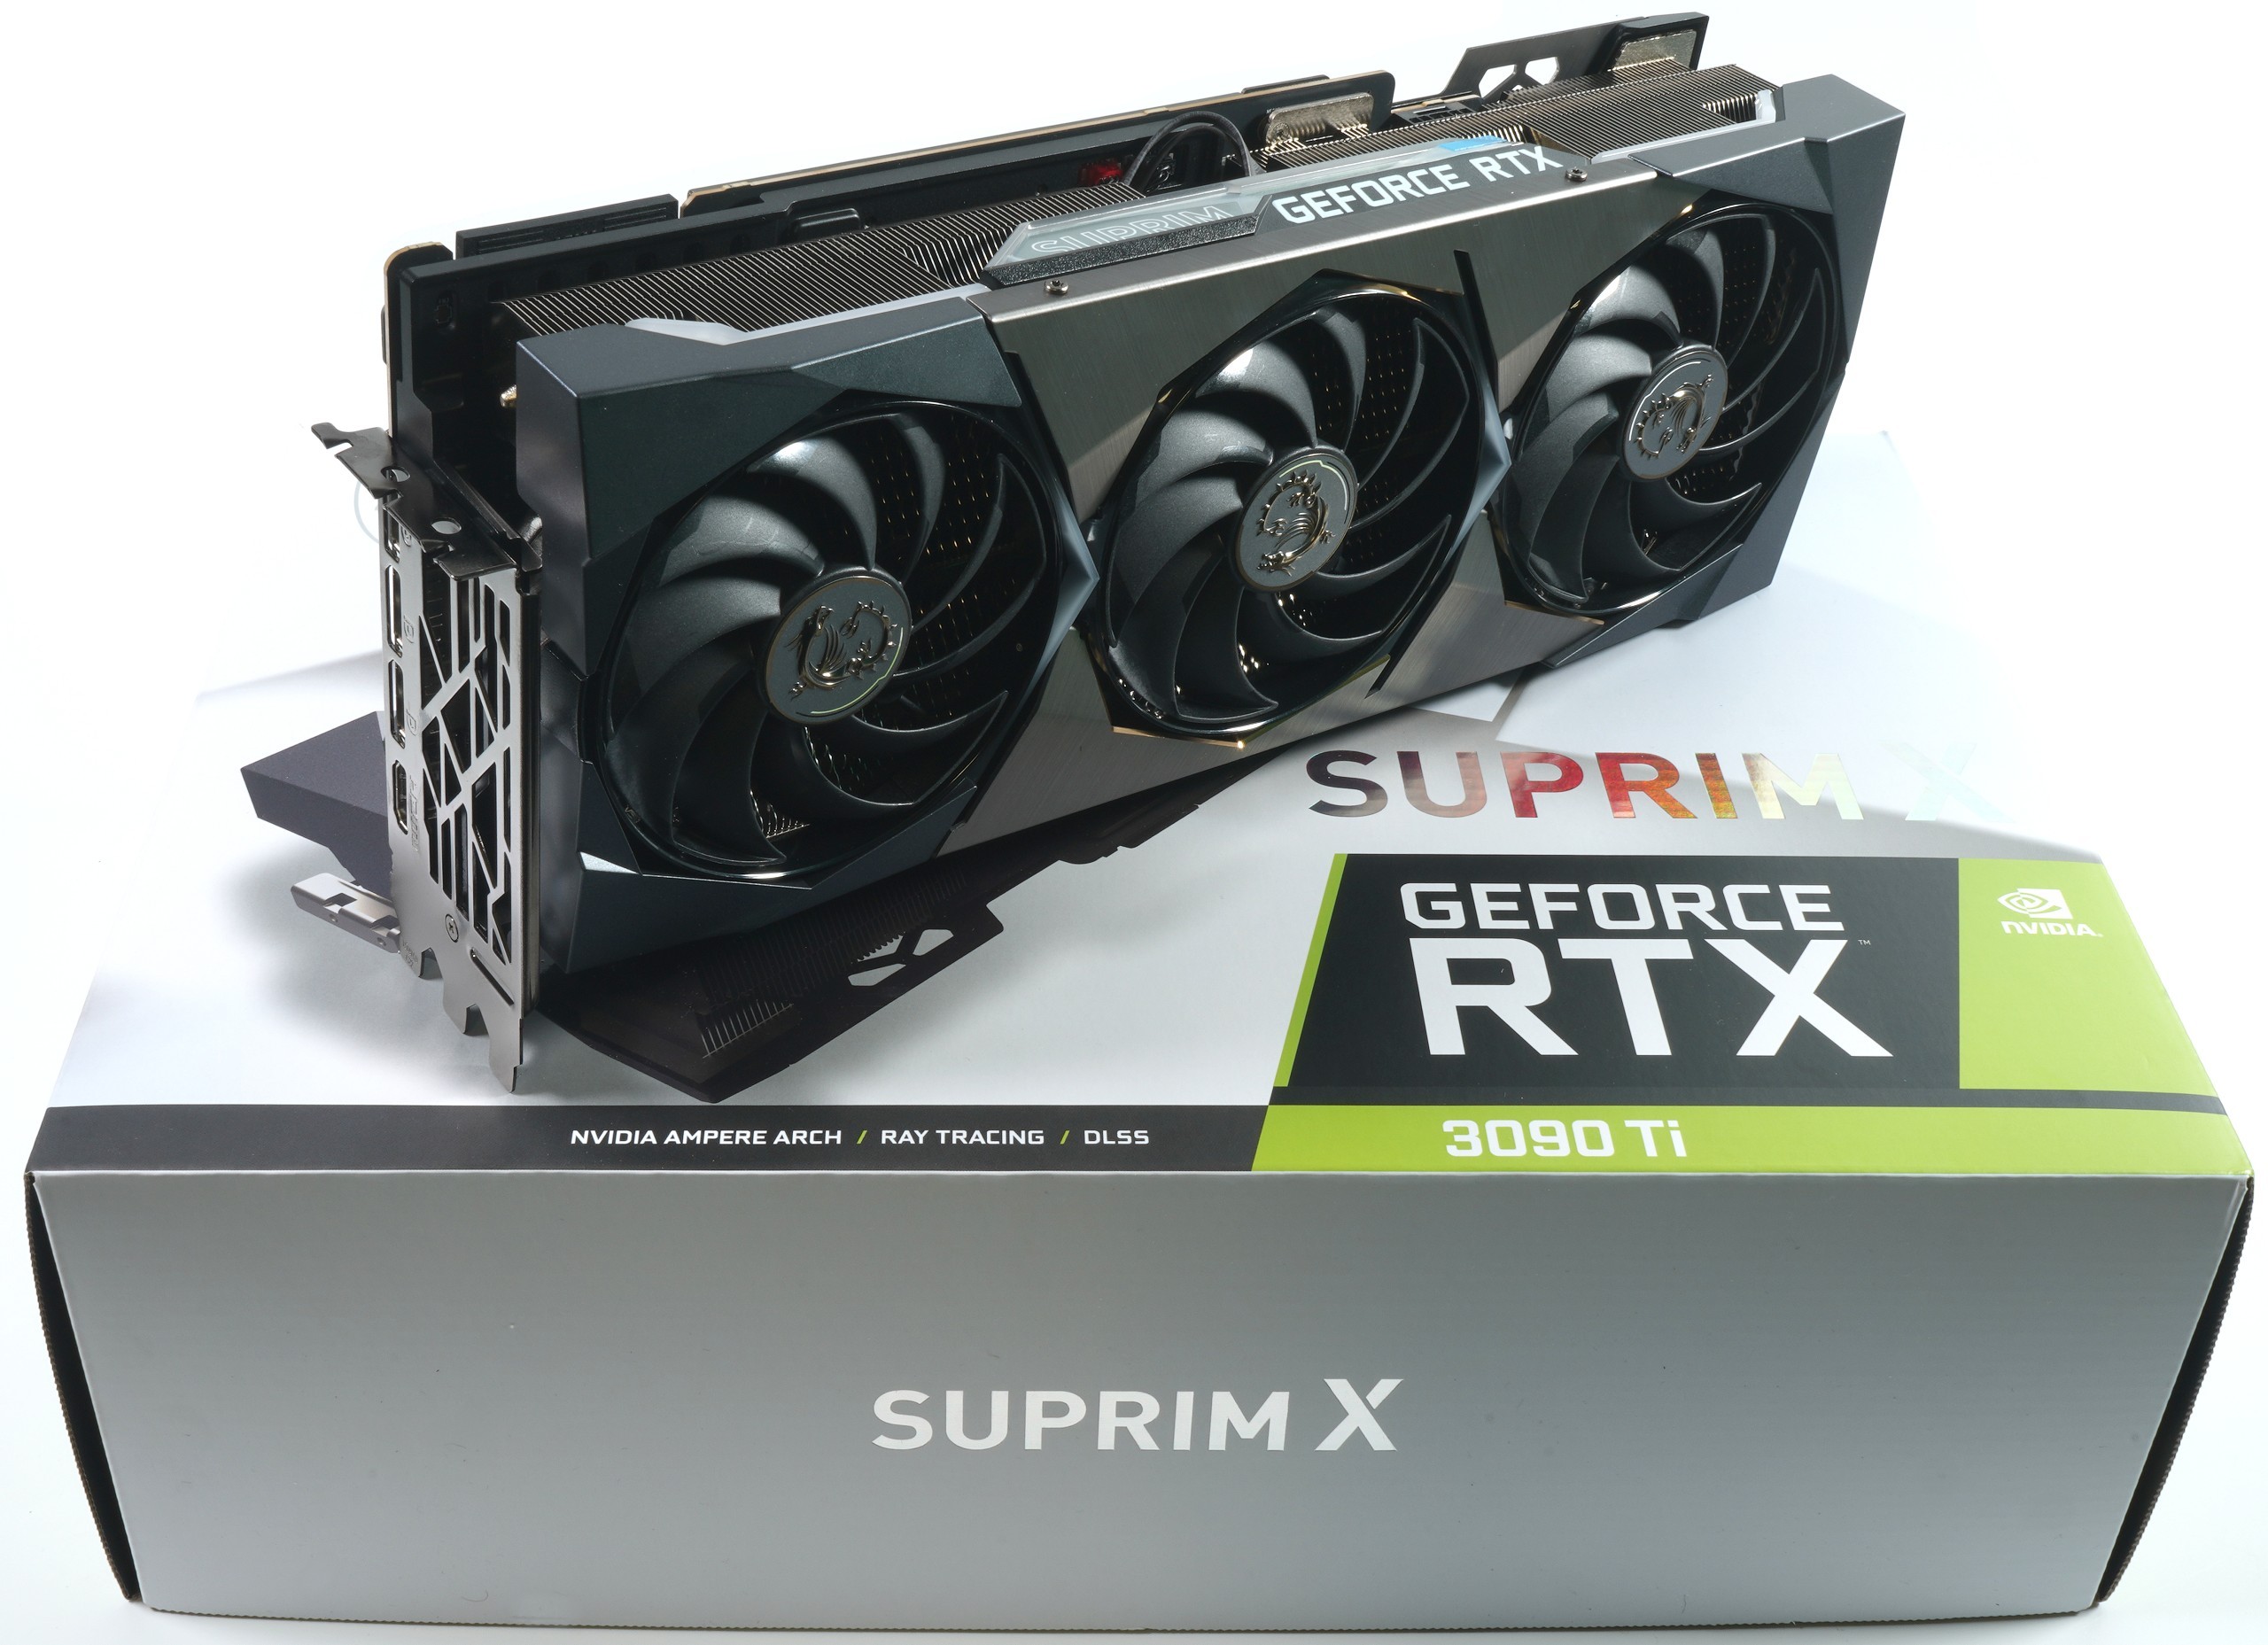
However, since it would be pointless to test this performance-enhanced MSI GeForce RTX 3090 Ti SUPRIM X 24 GB against reference models (as was the case in the launch test), I have also put MSI’s so-called custom models against them for all of the cards represented in the test. For the NVIDIA cards, all the cards come from the SUPRIM (X) series, while for the AMD cards, I use the Gaming X models for lack of other versions. Thus, they are all factory overclocked cards in gaming mode and with a consistent manufacturer philosophy. Anything else would really be window dressing. Therefore, the test is also limited to 7 relevant cards plus the artificially throttled version of the card.
Power break, test system and evaluation software
This time I not only narrowed down the power limit, but also adjusted the VF curve. I used the curve of the NVIDIA RTX A6000 as a blueprint, which is also slowed down with a power limit of 300 watts and has the same, uncut GA102. The fact that I took the trouble to test the consumer card instead of the RTX A6000 is also due to the fact that the RTX A6000 only has the significantly slower GDDR6 RAM. This costs another 3 to 10% performance depending on the game, especially since the RTX A6000’s cooler also acts as a blower along with a higher temperature target that prevents some of the highest boost steps. If anything, the same card had to be tested to remain truly comparable.
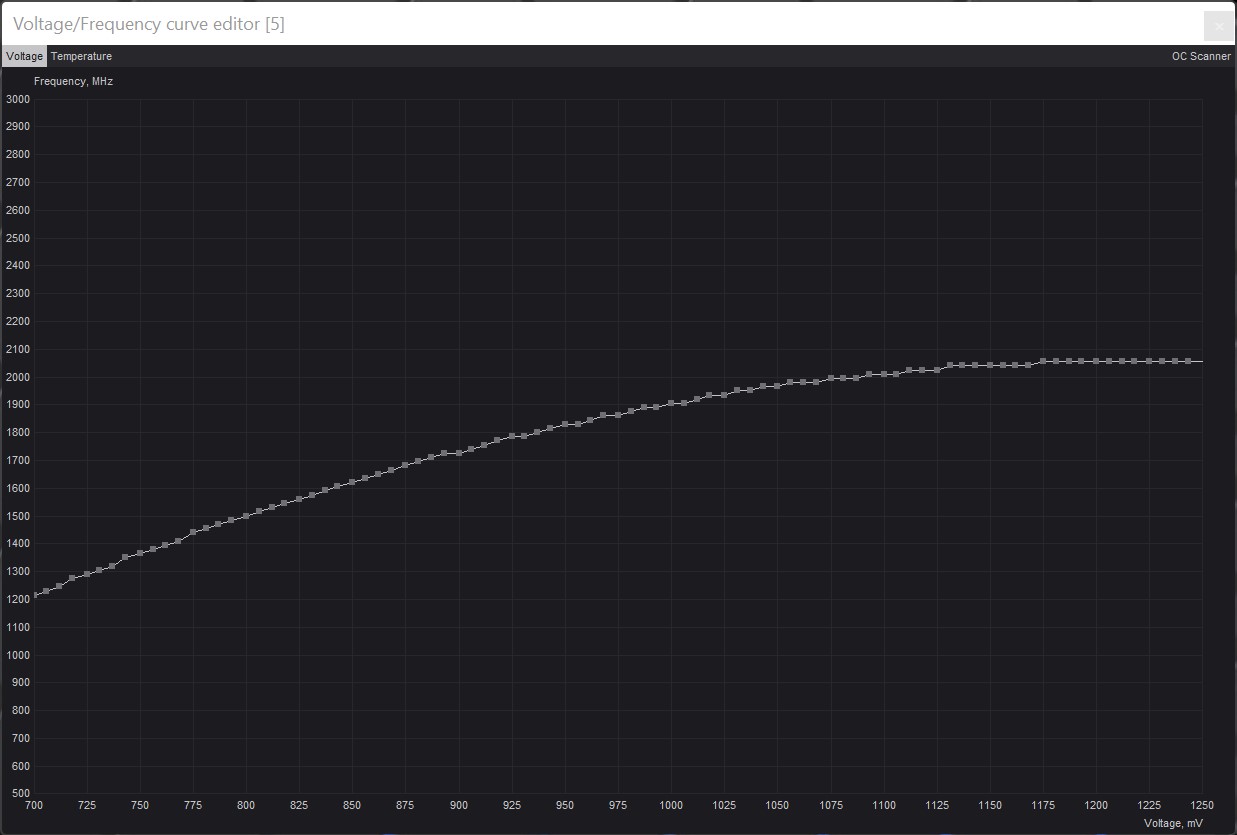
The frequency setting was not that easy, because there were always instabilities and I had to lower the clock to a maximum of 2050 MHz. And so, in the end, the optimized defaults cost me almost more time than the actual benchmark run. But no matter, the result counts and the weekend was crap weather anyway. So from that point of view, it was time well spent.
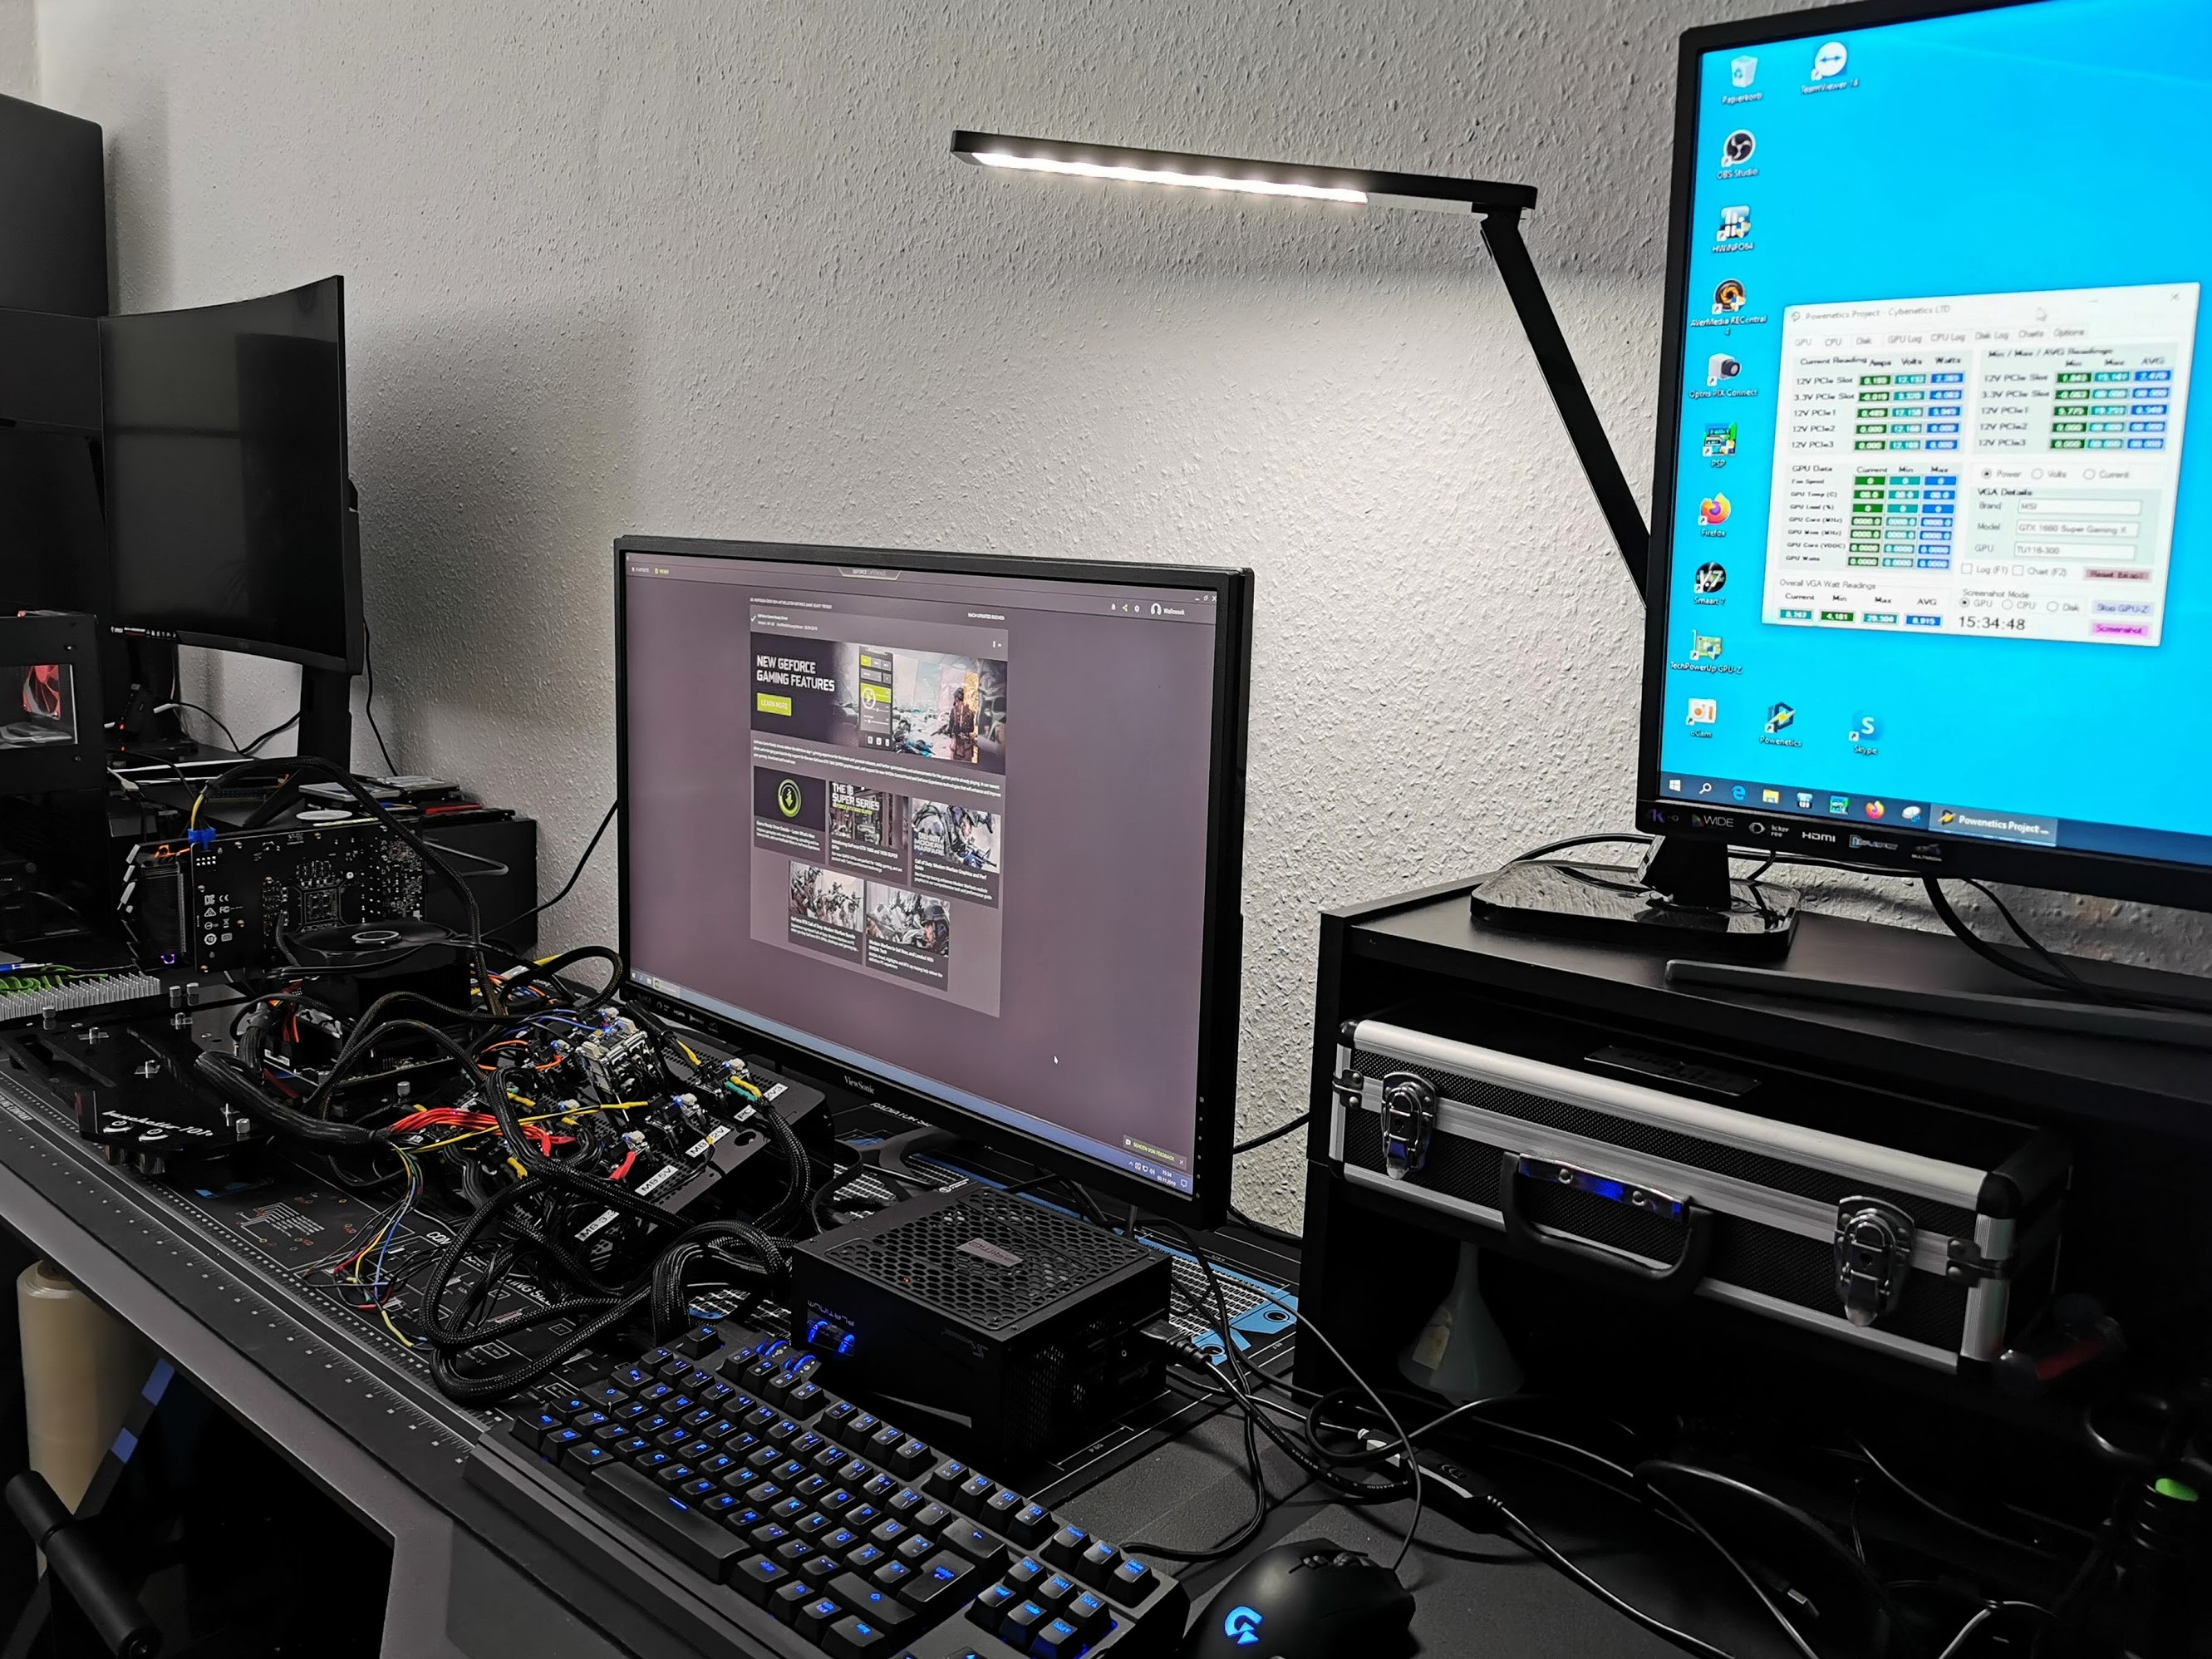
The benchmark system is known and redundant in both the lab and the editorial office. I’m going with PCIe 4.0, the matching X570 motherboard in the form of an MSI MEG X570 Godlike, and a select Ryzen 9 5950 X that’s been heavily overclocked and water-cooled. In addition, there is fast RAM as well as several fast NVMe SSDs. For direct logging during all games and applications, I use both NVIDIA’s PCAD and my own shunt-based measurement setup that can monitor all connections to the graphics card and motherboard (10-channels), which increases the convenience immensely. The detailed power consumption and other things are measured in the laboratory on a redundant test system, which is identical in every detail, on two tracks using high-resolution oscillograph technology.
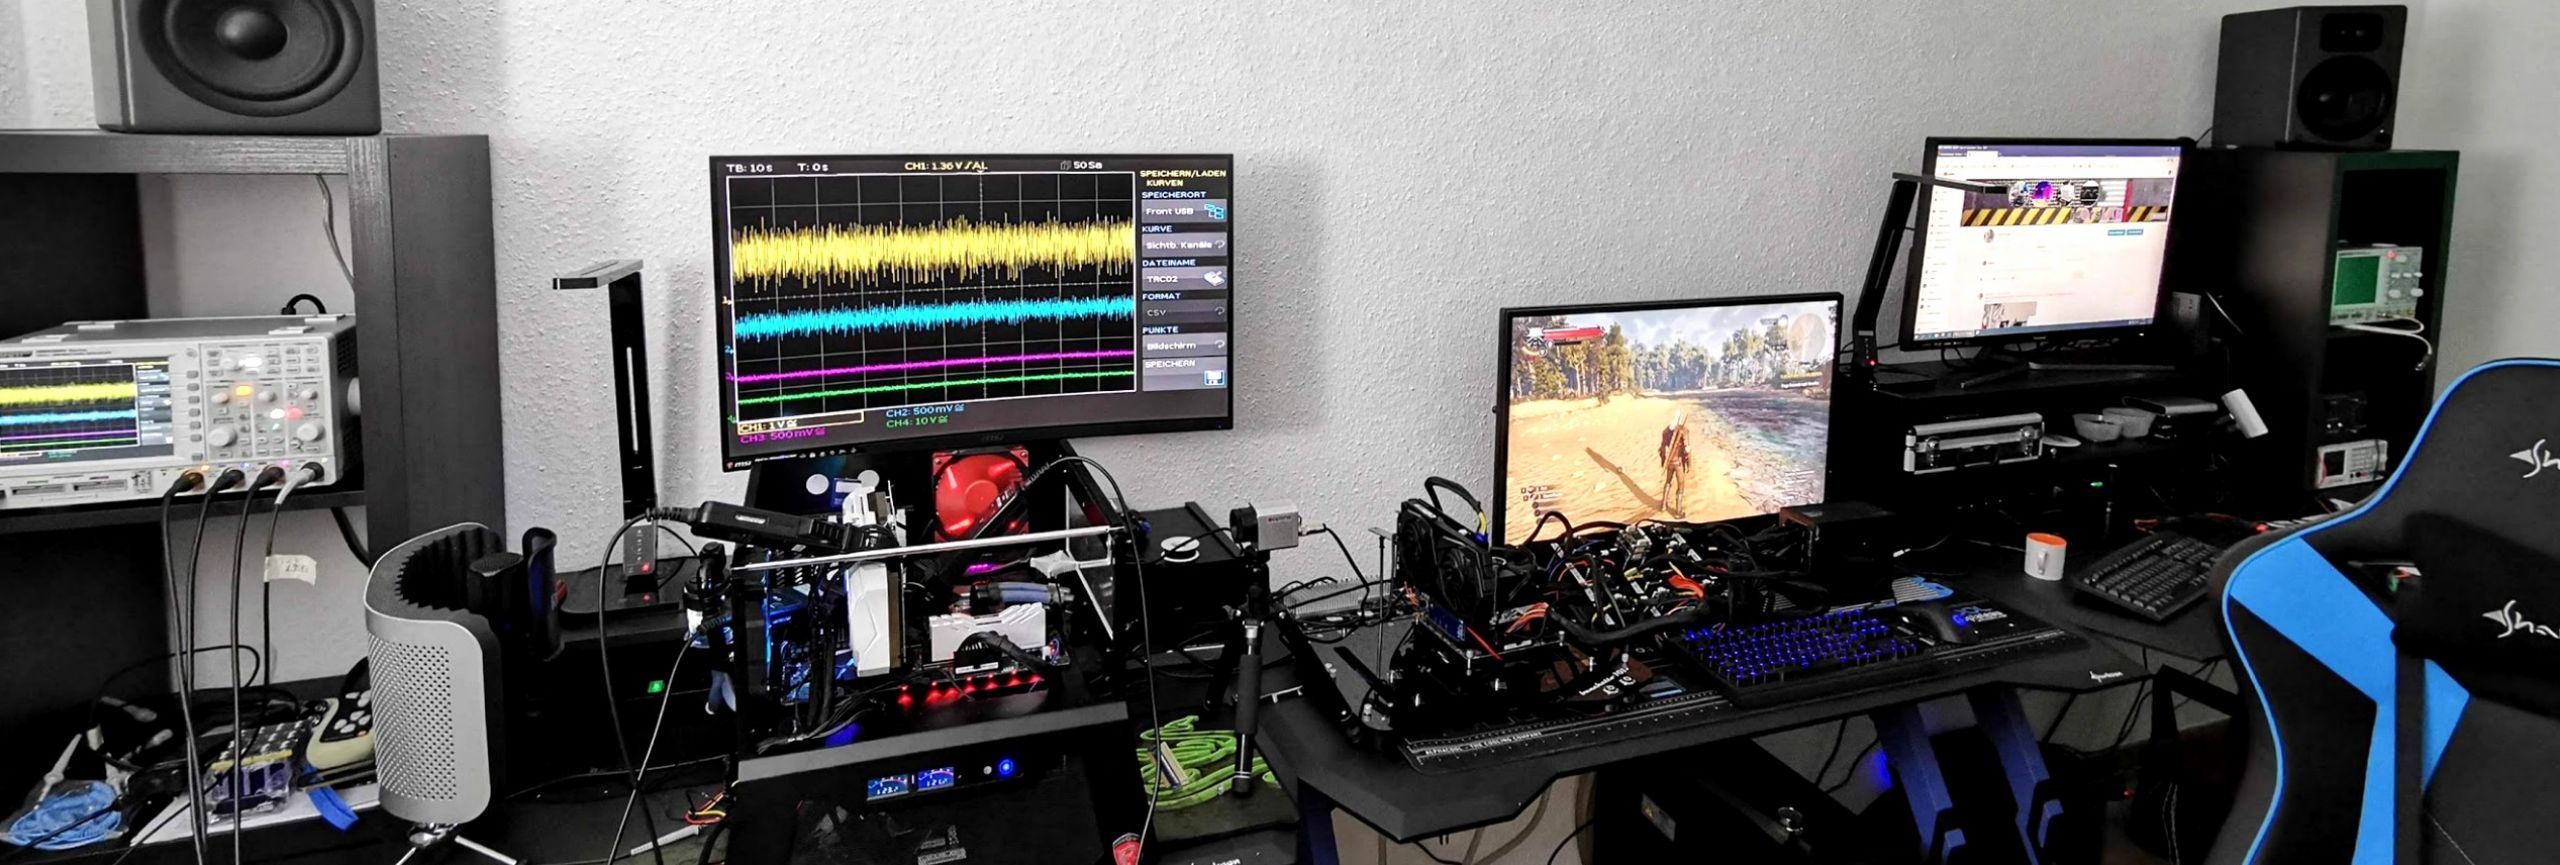
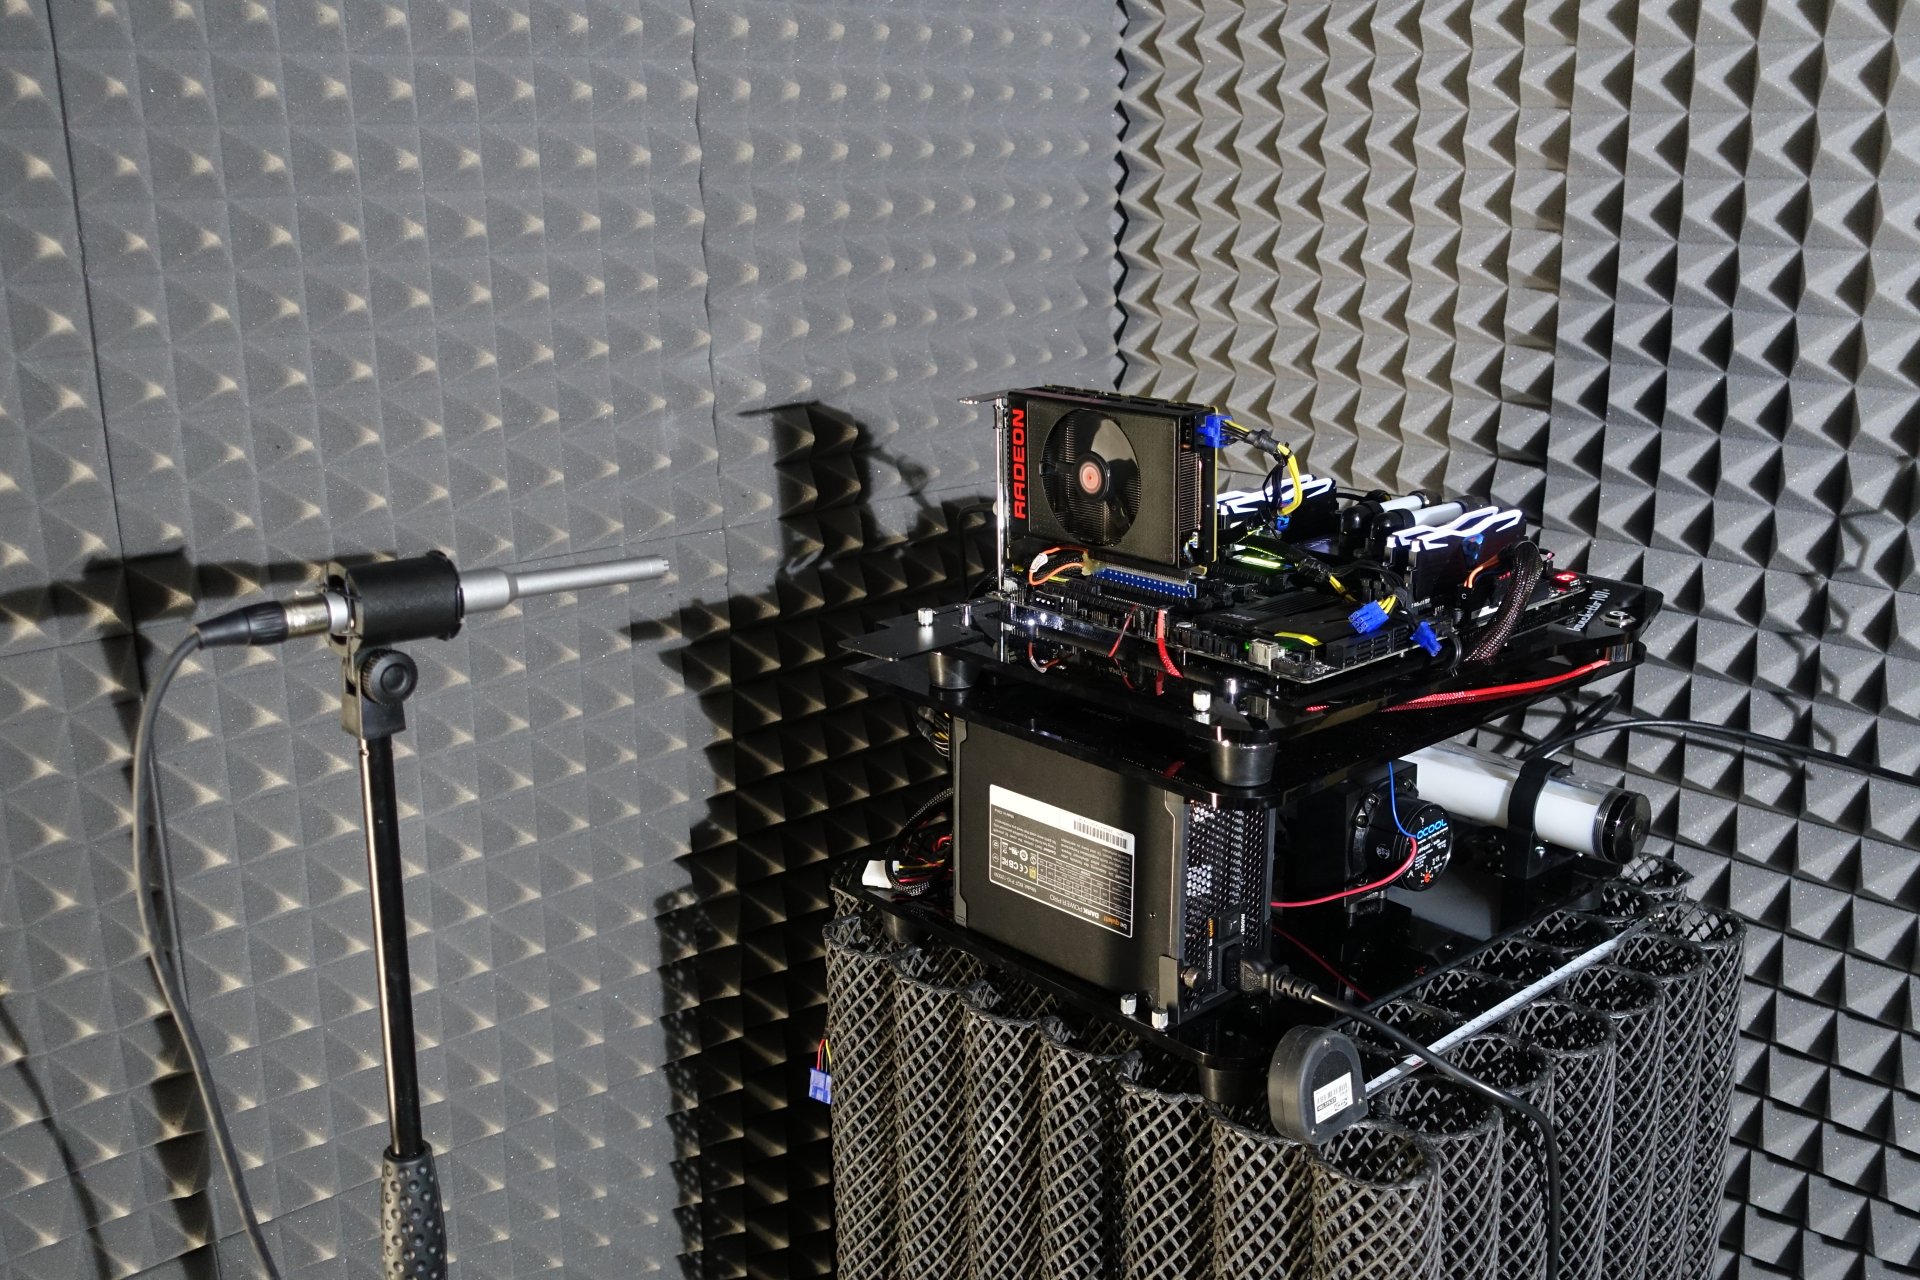
The thermographic infrared images, which are taken with a high-resolution industrial camera, are also created in these air-conditioned rooms. The audio measurements are done outside in my Chamber, which is in a different location.

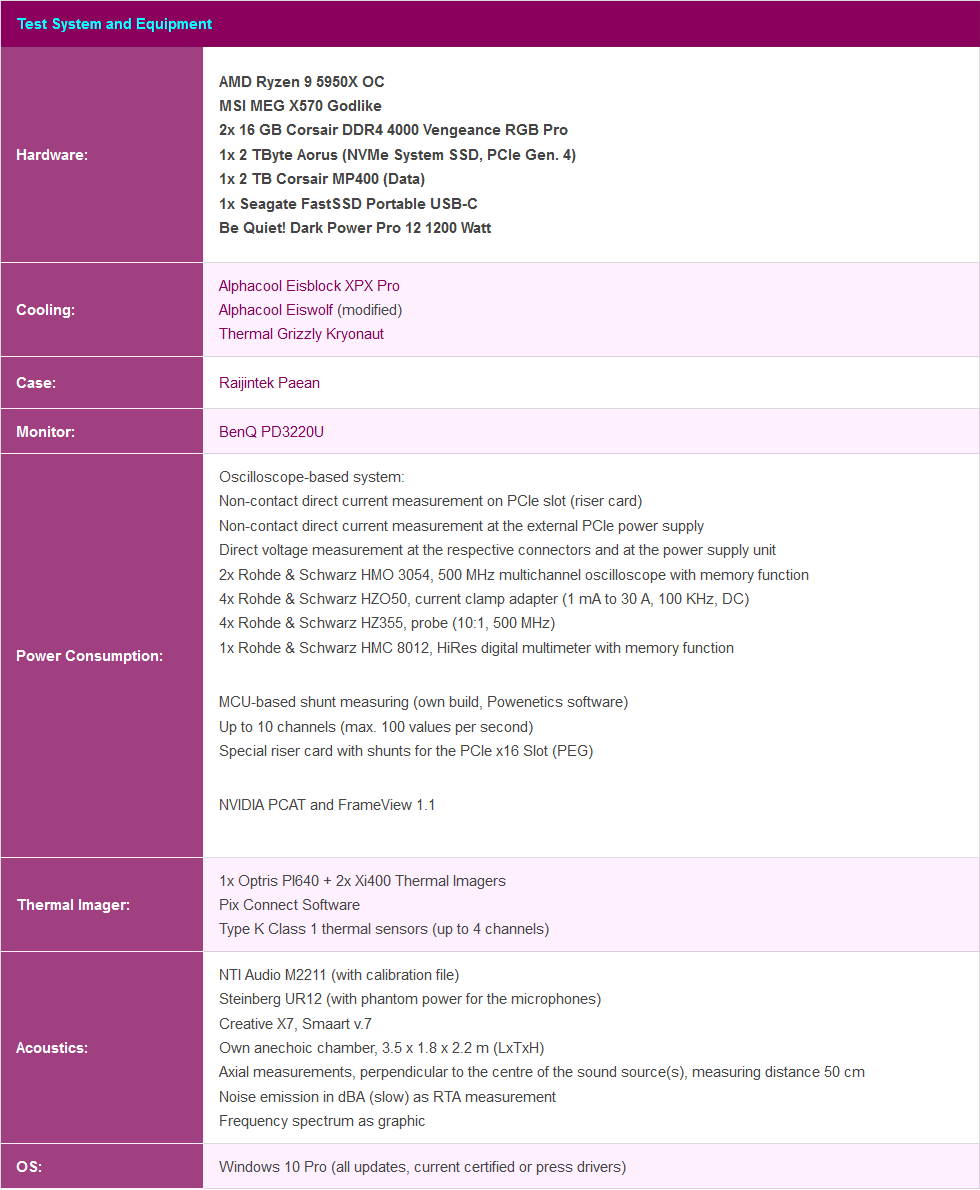
I have also summarized the individual components of the test system in a table:

- 1 - Introduction, Power Break and Test System
- 2 - Borderlands 3
- 3 - Control
- 4 - FarCry 6
- 5 - Ghost Recon Breakpoint
- 6 - Horizon Zero Dawn
- 7 - Metro Exodus Enhanced Edition
- 8 - Shadow of the Tomb Raider
- 9 - Watch Dogs Legion
- 10 - Wolfenstein Youngblood
- 11 - World War Z
- 12 - Overview, Summary and Conclusion


150 Antworten
Kommentar
Lade neue Kommentare
Veteran
Urgestein
Urgestein
Mitglied
Urgestein
Veteran
1
Urgestein
Urgestein
Veteran
Urgestein
1
Veteran
Urgestein
Urgestein
Urgestein
1
Veteran
Alle Kommentare lesen unter igor´sLAB Community →