


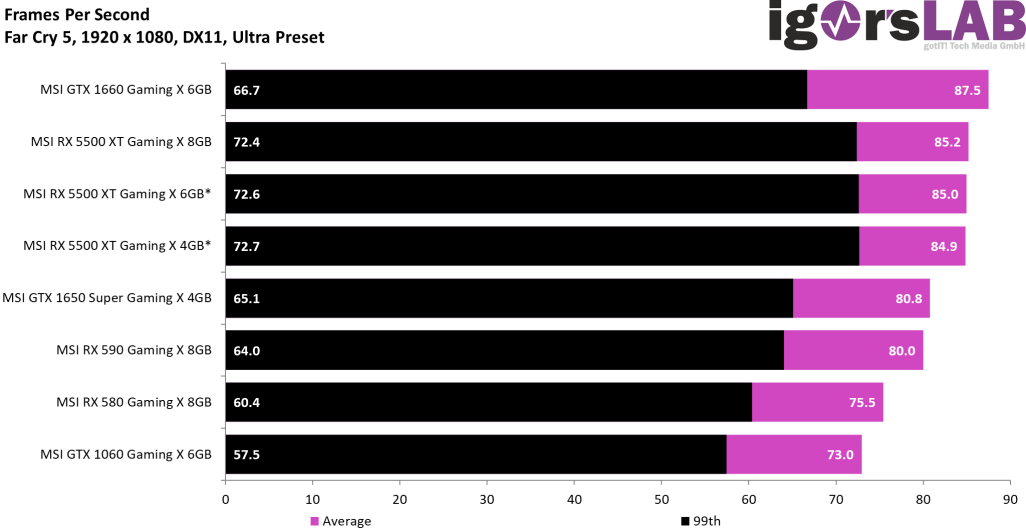
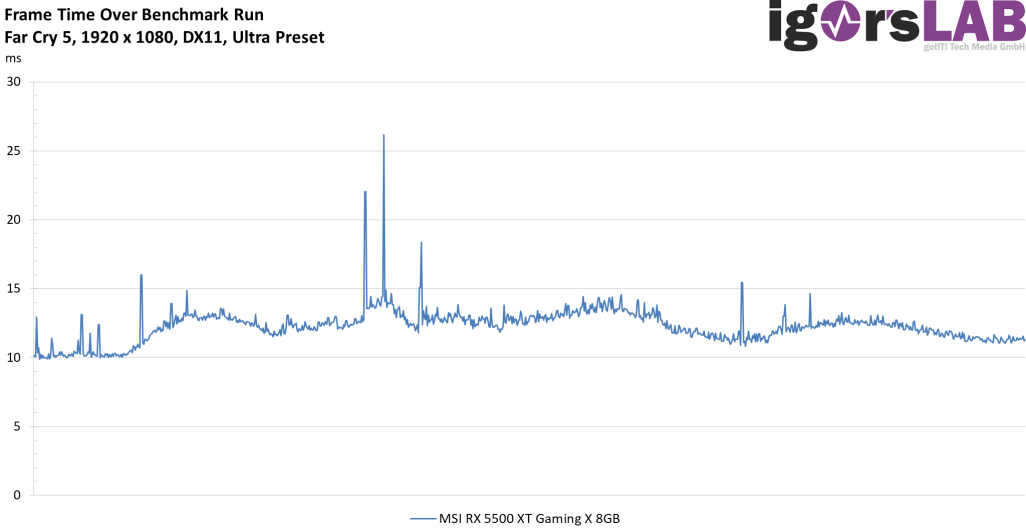
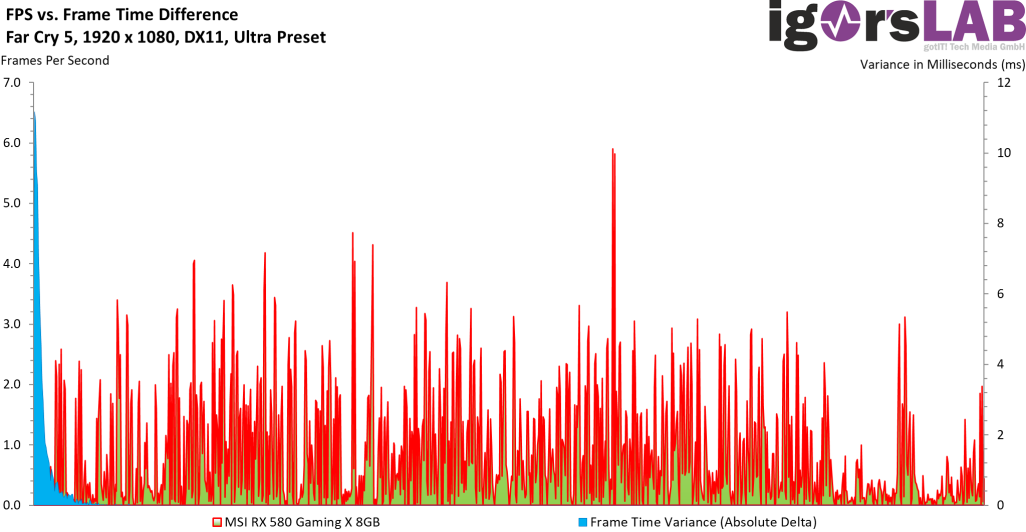
Welcome to the sandwich! The Radeon RX 5500 XT sorts itself well in front of the GeForce GTX 1650 Super, but has to come to terms with the lid of the GTX 1660, even if the percentiles seem much better. What’s interesting about this benchmark is that the memory size on Full HD doesn’t play a role, but (coincidentally) everything is classified in the range of measurement tolerances. The 4 GB version could also have been in front here, because there is no difference! However, the GeForce GTX 1060 doesn’t see any country and the RX 590 and RX 580 also have to queue further back.
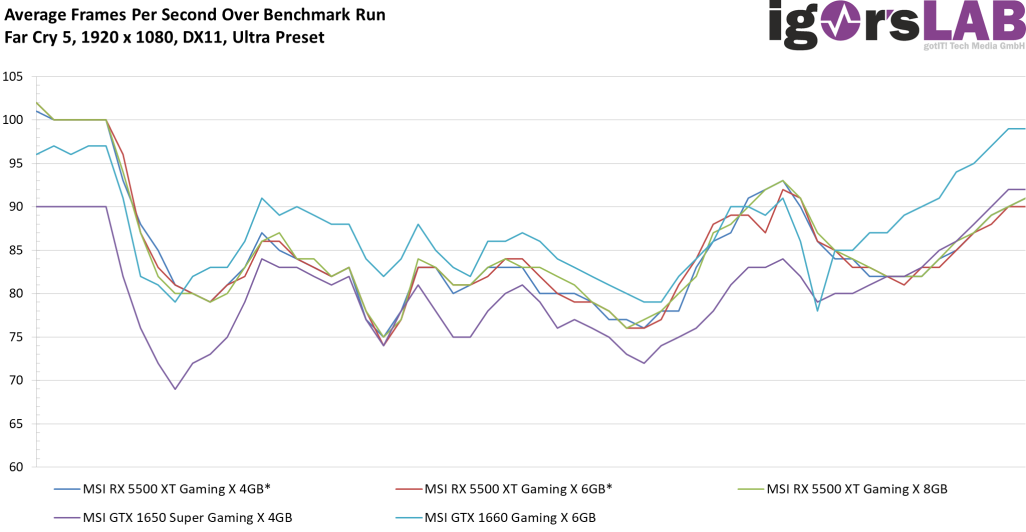
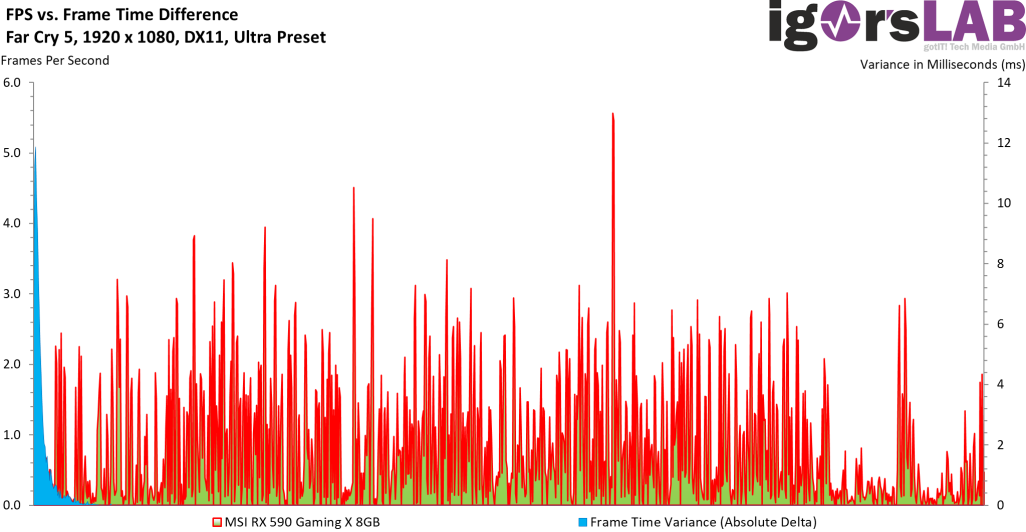
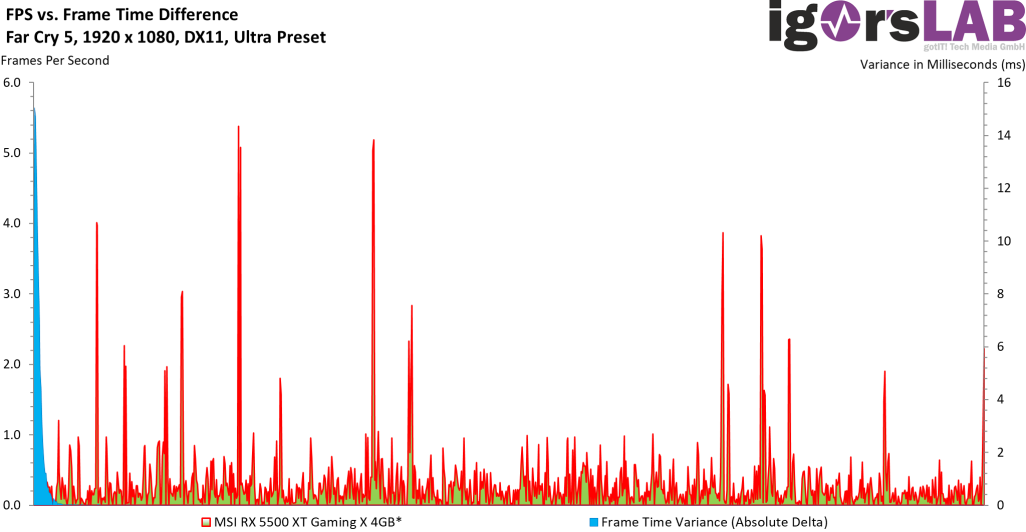
The whole thing is also available again for the FPS as a curve over the time of the entire benchmark run.
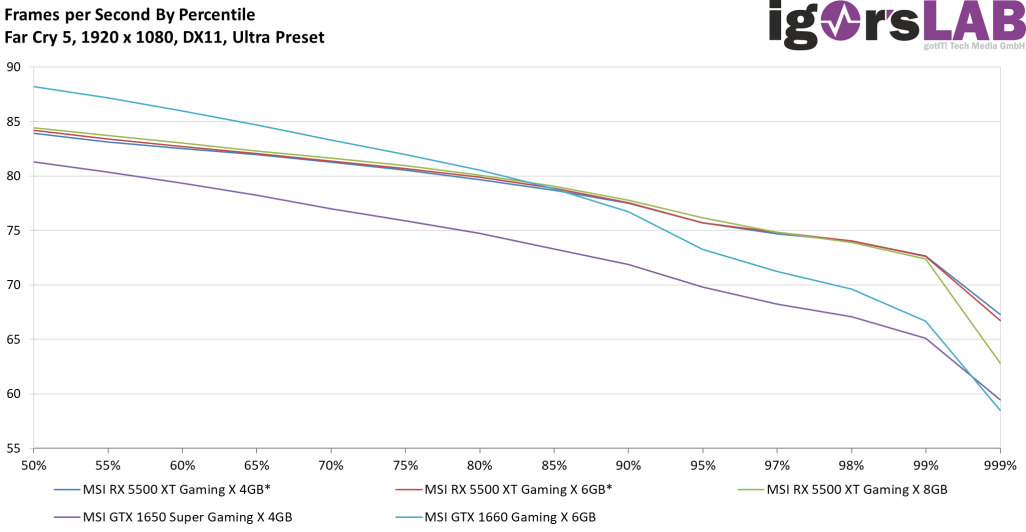
The percentiles as curve diagrams show very clearly that the individual burglaries apply equally to all cards.
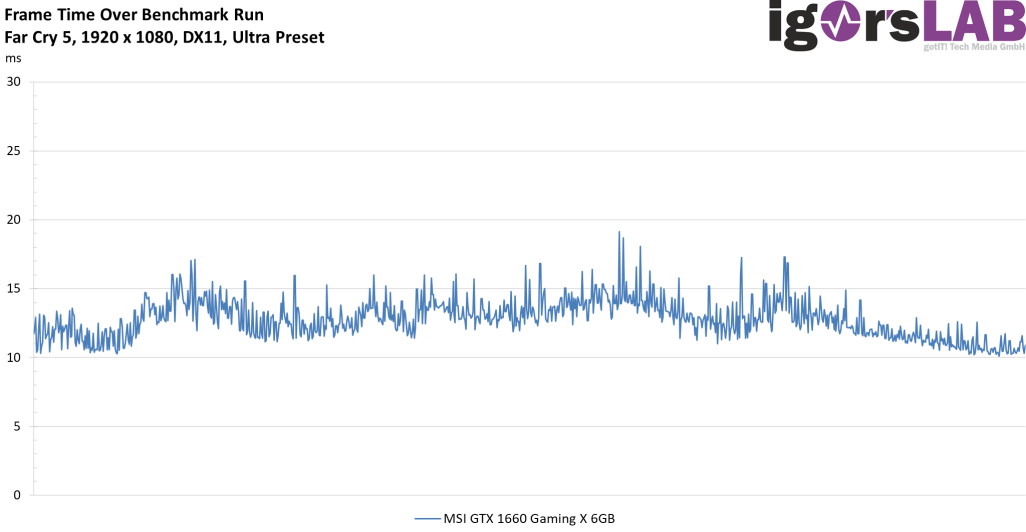
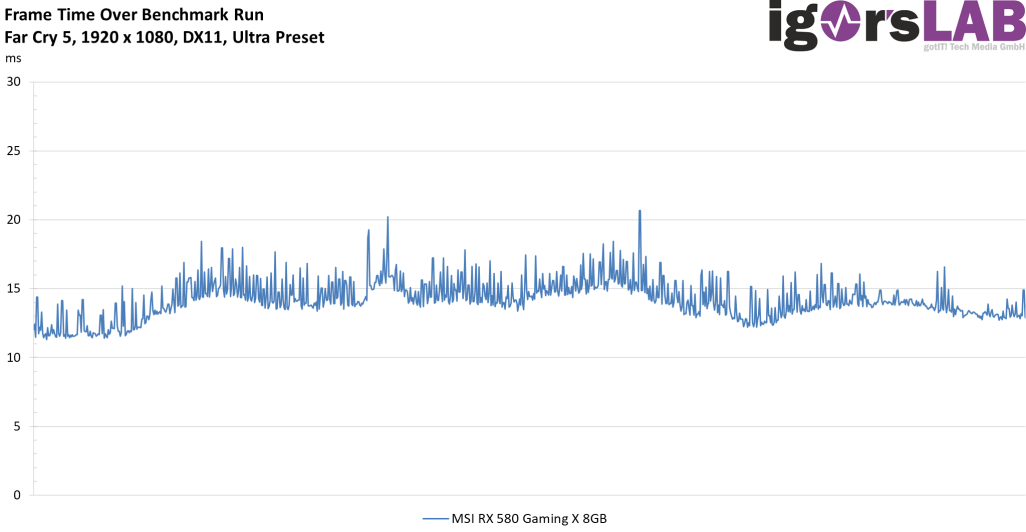
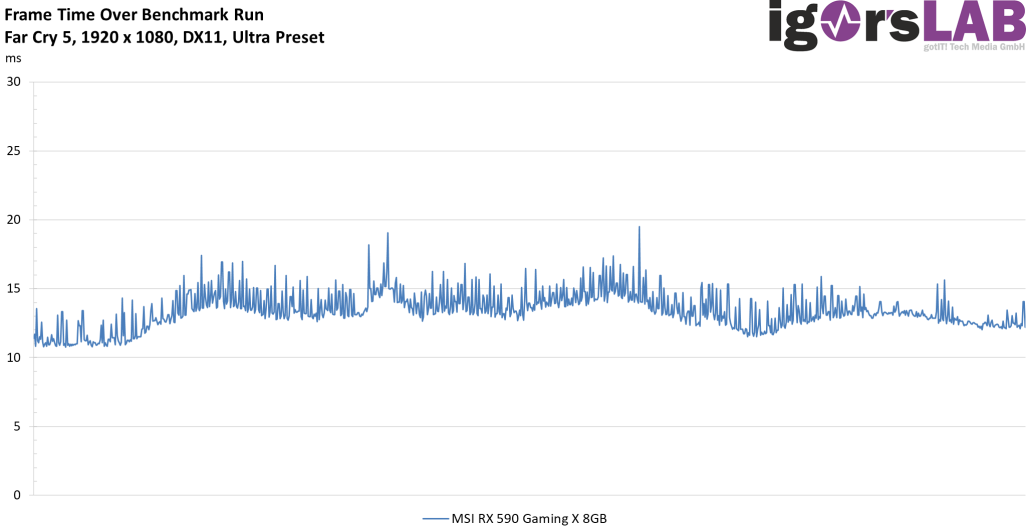
Also the Frame Times show a very similar behaviour for all tested cards.
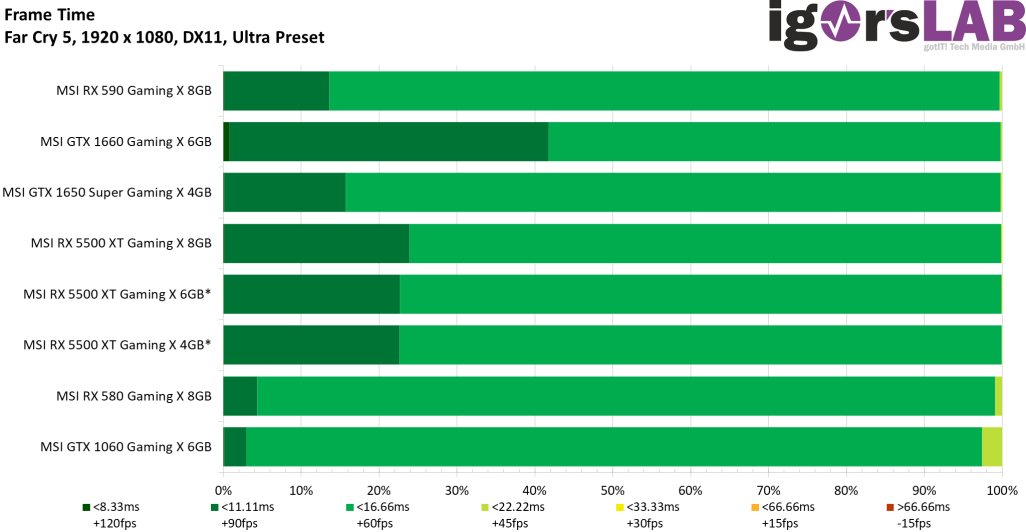
Let’s take a look in the bar chart now at the proportionate frame time areas in which the frames could be rendered.
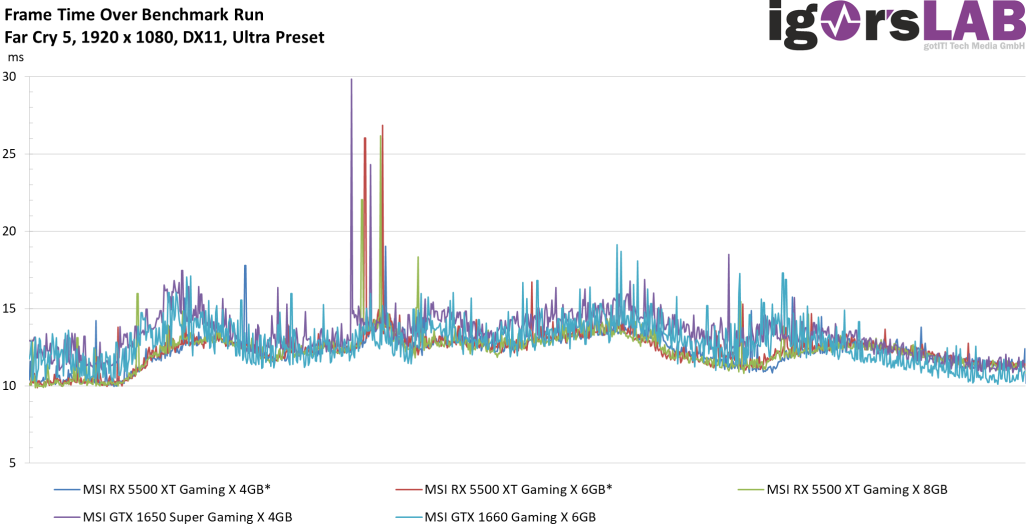
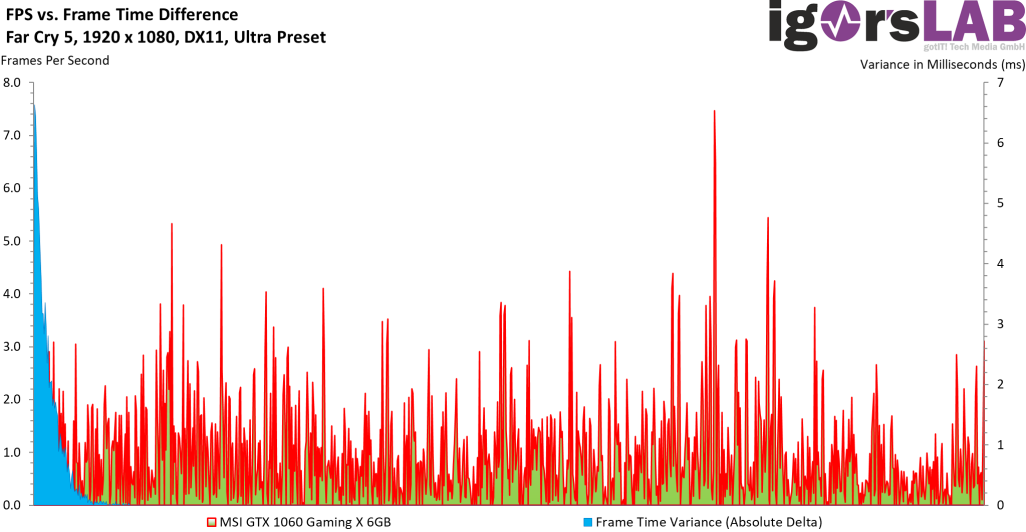
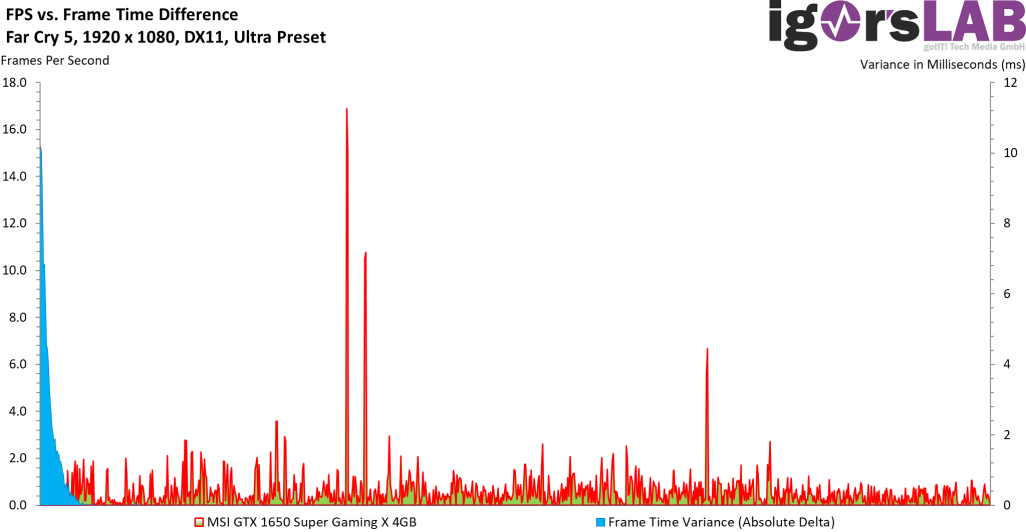
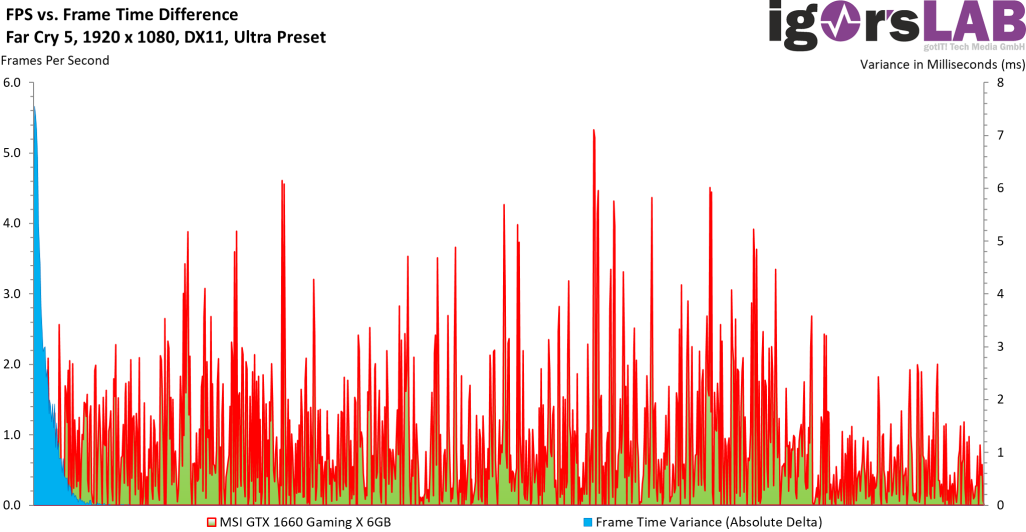
If you only consider the variances, i.e. the time differences between the output frames, you get a very interesting picture. The fastest cards do not always have to produce the softest image.
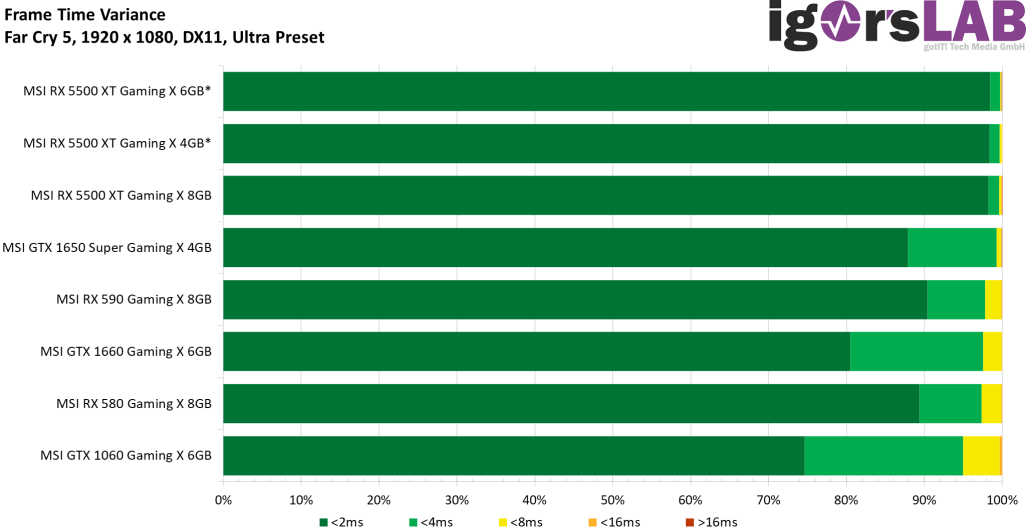
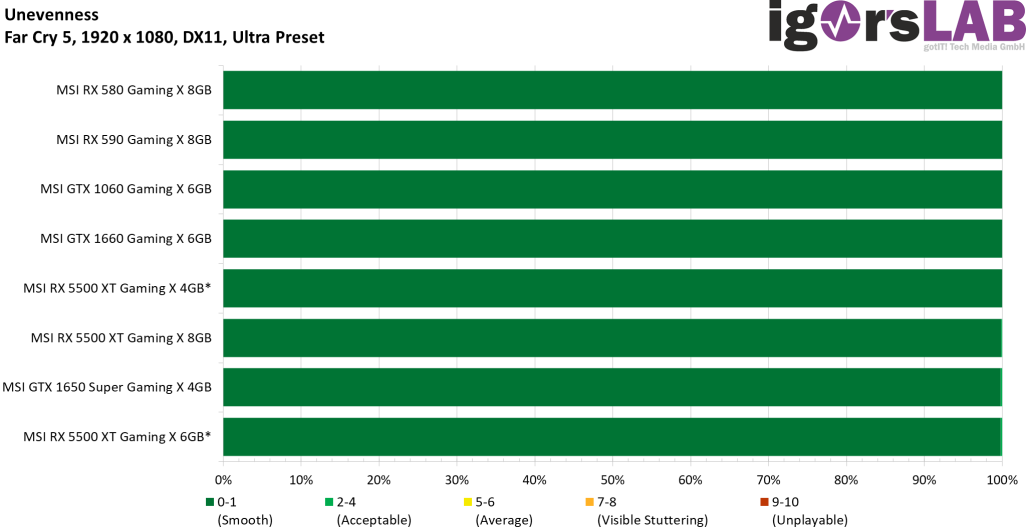
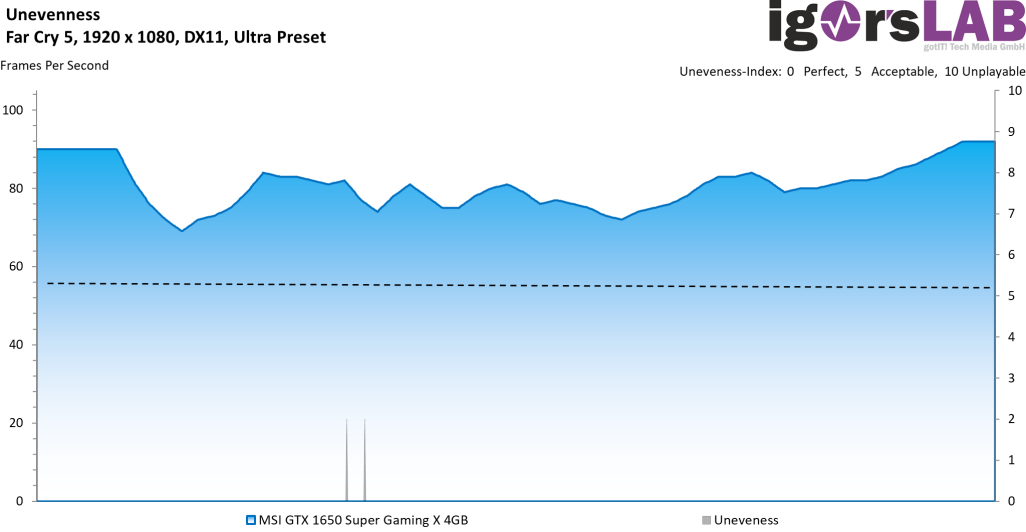
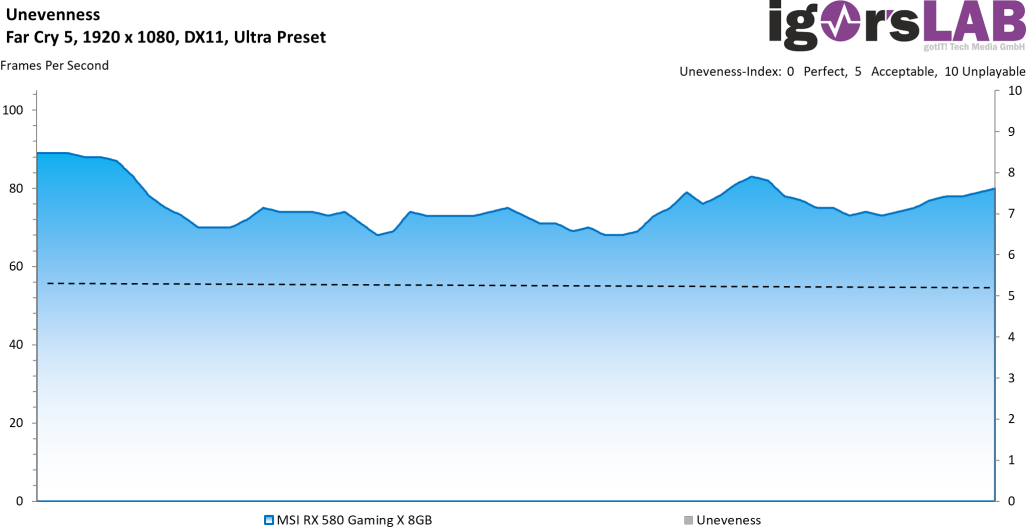
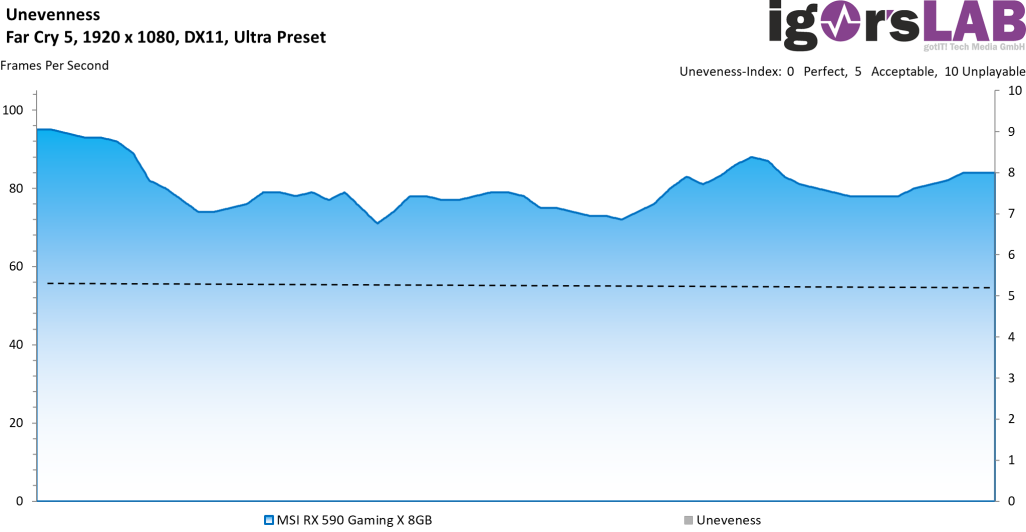
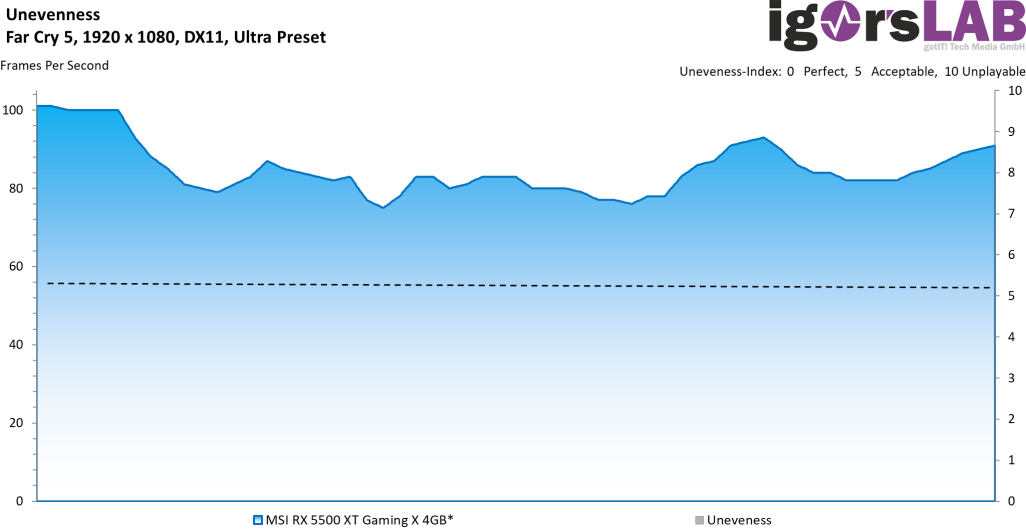
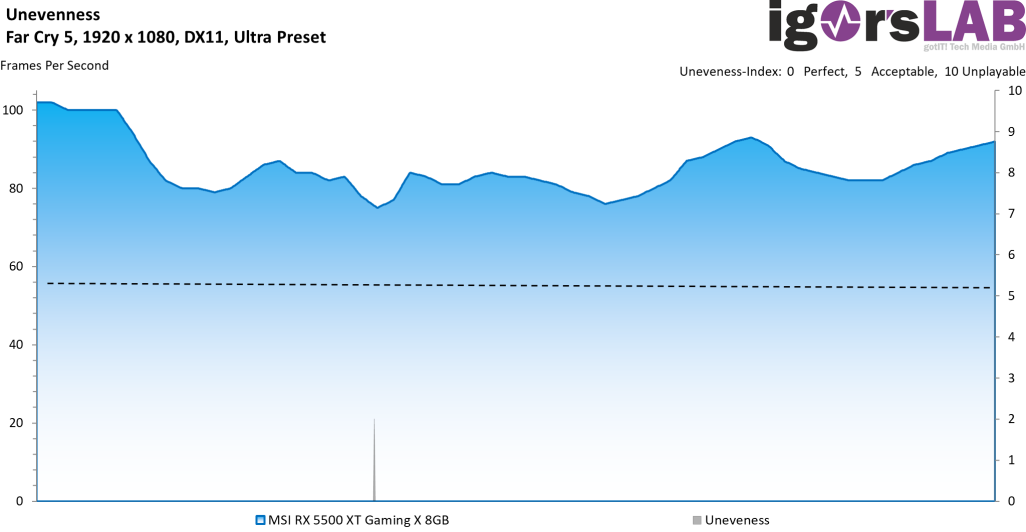
The Unevenness-Index also takes the real frame time into account, because even images that are output evenly but slowly can jerk considerably.
Single graphics for all tested cards to browse through


- 1 - Introduction and Overview
- 2 - 8 GB vs. 4 GB, important info and test system
- 3 - Tear Down: PCB and components
- 4 - Tear Down: cooling system
- 5 - DirectX 11: GTA V
- 6 - DirectX 11: Far Cry 5
- 7 - DirectX 12: Shadow of the Tomb Raider
- 8 - DirectX 12: F1 2019
- 9 - DirectX 12: Total War: Three Kingdoms
- 10 - DirectX 12: Tom Clancy's The Division 2
- 11 - DirectX 12: Metro Exodus
- 12 - Power consumtion and real PSU recommendation
- 13 - Clock rates, overclocking and temperatures with infrared
- 14 - Fan curves,fan speed and noise with audio-chamber test
- 15 - Summary and conclusion


Kommentieren