


Taktraten und Übertaktung
Of course you can’t compare the clock rates of both cards directly, but this is an important indicator. With the Wattman the RX 5500 XT from MSI could be easily overclocked to 1985 MHz in the peak, with the MorePowerTool even more by another 100 MHz. However, the whole thing quickly becomes as tough as honey in the cooling compartment and one will have to consider whether it is worth it at all. Nevertheless, a GeForce GTX 1660 won’t really be able to overtake, only the power supplier can cool the champagne. Whereby it turns out to be more moderate than expected, which in reverse also means that this Navi card is already operated far above the sweet spot.
The MSI GTX 1650 Super Gaming X 4GB has it all simple. Wattman with 110 percent power limit, 150 MHz with the GPU and with the memory simply according to God trust – that was it then already at expenditure. At full fan speed, you can even achieve 2.1 GHz or more – depending on the personal hit rate in the GPU lottery. But you will notice that a little bit in the performance. However, you won’t be able to catch up with a faster card if the GTX 1650 Super doesn’t run so well in one game in general.
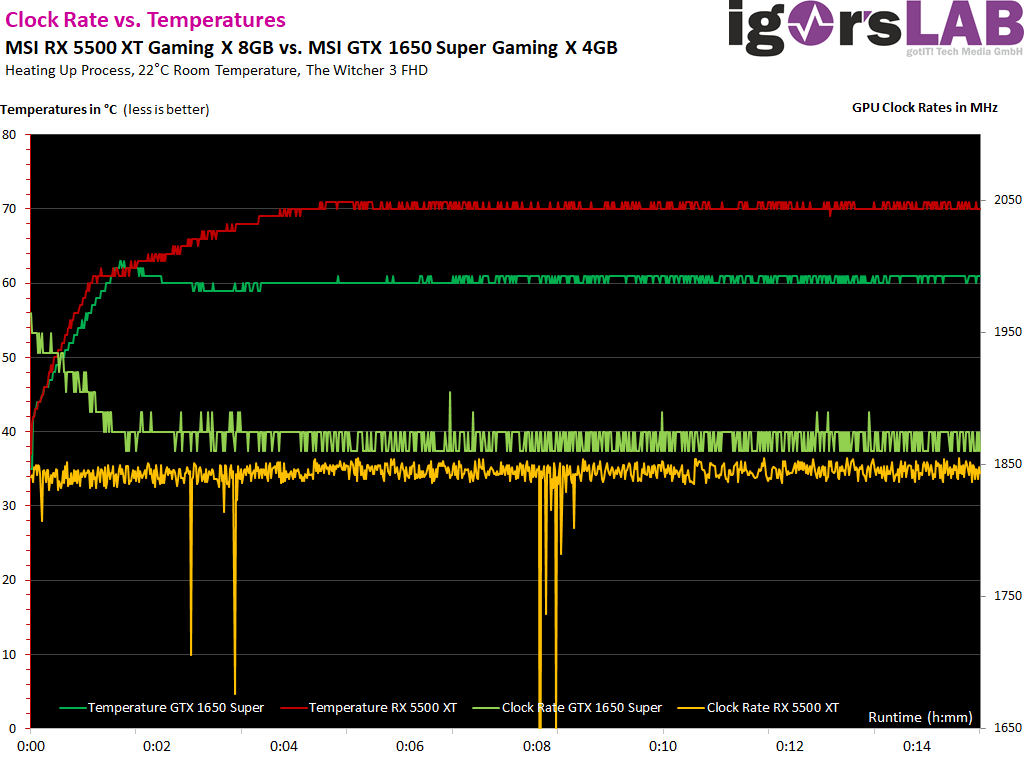
Normally with normal factory OC without manual intervention, the temperature curve and clock rates are as shown in the diagram. Despite the simpler cooler, the GeForce remains significantly cooler and you can see what the up to 40 watts more can make out in the cooling tasks. Nevertheless, there will still be a little surprise later in the noise emission.
And now the whole thing again in sober numbers in tabular form:
| MSI RX 5500 XT Gaming X 8GB |
MSI GeForce GTX 1650 Super Gaming X 4GB |
|
|---|---|---|
| Closed Case | ||
| GPU temperatures |
70-71 °C | 61-62 °C |
| GPU clock rate | 1842-1850 MHz | 1860 – 1875 MHz |
| Air temperure in closed case | 44 °C | 40 °C |
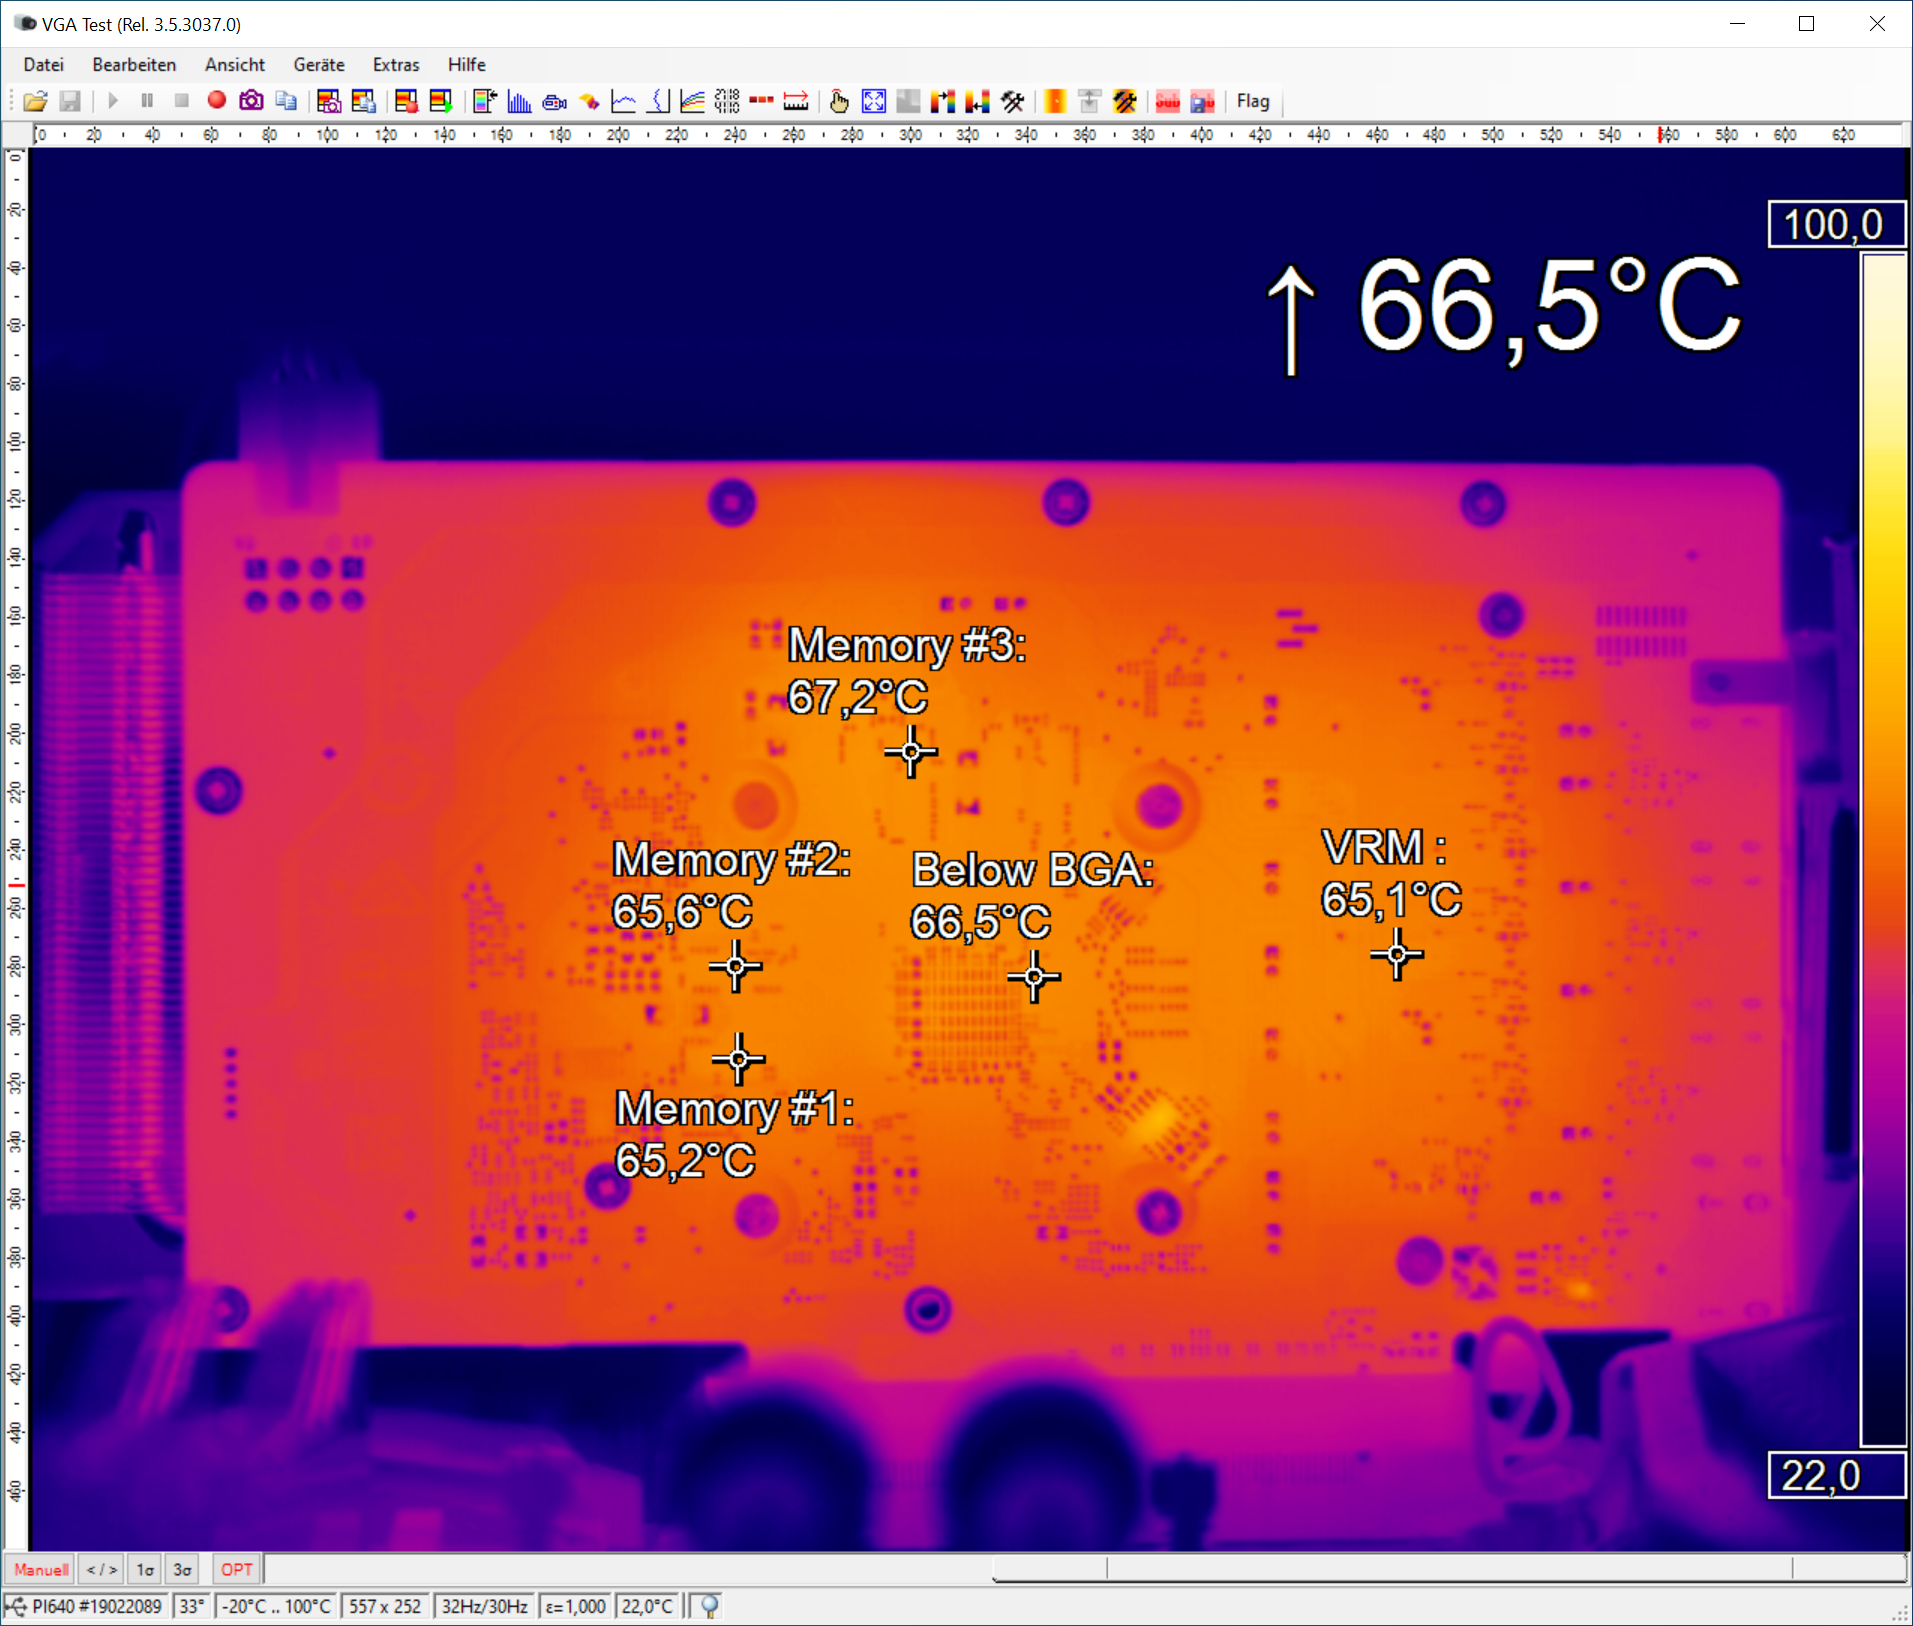
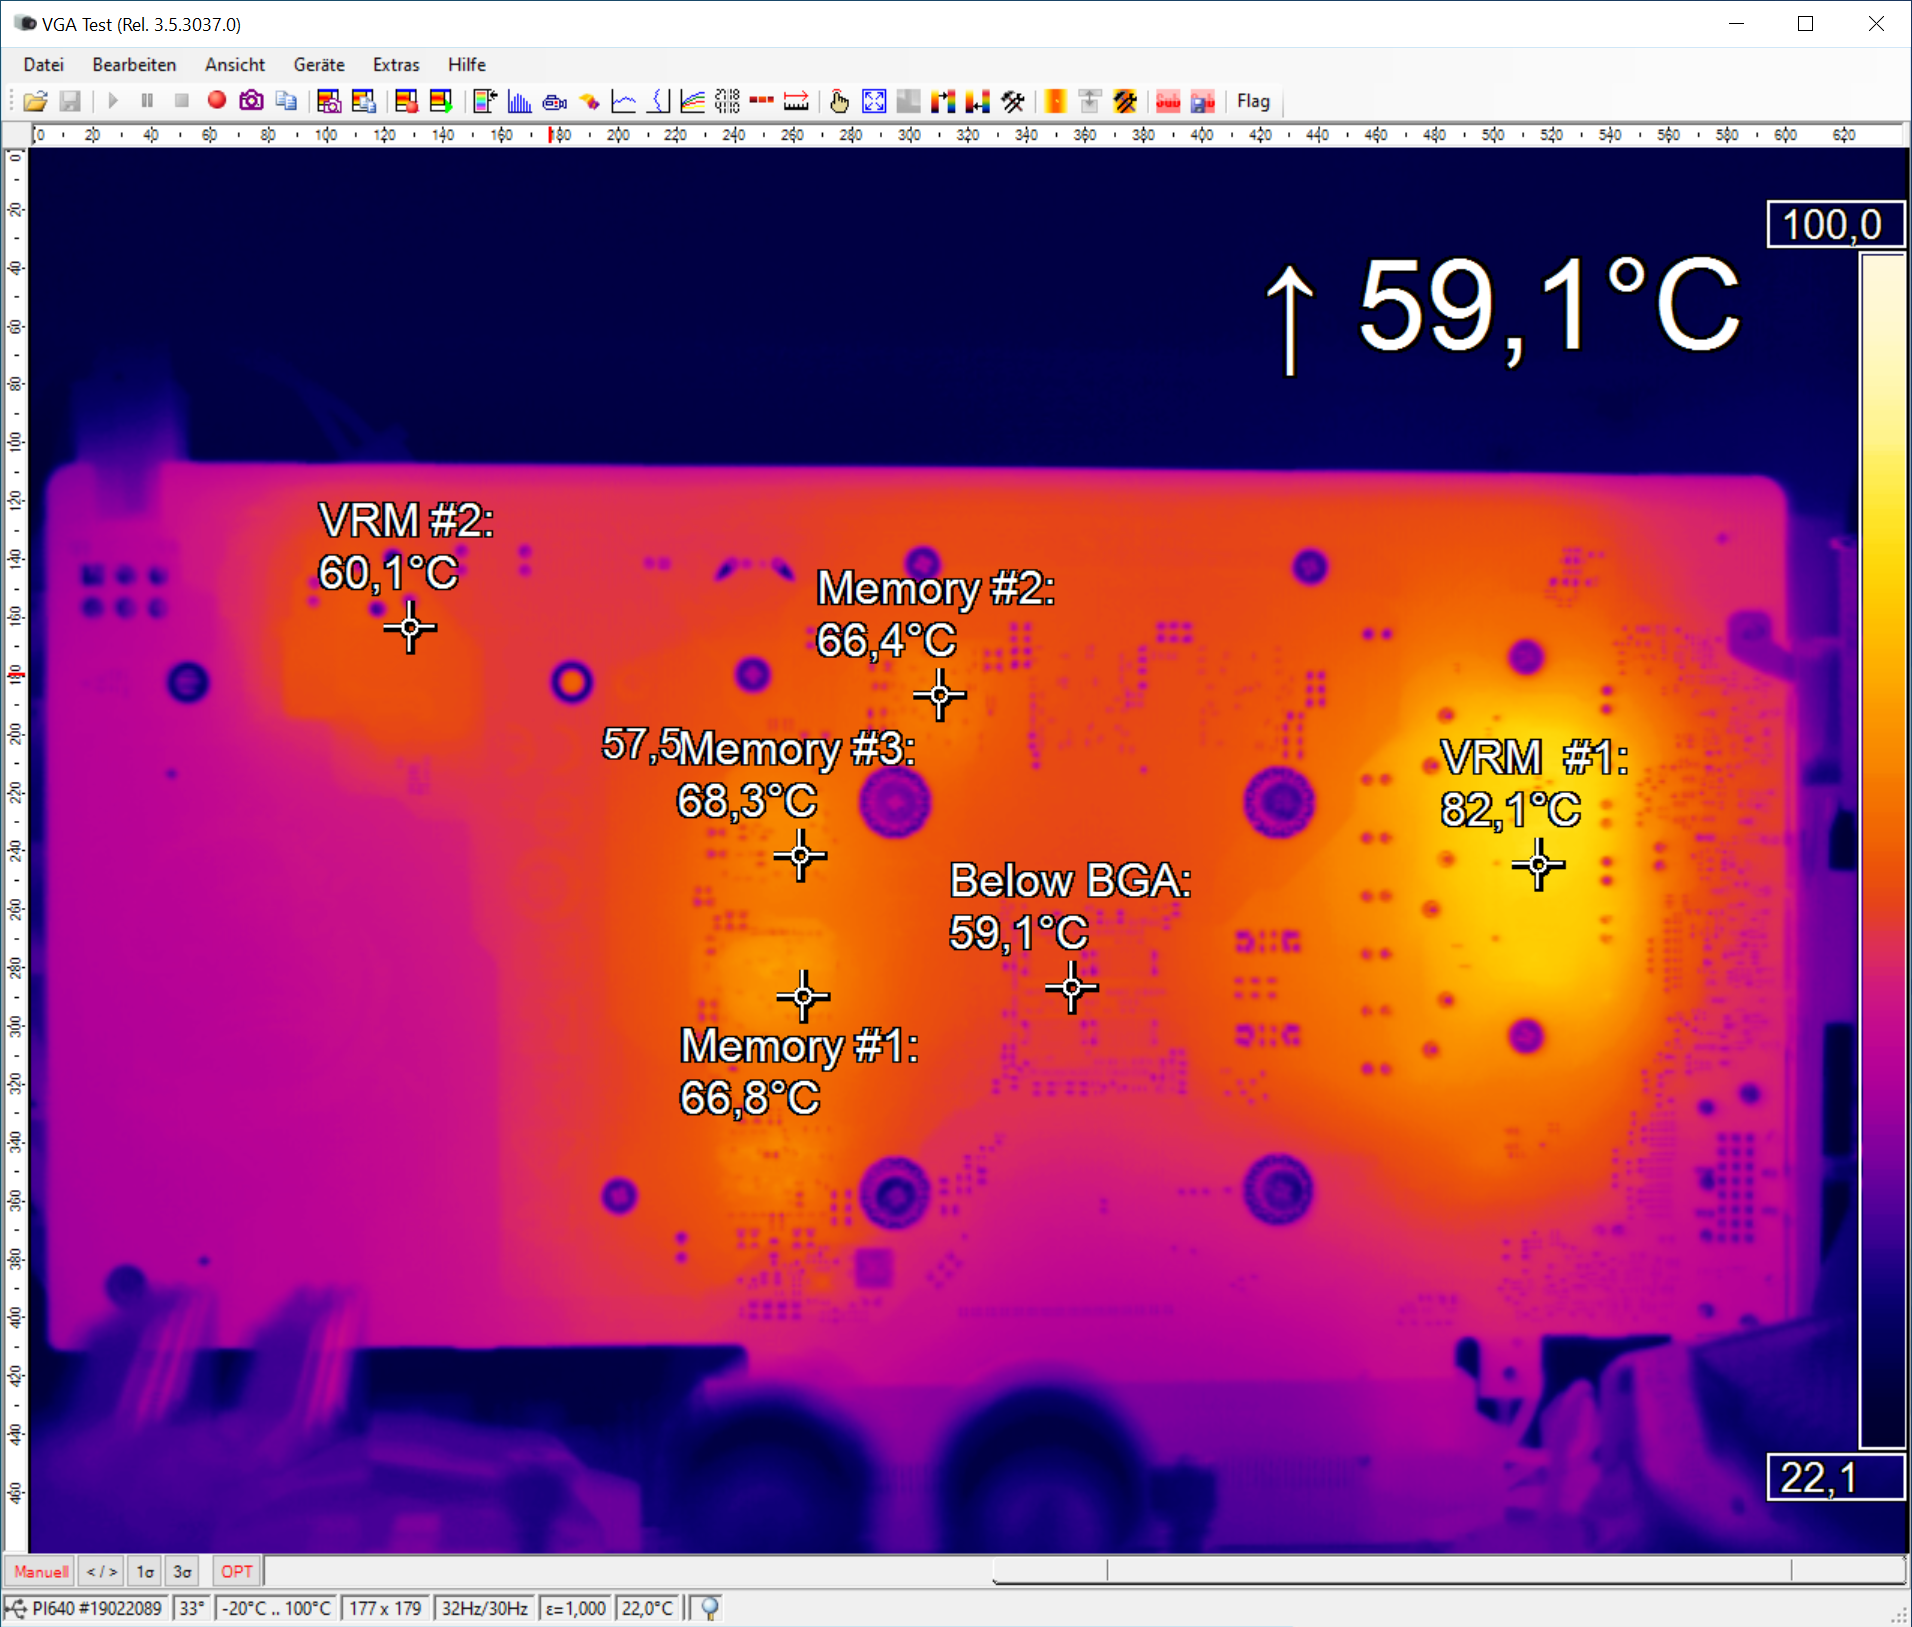
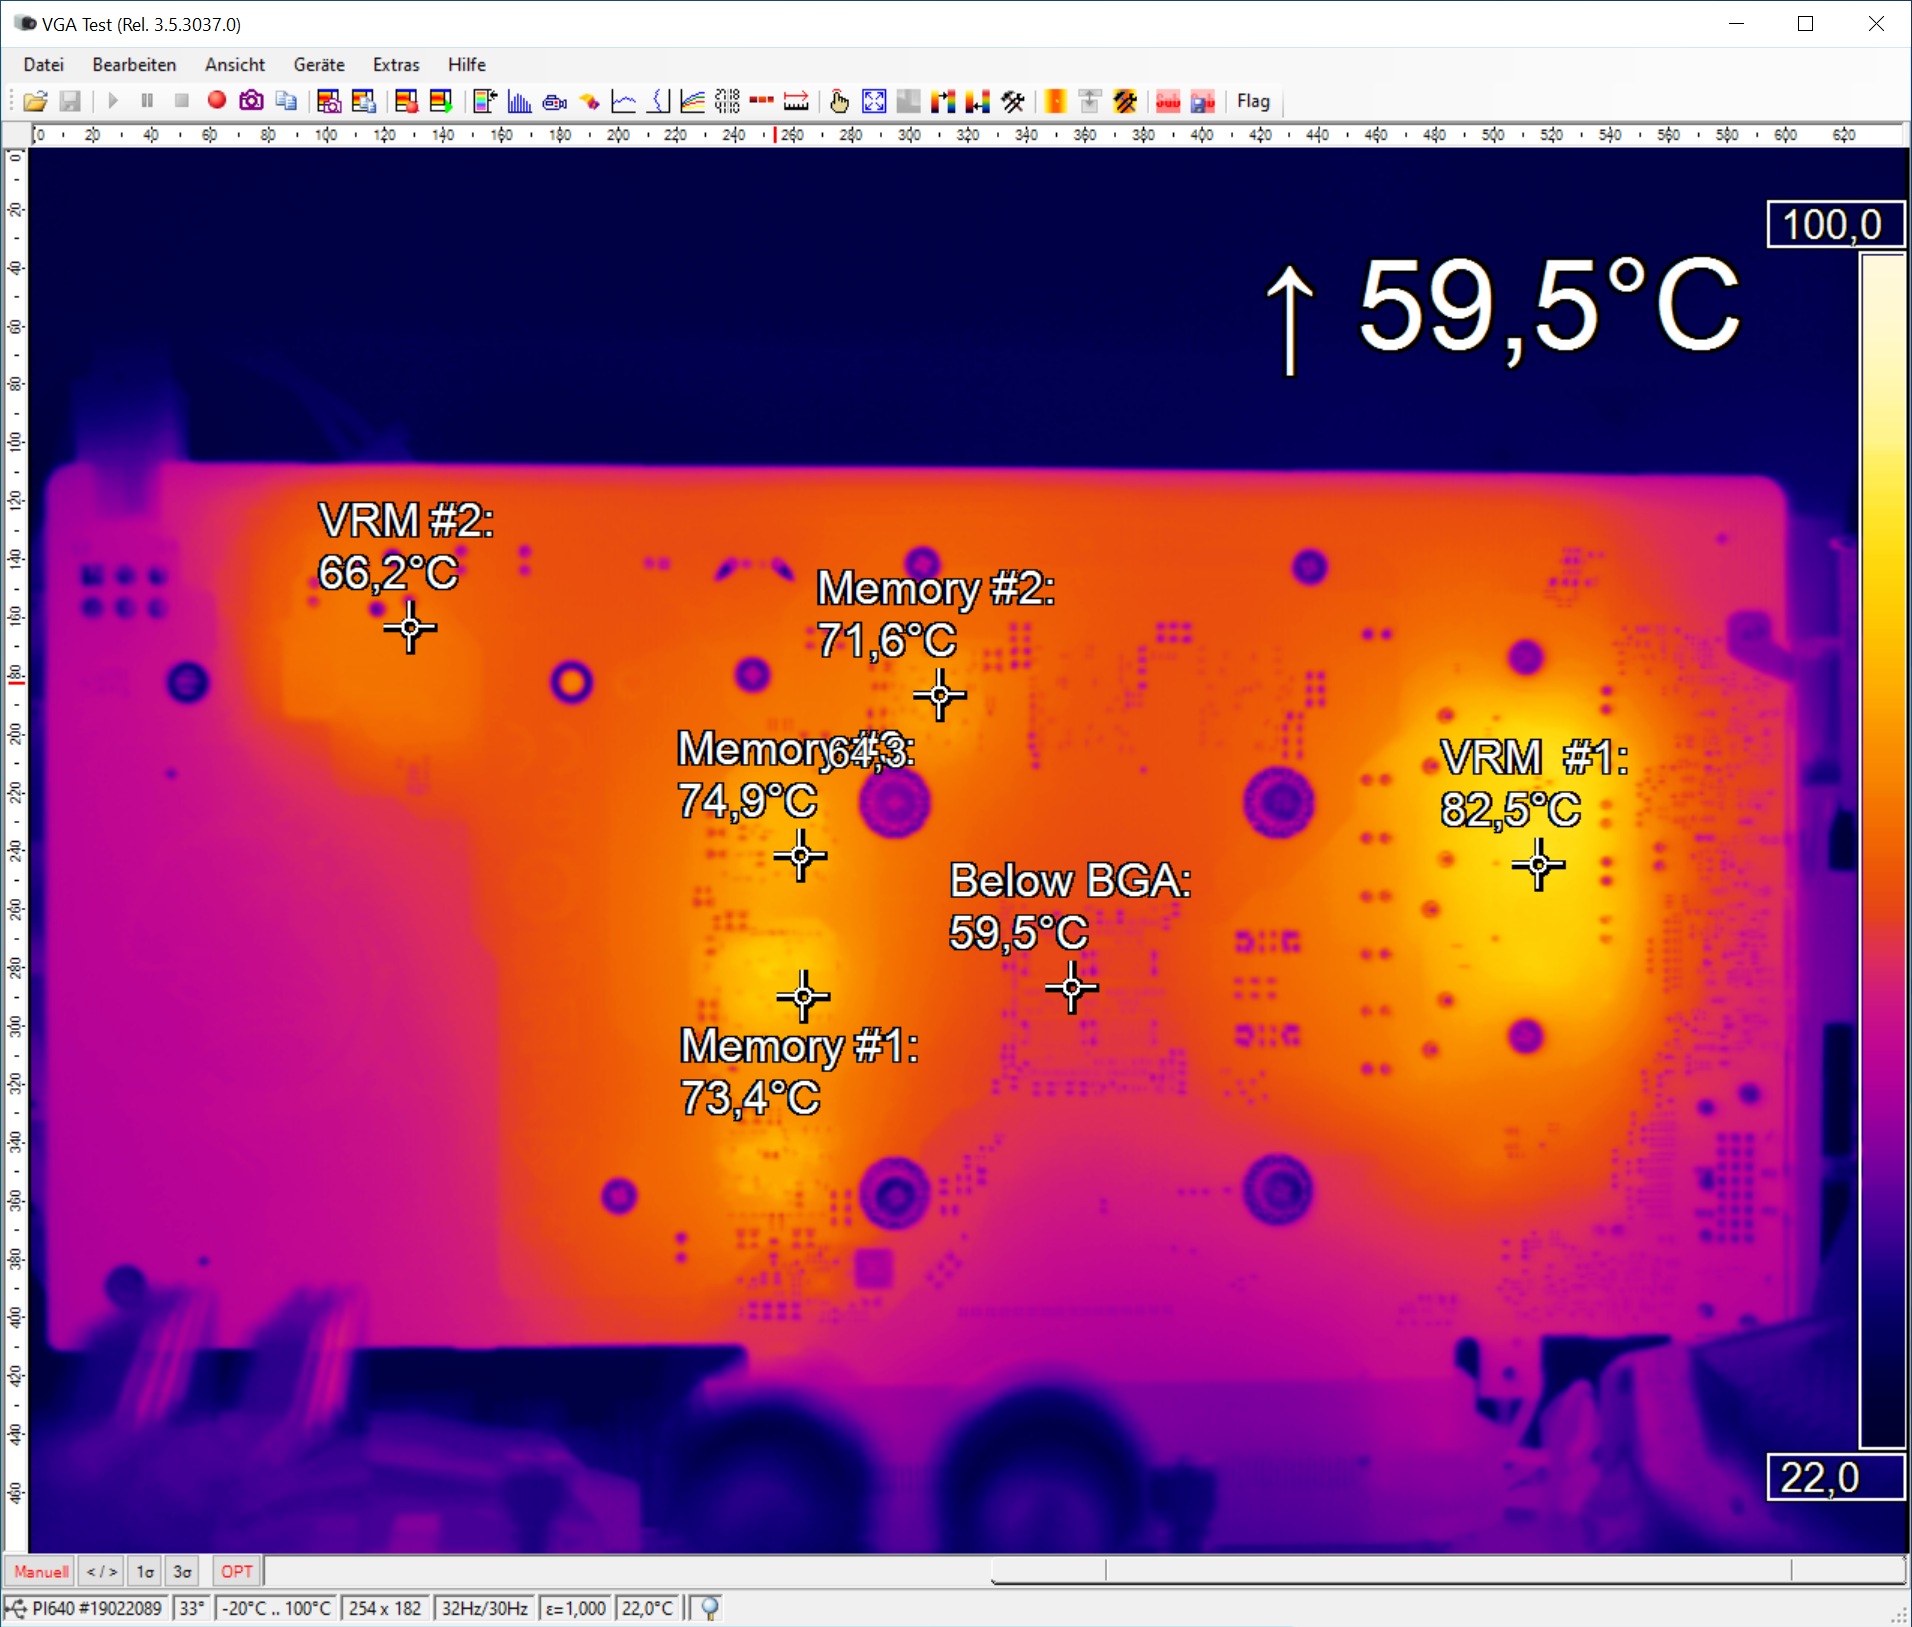
Infrared images of the MSI RX 5500 XT Gaming X 8GB
The following infrared images show the gaming and torture loop of the map. You can see a very even temperature spread over the whole board, which can be nice:
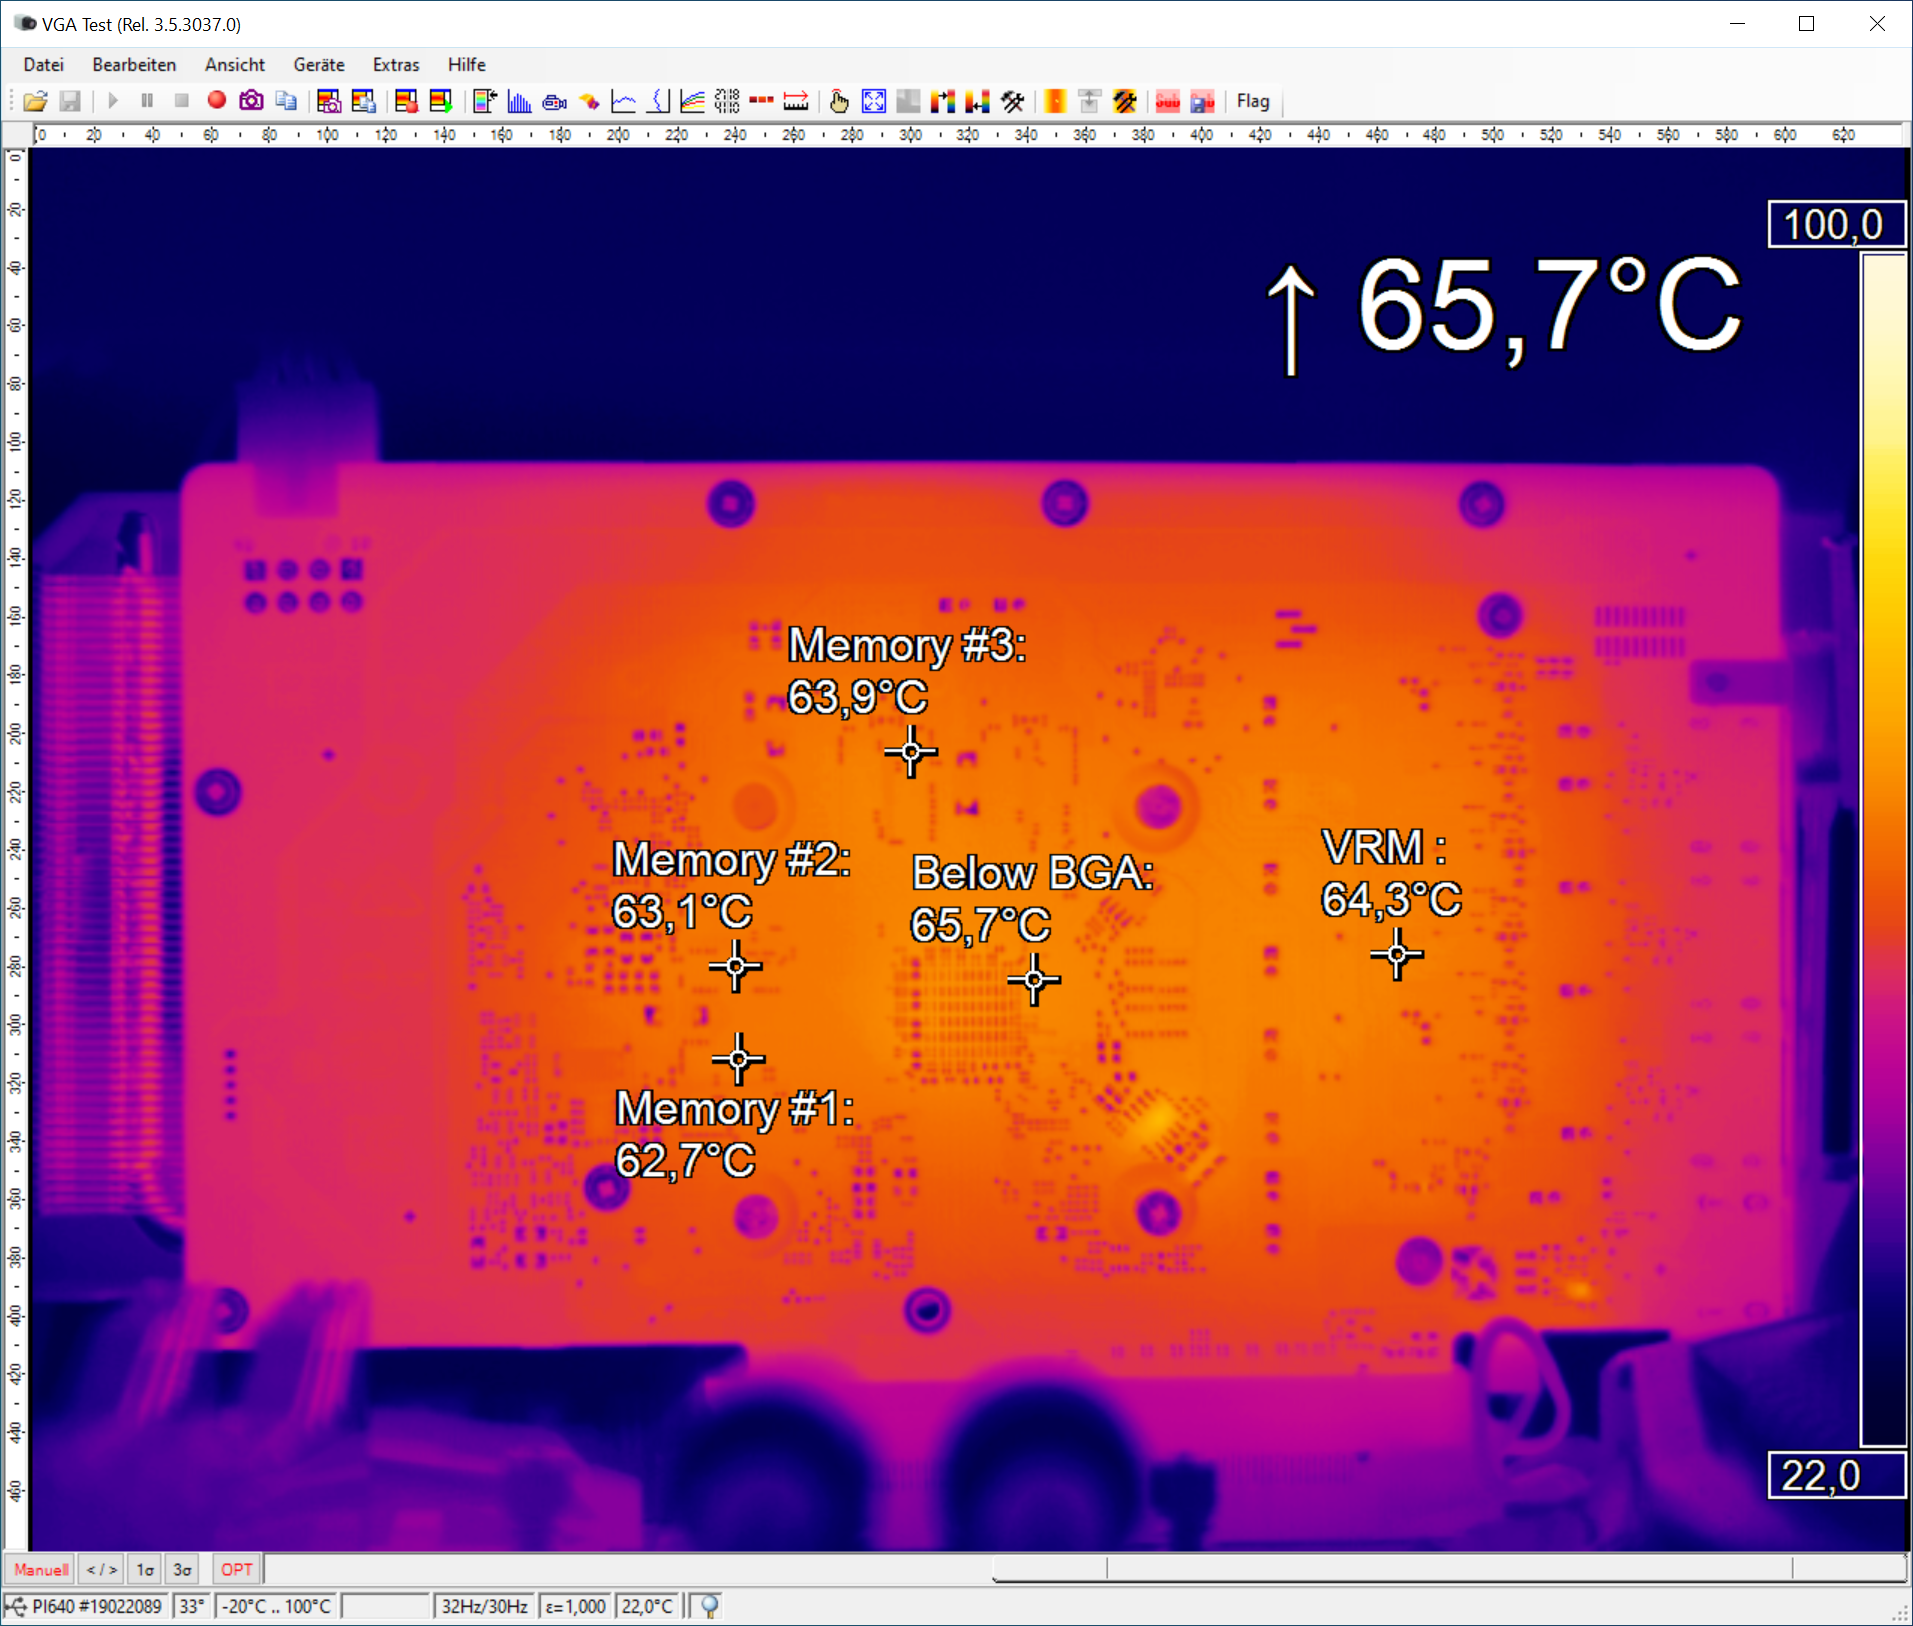
The board also makes a very good impression with the torture loop with 30 watts higher power consumption, only the fans now have to scoop up a little more air. But despite the red armband on the chip, everything is still green.
Infrared images of the MSI GTX 1650 Super Gaming X 4GB
The infrared images now show the gaming and torture loop of the Nvidia card. You can see a lot more hotspots and of course we remember the cooler construction on page four, which is much simpler knitted, because of course also less performance is faded. The GPU is cool, the memory too. Only the lonely voltage regulator troika has to sweat a bit. That’s not yet criminal and subject to reporting, but it also shows the drawbacks of the small Power Stages, whose cooling surface is of course much smaller.
However, the stress test looks very similar, because the power consumption hardly increases.
- 1 - Introduction and Overview
- 2 - 8 GB vs. 4 GB, important info and test system
- 3 - Tear Down: PCB and components
- 4 - Tear Down: cooling system
- 5 - DirectX 11: GTA V
- 6 - DirectX 11: Far Cry 5
- 7 - DirectX 12: Shadow of the Tomb Raider
- 8 - DirectX 12: F1 2019
- 9 - DirectX 12: Total War: Three Kingdoms
- 10 - DirectX 12: Tom Clancy's The Division 2
- 11 - DirectX 12: Metro Exodus
- 12 - Power consumtion and real PSU recommendation
- 13 - Clock rates, overclocking and temperatures with infrared
- 14 - Fan curves,fan speed and noise with audio-chamber test
- 15 - Summary and conclusion


Kommentieren